What periods / lengths (lookbacks) do daytraders use in ThinkOrSwim?

TechGuy

Member
Plus
I like the ideas of these indicators but concerned about the long periods (moving averages of 200 and 150) in these scripts. What do day traders use for same day or several day time periods?

TrendCylinder (Expo) for ThinkOrSwim
https://usethinkscript.com/threads/trendcylinder-expo-for-thinkorswim.16596/
nGLHFIm.png


Z-Score Heikin-Ashi Transformed for ThinkOrSwim
https://usethinkscript.com/threads/z-score-heikin-ashi-transformed-for-thinkorswim.15964/
3KfhHhv.png
 
Last edited by a moderator:
This seems like the kind of thing you need to experiment with, both chart time frame and MA length settings. also market to market different settings might work better (ex: i have a tick chart indicator i like that works well on 2k tick /ES but i use 512 tick for /CL).

There is rarely a 'right' answer for things like this, just about finding what works well for you.

If you were simply asking for common timeframes/MA lengths for intraday trading, these are ones i have seen used a lot

TF: 1, 3, 5, 15, 30 minute
MAs: 10, 20, 50, 100, 200

It also may be worth testing them on tick charts which I have come to prefer for intraday trading

Hope this helps
 
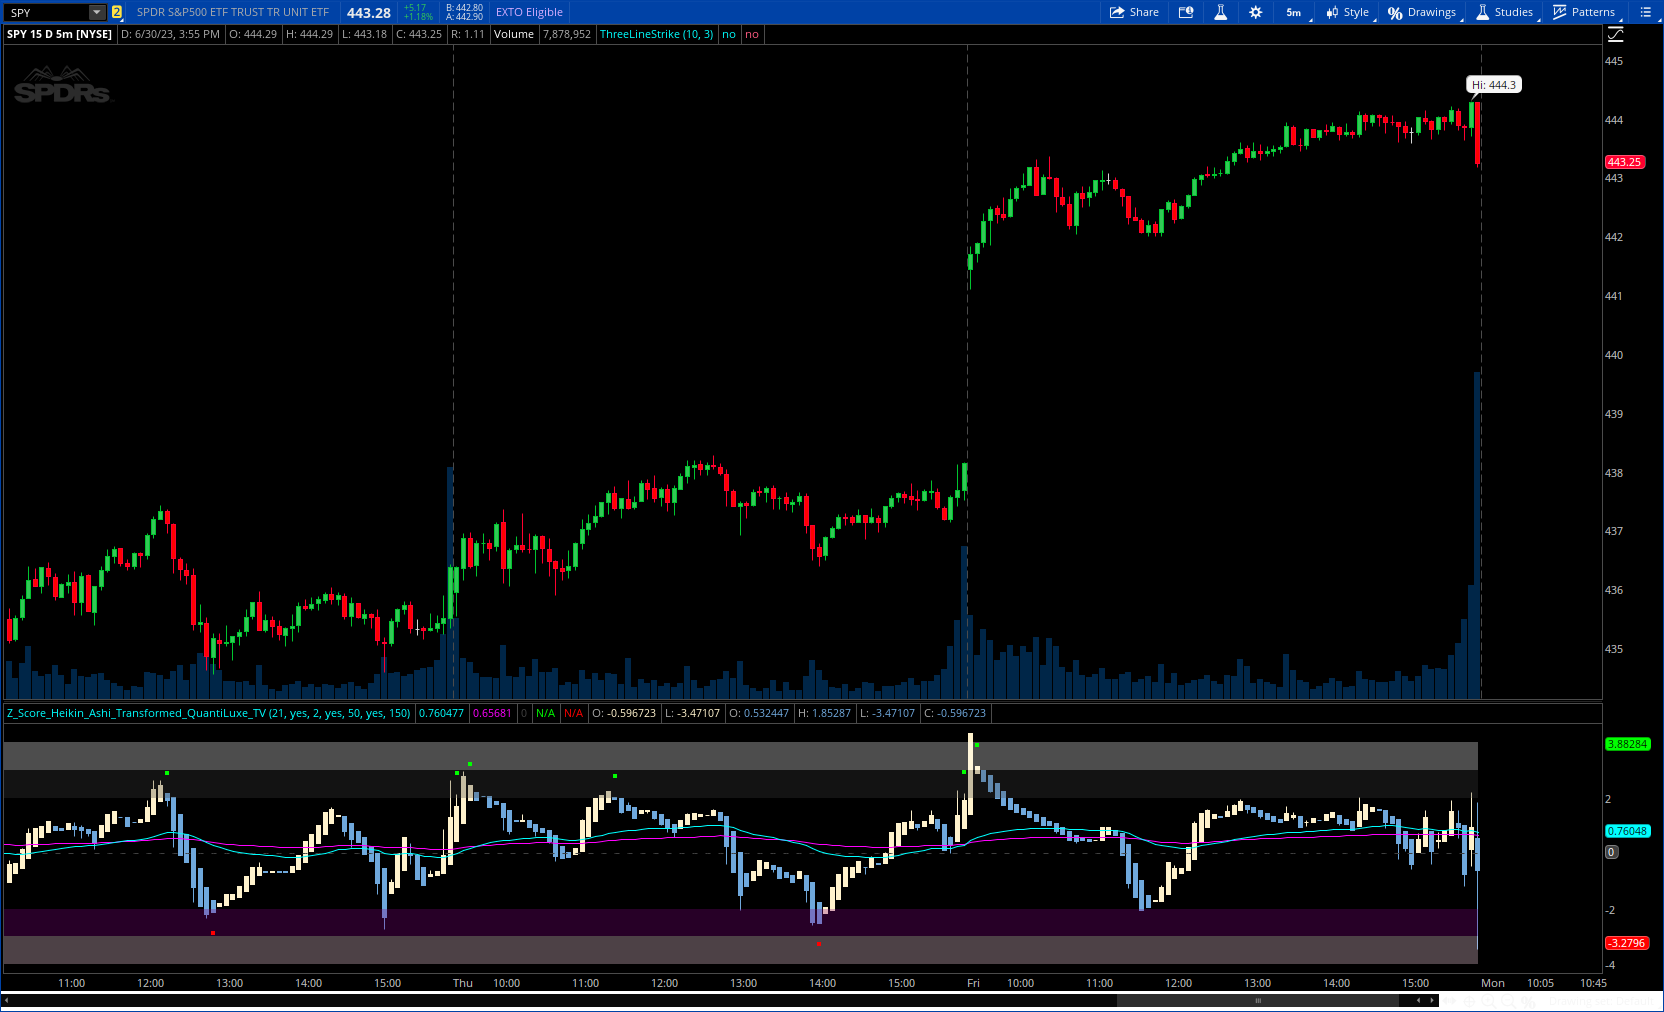
@Babel explanation above is correct when working with TREND indicators or momentum/trend oscillators.

Moving averages and some other trend indicators LAG.
The longer the lookback, the longer the lag.
Therefore, with Trend Indicators, shorter lengths are required on smaller timeframes to reduce the amount of lag when looking for entry.


HOWEVER, your first example is a
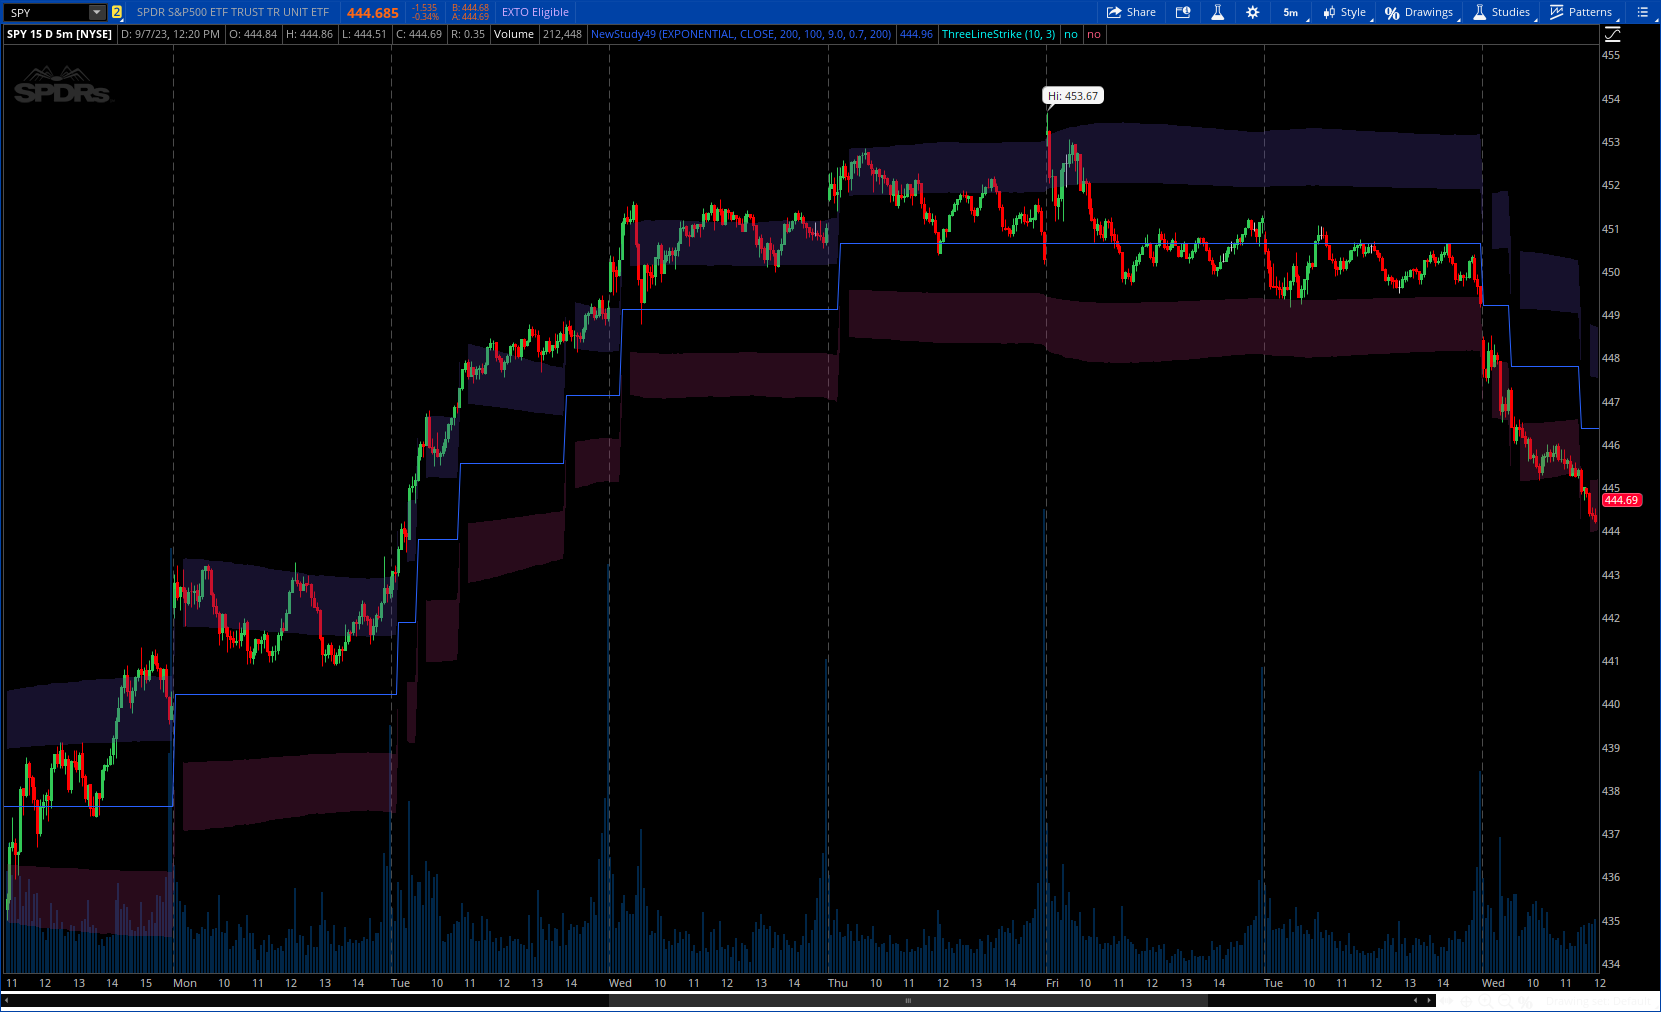
 Channel Indicator.
Channel / Range / Band indicators are attempting to define what dynamic range an instrument "normally" trades. To determine this, it is important to lookback over a much much longer length.

This will provide insights into price movement. High range signifies volatility, appealing to short-term traders. Also, movement outside of normal which is always of interest to traders.

To find a normal range on daytrading aggregations, the default of 200 bars is generally textbook;
although 150 bars can also be found depending on the volatility of the instrument and the market.
This will allow a visual display of what the range has been for the past x days; which is long enough to filter out noise and give a clear analysis of what this stock's activity has been compared to where it is currently.

Generally the default lookback is not changed on range indicators regardless of timeframe.
On shorter-term charts, you want to see the dynamic range over a few days.
On your longer-term charts, such as daily; you want to see the dynamic range over the past year.
(FYI, read more about why you do your analysis of three timeframes:
https://usethinkscript.com/threads/best-time-frame-for-trading-for-thinkorswim.12209/)

However, this has been a very volatile past 12 months.
Started with a deep bear market. Had an AWESOME January, April, and July, and now we are in the throes of the Aug-Sep correction. On my daily charts, I want to see where the instrument is now compared to the previous bullish periods, so I shorten up my long-term charts lookback to about April or so.

In summary, channel indicators are the opposite of trend indicators.
If considering changing the channel lookback, optimal is LONGER on Lower timeframes;
perhaps sometimes SHORTER on Higher timeframes.
 
Last edited:
As I have posted here before, and the advice I give to younger traders that I mentor, is the time frames that a trader uses are very dependent on 1) the product they are trading, 2) the volatility of that product, and 3) the holding period for that trade. As an example, I day trade the /NQ, which is the NASDAQ 100 futures. It is very volatile, and moves quickly. It can easily move 50 - 100 points in minutes. A 50 point move is $1000 per contract. That is in minutes. So positioning and stops are critical. To answer your question, I always have a daily chart running in a small window for a global view of this product. But my main trading is to watch a 15 minute chart for an overview, a 5 minute chart for the "setup - MA relationship" and a 2 minute chart, very large, where I get the "trigger - MA cross or price pattern" and do all of my trading on. On each chart I have moving averages. Usually a 3 and 9 MA for crossover triggers. Adding a 20 & 50 MA on each gives a nice view of the trend on that time frame. More importantly, I watch for candlestick formations and price patterns, such as double tops and bottoms. The most important thing to watch for is higher highs and higher lows for a bullish bias, lower highs & lows for bearish bias. It all sounds like a lot, but once you have the charts and a few alerts setup, it is just a matter of watching and waiting. I hope some of this helps, Scott.
 

Join useThinkScript to post your question to a community of 21,000+ developers and traders.

Similar threads

Not the exact question you're looking for?

Start a new thread and receive assistance from our community.

87k+ Posts
419 Online
Create Post

Similar threads

Similar threads

The Market Trading Game Changer

Join 2,500+ subscribers inside the useThinkScript VIP Membership Club
  • Exclusive indicators
  • Proven strategies & setups
  • Private Discord community
  • ‘Buy The Dip’ signal alerts
  • Exclusive members-only content
  • Add-ons and resources
  • 1 full year of unlimited support

Frequently Asked Questions

What is useThinkScript?

useThinkScript is the #1 community of stock market investors using indicators and other tools to power their trading strategies. Traders of all skill levels use our forums to learn about scripting and indicators, help each other, and discover new ways to gain an edge in the markets.

How do I get started?

We get it. Our forum can be intimidating, if not overwhelming. With thousands of topics, tens of thousands of posts, our community has created an incredibly deep knowledge base for stock traders. No one can ever exhaust every resource provided on our site.

If you are new, or just looking for guidance, here are some helpful links to get you started.

What are the benefits of VIP Membership?
VIP members get exclusive access to these proven and tested premium indicators: Buy the Dip, Advanced Market Moves 2.0, Take Profit, and Volatility Trading Range. In addition, VIP members get access to over 50 VIP-only custom indicators, add-ons, and strategies, private VIP-only forums, private Discord channel to discuss trades and strategies in real-time, customer support, trade alerts, and much more. Learn all about VIP membership here.
How can I access the premium indicators?
To access the premium indicators, which are plug and play ready, sign up for VIP membership here.
Back
Top