Weekend Trend Trader by Nick Radge Strategy for ThinkorSwim

gamgoum

New member
I stumbled upon this forum by searching for some of the momentum strategies by Nick Radge (thechartist.com.au), I found @Zachc 's brilliant post on the Bollinger Bands BReakout strategy which Nich wrote about in his book "Unholy Grails", I would like to thank @Zachc and the forum members responding and enriching his post.

I was looking for an implementation of the "Weekend Trend Trader" strategy from the book with the same title by the same Author.
I decided to tweak the code from @Zachc and I share the modified code below.

First some general parameters of this strategy, details for which you can read in the book Weekend trend trader Ebook by Nick Radge

General info about the strategy:
The strategy is a designed for long term momentum (trend) trading and with minimum trading activity in mind, only weekly signals are reviewed after the close and trades are placed for Monday at the open. Day or Intraday signals are irrelevant for this strategy.
This strategy is long only.
Recommended allocation by the author is 5% of total account capital on each position.
The strategy calculates trailing stops but the author recommends not to enter them as stop loss orders on your trading system but only to place the sell order if needed after the week's close to avoid potential whipsaws on the daily action.

Criteria for trade entry:
  1. Stock must be making 20 week High
  2. Stock's Rate of Change must be >= 30%
  3. Market Index close price must be higher than its 10 Week moving average (implemented by an index filter on SPX, NDX, RUT or whatever is the relevant index)
If all three conditions above are met, you may enter a trade on the Monday at market open, if any of them is not met, do not enter a new trade.

Criteria for trade exit:
  1. If the market index is still positive (close of SPX for example > 10 Week average) then the recommeded trailing stop is 40% below the highest weekly close.
  2. If the market index turns negative (close of SPX for example < 10 week average) then the recommended trailing stop is moved to 10% below the highest weekly close.
  3. The trailing stop is never moved down, always moved up
  4. If market recovers after a negative turns we will not change the trailing stop unless the new trailing stop is higher than the older one.
  5. sell orders are not entered on the trading platform untill the review of the weekly signals after the Friday close and then any sell orders neede are placed on Monday.
I think my code requires a bit of fine tuning still to map the trailing stop details, but I wanted to get started and test with a rough approximation. I would approeciate your feedback and suggestions on how to optimize it.

Ideas for scanning for potential stocks:
I tried to combine 20 weeks high with Rate of change > 30% but the output of such a scan was very limited (perhaps due to current volatility in the markets. A more reliable scanner I found was to scan for ROC >10% over last 20 weeks and for stocks at least 10% above their 200 DMA.
You can use other momentum scanners and let me know if you find something relevant.
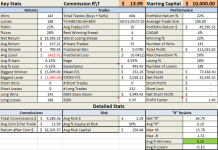
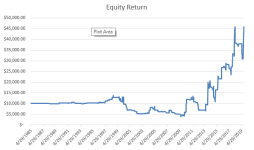
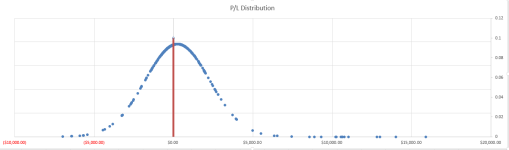
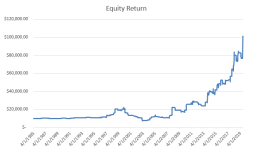
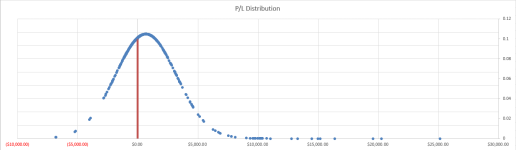
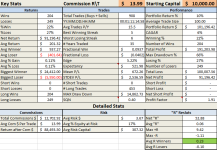
Snapshots:
A snapshot from how it looks (which is very familiar to the Bollinger BAnd BReakout by @Zachc as it's the same code pretty much with a tweak of the rules of course)

ROKU-weekend-trend-trader-strategy.jpg


Code:
Code:
##Nick Radge Weekend Trend Trader Strategy
##Credit to @Zachc for sharing his Bollinger BAnd BReakout strategy, the basis for this midfied code
##Strategy used on a Weekly timeframe, scan on Friday after close
#
## Entry conditions:
#---------------------
# 1) Stock makes new 20 weeks high
# 2) Market close is > 10 week MA of index
# 3) 20 Week Rate Of Change is >30%
# If stock satisfies all 3 conditions you may place your buy order for the Monday Open
#
## Exit conditions:
#-------------------
# 1) Initital trailing stop is set 40% below High of the closing Week
# 2) IF Market filter turns down then then stop is moved up to 10% of high of the recent week
# 3) Stops are always moved up and never down
# 4) IF market filter turns up the stop level is maintained until a new higher trailing stop moves higher.
# As per Nick's recommendation the stops are not actual stop loss orders entered into the market but a check that happens after Friday close and then if the exit is confirmed the exit order is placed on Monday at the Open

declare hide_on_intraday;
input roc = 10;
input market = {default SPX, NDX, RUT, DJX};

## Regime Filter
#Is the market this stock is apart of above the 10 Week MA
input Market_50Day_MA = 10; #50/5
def length = Market_50Day_MA;
def RF = SimpleMovingAvg(close(symbol = market), length);
plot closeMA = close(symbol = market) < RF;
def marClose = close(market);
AddLabel(1, Concat("Index: ", Concat(market, Concat(" " + marClose, " 200SMA= " + RF))), if marClose > RF
  then Color.GREEN
  else Color.RED);

## Confirmation rate of change
def rate = RateOfChange(roc);

## Stock making new 20 week high
input LenWkHigh = 20; # length of weekly highs to conisder, default 20
def Twentyweekhigh = close == Highest(close, LenWkHigh);

## Stop loss
input IniTrailStopFactor = 0.4; # stop is 40% below high if market regime is in uptrend
input MktDownTrailStopFactor = 0.1; # stop is 10% below high if market regime changes to downtrend
def loss = if marClose > RF
    then Highest(close,19) * (IniTrailStopFactor)
    else Highest(close,19) * (MktDownTrailStopFactor);
def exitsignal = close <= Highest(close,20)- loss;

########################################################################
## Trailing Stop
input trailType = {default modified, unmodified};
input firstTrade = {default long, short};

def state = {default init, long, short};
def trail;

switch (state[1]) {
  case init:
    if (!IsNaN(loss)) {
      switch (firstTrade) {
       case long:
         state = state.long;
         trail =  close - loss;
       case short:
         state = state.short;
         trail = close + loss;
     }
   } else {
    state = state.init;
     trail = Double.NaN;
    }

case long:
   if (close > trail[1]) {
     state = state.long;
     trail = Max(trail[1], close - loss);
   } else {
    state = state.short;
    trail = close + loss;
   }
case short:
   if (close < trail[1]) {
     state = state.short;
     trail = Min(trail[1], close + loss);
   } else {
     state = state.long;
     trail =  close - loss;
   }
}

plot TrailingStop = trail;
TrailingStop.SetPaintingStrategy(PaintingStrategy.POINTS);
TrailingStop.DefineColor("Buy", GetColor(0));
TrailingStop.DefineColor("Sell", GetColor(1));
TrailingStop.AssignValueColor(if state == state.long
then TrailingStop.color("Sell")
else TrailingStop.color("Buy"));
plot cross = close crosses below trailingstop;
cross.setPaintingStrategy(paintingStrategy.BOOLEAN_ARROW_DOWN);
#end


###Plots###

plot buySignal = Twentyweekhigh and rate > roc and marClose > RF;
buySignal.SetPaintingStrategy(PaintingStrategy.BOOLEAN_ARROW_UP);
buySignal.SetLineWeight(2);
buySignal.SetDefaultColor(Color.GREEN);

plot sellSignal = exitsignal;
    sellSignal.SetpaintingStrategy(PaintingStrategy.BOOLEAN_ARROW_Down);
    sellSignal.SetLineWeight(2);
    sellSignal.SetDefaultColor(Color.Red);

AddOrder(condition = buySignal, type = OrderType.BUY_TO_OPEN, price = open[-1], name = "BuyOrder");
AddOrder(condition = sellSignal, type = OrderType.SELL_TO_CLOSE, price = open[-1], name = "SellOrder");
AddOrder(condition = cross, type = OrderType.SELL_TO_CLOSE, price = open[-1], name = "TrailStop");
 
Quality post @gamgoum thanks for taking the time to put this together.

My theory behind the ROC % discrepancy is the difference between the Auzzie market and US market vol. Glad to hear someone else was able to confirm the lack of trades with the ROC at 30%
 
Last edited:
Quality post @gamgoum thanks for taking the time to put this together.

My theory behind the ROC % discrepancy is the difference between the Auzzie market and US market vol. Glad to hear someone else was able to confirm the lack of trades with the ROC at 30%
Yes it might be ( i have no idea on growth stocks performance in Australian Markets, might be worth checking if it is). It could be also due to the current hard hit on growth in the us in the past few weeks and the general choppiness this year with the trade war and all :)
 
Yes it might be ( i have no idea on growth stocks performance in Australian Markets, might be worth checking if it is). It could be also due to the current hard hit on growth in the us in the past few weeks and the general choppiness this year with the trade war and all :)

Possibly but I was backtesting these strategies 20 - 30 years back and only getting 15 - 20 trades. That's just not enough occurrence to measure the viability of the system.
 
Possibly but I was backtesting these strategies 20 - 30 years back and only getting 15 - 20 trades. That's just not enough occurrence to measure the viability of the system.

Tested with a 20 week trailing ATR 3 stop.

Did not make money with the stops out-lined in the original post using trailing stops of 40% and 10% .

This was tested on the S&P 100 from 1992 using 5% of equity per trade. The totals below do not include dividends received of $131,223.00 for the test period.

All TradesLong TradesShort TradesBenchmark Buy & Hold (SPX)
Starting Capital
$25,000.00​
$25,000.00​
$25,000.00​
$25,000.00​
Ending Capital
$1,789,306.17​
$1,789,306.17​
$25,000.00​
$194,838.11​
Net Profit
$1,764,306.17​
$1,764,306.17​
$0.00​
$169,838.11​
Net Profit %
7057.22%​
7057.22%​
0.00%​
679.35%​
Annualized Gain %
16.61%​
16.61%​
0.00%​
7.67%​
Exposure
88.50%​
88.50%​
0.00%​
99.57%​
Total Commission
($683.10)​
($683.10)​
$0.00​
($4.95)​
Return on Cash
$0.00​
$0.00​
$0.00​
$0.00​
Margin Interest Paid
$0.00​
$0.00​
$0.00​
$0.00​
Dividends Received
$0.00​
$0.00​
$0.00​
$0.00​
Number of Trades
78​
78​
0​
1​
Average Profit
$22,619.31​
$22,619.31​
$0.00​
$169,838.11​
Average Profit %
420.94%​
420.94%​
0.00%​
689.24%​
Average Bars Held
326.59​
326.59​
0​
1,449.00​
Winning Trades
55​
55​
0​
1​
Win Rate
70.51%​
70.51%​
0.00%​
100.00%​
Gross Profit
$1,904,415.10​
$1,904,415.10​
$0.00​
$169,838.11​
Average Profit
$34,625.73​
$34,625.73​
$0.00​
$169,838.11​
Average Profit %
606.40%​
606.40%​
0.00%​
689.24%​
Average Bars Held
412.58​
412.58​
0​
1,449.00​
Max Consecutive Winners
13​
13​
0​
1​
Losing Trades
23​
23​
0​
0​
Loss Rate
29.49%​
29.49%​
0.00%​
0.00%​
Gross Loss
($140,108.93)​
($140,108.93)​
$0.00​
$0.00​
Average Loss
($6,091.69)​
($6,091.69)​
$0.00​
$0.00​
Average Loss %
-22.57%​
-22.57%​
0.00%​
0.00%​
Average Bars Held
120.96​
120.96​
0​
0​
Max Consecutive Losses
3​
3​
0​
0​
Maximum Drawdown
($489,973.50)​
($489,973.50)​
$0.00​
($57,097.29)​
Maximum Drawdown Date
12/21/2018​
12/21/2018​
12/6/1991​
3/6/2009​
Maximum Drawdown %
-38.54%​
-38.54%​
0.00%​
-56.05%​
Maximum Drawdown % Date
3/6/2009​
3/6/2009​
9/23/2019​
3/6/2009​
Sharpe Ratio
0.99​
0.99​
0​
0.58​
Profit Factor
13.59​
13.59​
0​
Recovery Factor
3.6​
3.6​
0​
2.97​
Payoff Ratio
26.87​
26.87​
0​
0​
Profit / Total Bars
$1,210.09​
$1,210.09​
$0.00​
$116.49​

Period StartingReturnReturn %Max DD %Exposure %EntriesExits
12/13/1991​
$0.00​
0​
0​
0​
0​
0​
1/3/1992​
$3,434.64​
13.74​
-4.78​
53.92​
21​
3​
1/8/1993​
$7,465.68​
26.26​
-5.69​
95.03​
1​
1​
1/7/1994​
$3,798.14​
10.58​
-8.65​
92.33​
2​
1​
1/6/1995​
$16,123.39​
40.61​
-4.14​
94.42​
2​
1​
1/5/1996​
$17,838.34​
31.96​
-5.77​
95.87​
1​
1​
1/3/1997​
$15,967.41​
21.68​
-11.78​
97.17​
1​
2​
1/2/1998​
$42,293.09​
47.19​
-18.12​
92.93​
3​
1​
1/8/1999​
$28,068.27​
21.28​
-8.96​
94.85​
1​
1​
1/7/2000​
$26,498.23​
16.56​
-9.49​
91.3​
3​
4​
1/5/2001​
($31,168.98)​
-16.71​
-28.61​
93.52​
4​
3​
1/4/2002​
($23,878.59)​
-15.37​
-22.17​
96.57​
1​
1​
1/3/2003​
$50,083.36​
38.1​
-6.58​
96.89​
0​
2​
1/2/2004​
$46,306.44​
25.51​
-6.11​
96.76​
2​
2​
1/7/2005​
$52,127.41​
22.88​
-5.36​
92.56​
3​
2​
1/6/2006​
$34,142.25​
12.2​
-7.25​
98.34​
1​
1​
1/5/2007​
$56,859.43​
18.1​
-5.4​
97.42​
0​
1​
1/4/2008​
($136,865.25)​
-36.9​
-39.68​
83.1​
2​
9​
1/2/2009​
$89,174.85​
38.09​
-12.24​
87.36​
8​
1​
1/8/2010​
$52,330.98​
16.19​
-13.99​
88.07​
6​
4​
1/7/2011​
$31,330.06​
8.34​
-16.38​
98.04​
0​
0​
1/6/2012​
$73,947.13​
18.17​
-10.39​
95.06​
0​
1​
1/4/2013​
$273,622.41​
56.9​
-4.76​
98.11​
2​
1​
1/3/2014​
$172,067.38​
22.81​
-9.28​
95.62​
2​
5​
1/2/2015​
($5,513.04)​
-0.59​
-14.01​
84.28​
4​
8​
1/8/2016​
$28,835.52​
3.13​
-7.03​
88.88​
6​
0​
1/6/2017​
$182,763.00​
19.24​
-2.71​
96.25​
5​
4​
1/5/2018​
($38,928.78)​
-3.44​
-15.46​
81.58​
9​
12​
1/4/2019​
$233,060.22​
21.31​
-5.34​
93.09​
3​
0​
 
Last edited:
@mc01439 Hi, help an old guy out. I don't backtest nor know how to do it. Did you mis-speak when you said it did not make money?
To me, it looks like it did when compared to SP100 over same time. Could you explain a little please? Thanks, as always.
 
@mc01439 Hi, help an old guy out. I don't backtest nor know how to do it. Did you mis-speak when you said it did not make money?
To me, it looks like it did when compared to SP100 over same time. Could you explain a little please? Thanks, as always.

@markos - My test show it did not make money on the S&P 100 when using the following as outlined by @gamgoum.

The trailing stops of 40% and 10% are an issue from what I can see. With those stops the market takes any profits away when the S&P corrects from everything I have tested. But some may make money with it.

You are a brave man, I do not have the courage to trade without detailed testing.

FROM ORIGINAL POST
Criteria for trade exit:
  1. If the market index is still positive (close of SPX for example > 10 Week average) then the recommeded trailing stop is 40% below the highest weekly close.
  2. If the market index turns negative (close of SPX for example < 10 week average) then the recommended trailing stop is moved to 10% below the highest weekly close.
  3. The trailing stop is never moved down, always moved up
  4. If market recovers after a negative turns we will not change the trailing stop unless the new trailing stop is higher than the older one.
  5. sell orders are not entered on the trading platform untill the review of the weekly signals after the Friday close and then any sell orders neede are placed on Monday.
 
@mc01439 Thanks for filling in the detail. Got it.
I'll have to post my Long-Term chart a little later. I trust my system which is why I don't need to back test. That probably doesn't make sense. :)
Even though it is a system, every position is handled differently depending on where and how I bought it. (I'm a little spastic at times...)
The number 1 lesson for me is never loose more than 10% on a stock trade. If I am down that much, I sell and move on.
Without that Hard Rule, I have lost piles of cash. With that rule, I have done pretty well. If I still had clients, they would scream about taxes & churn! All of my trading / investing is in an IRA.

Rule number 2 is no more than 10% of equity in any stock, but never all at once. This forces me to keep much invested in ETF's. If conviction is high, I jump into that 10% position with 4-5% equity and average up. Otherwise, I'll use Option Spreads & Back Ratio's.

Not so brave, I think you are brave! It's all in perception. I have never been trained to trade /CL, thus sub-consciously, I feel it's risky.

@markos - one more thought

@gamgoum did a great job with the code. I did not use TOS for the testing - used another software. I just uploaded @gamgoum's code to TOS and went through each of the S&P 100 stocks. It looks like some could make money using his code. I just could not replicate using my software.
I think in all these strategies, you would hardly take them as is out of the book due to different markets, different times. different market cycles etc. I tested with 25% stop during positive market regime instead of 40% and using ROC of 10% instead of 30% which seems to give proper balance of trades and risk management.

I did test on some stocks, not a proper backtest on all possible stocks giving the signal, which I think is probably beyond ToS and beyond my current skill level but I see a lot of traders running extensive backtest tests on Amibroker (including the author of the strategy).
 
I ran the strat through my backtest as well. My parameters were as such
20 Random SP100 stocks
35 Years of data
Roc 20 for the first test (I had completed a test at ROC10 but the file corrupted so I will need to redo it later tonight)


Full Stats of the backtest for ROC20
pT5Lwj2.png


P/L Distribution Graph
DkFshFZ.png


Equity Return
eUPOGNa.png
 

Attachments

  • pT5Lwj2.png
    pT5Lwj2.png
    63.2 KB · Views: 134
  • eUPOGNa.png
    eUPOGNa.png
    21.5 KB · Views: 140
  • DkFshFZ.png
    DkFshFZ.png
    17.4 KB · Views: 121
Ok finished the analysis of the ROC 10 parameters which is much better looking than the ROC20 Parameters

In the two tests, one item to note was the strategies kept you invested in some massive moves. Two $10,000 plus moves in TSLA and One enormous move in MELI. This is what the strategy is designed for. The very positive fat tail equity distributions.

Another note and one that turns a lot of people off to trend following are the extended periods of drawdown you can experience. Both strategies were in drawdown between 2001 and 2007. Although, this is most likely due to the small sample size exaggerating the drawdown we are only looking at 20 equities for the test.

This strategy may not be for everyone but it is safe to say that if you had a scanner setup and you traded this strategy in your retirement account you would be doing yourself a big favor.

Full Stats for the ROC10 Backtest
DWDPRgW.png


P/L Distribution Graph
WDw12KO.png


Equity Curve
SKIIGNd.png


And the notable stats comparing the differences in the two strategies

pZbL1Tn.png
 

Attachments

  • pZbL1Tn.png
    pZbL1Tn.png
    12.3 KB · Views: 131
  • SKIIGNd.png
    SKIIGNd.png
    16.4 KB · Views: 136
  • WDw12KO.png
    WDw12KO.png
    19.8 KB · Views: 124
  • DWDPRgW.png
    DWDPRgW.png
    62.8 KB · Views: 136
@Zachc Curious, why doesn't the Oct 1987 crash show up in the chart?
What do you attribute the Flat Line of the first 10 years to?
Thank you for the work as this is not something I and many others have the time or ability to do. Much appreciated!
 
@markos
Its no problem I built the tool for myself to make my backtesting chores quicker and easier so only makes sense to share it with everyone.
I also gain a huge amount of feedback to make the tool more reliable as I am certainly no professional at this. Sharing helps me hone my skills.

Regarding the flat periods early in the study, we have an issue with selection bias. A lot of the symbols in this study just did not exist that far back or they did not produce signals thought that time period. To illustrate that we can look at the number of trades/year over the life of the backtest.

Below is the chart of the Anual P/L with Notable events. The frequency of trades grows in the later years just due to selection bias. If we were testing in a professional backtesting platform this would look much different across a selection of 100 stocks as opposed to 20.

Weekend Trend Trader Rate of Change = 10

EventsYear# of Trades Annual P/L
1985​
4​
$ (190.07)
1986​
4​
$ 2.66
Flash Crash
1987​
6​
$ 25.30
1988​
5​
$ 2.03
1989​
5​
$ 446.33
1990​
5​
$ 499.26
1991​
12​
$ 1,611.56
1992​
12​
$ 1,393.72
1993​
9​
$ 1,834.78
1994​
8​
$ 253.18
1995​
5​
$ 382.49
1996​
16​
$ 1,819.66
1997​
14​
$ 8,256.94
1998​
10​
$ 20,226.39
1999​
17​
$ 22,198.04
2000​
20​
$ 11,495.87
Tech Bubble
2001​
13​
$ 2,519.49
2002​
14​
$ (5,575.98)
2003​
14​
$ (8,684.42)
2004​
16​
$ (4,179.24)
2005​
19​
$ 1,004.77
2006​
11​
$ (7,328.64)
2007​
13​
$ 9,295.66
2008​
13​
$ 7,273.35
GFC
2009​
18​
$ 6,925.38
2010​
23​
$ 35,353.95
2011​
15​
$ 19,726.05
2012​
20​
$ 24,185.77
2013​
12​
$ 10,165.91
2014​
23​
$ 57,885.25
2015​
13​
$ 50,379.24
2016​
18​
$ 66,463.40
2017​
15​
$ 81,024.81
2018​
20​
$ 116,557.00
2019​
11​
$ 77,166.53
2020​
0​
$ -

Weekend Trend Trader Rate of Change = 20

EventsYear# of Trades Annual P/L
1985​
1​
$ (63.05)
1986​
3​
$ 215.49
1987​
4​
$ 171.64
Flash Crash
1988​
3​
$ (282.00)
1989​
5​
$ 359.20
1990​
2​
$ 171.37
1991​
11​
$ 1,288.09
1992​
9​
$ 693.72
1993​
9​
$ 245.33
1994​
5​
$ 260.95
1995​
3​
$ (16.89)
1996​
13​
$ 1,851.28
1997​
15​
$ 3,960.34
1998​
9​
$ 5,797.80
1999​
15​
$ 6,009.33
2000​
14​
$ 6,016.32
Tech Bubble
2001​
9​
$ (1,567.46)
2002​
9​
$ 355.29
2003​
11​
$ (4,168.19)
2004​
11​
$ 1,145.62
2005​
13​
$ 108.36
2006​
5​
$ 251.27
2007​
9​
$ (2,395.81)
2008​
6​
$ (5,669.76)
GFC
2009​
15​
$ (5,138.39)
2010​
20​
$ 1,875.40
2011​
13​
$ (1,138.93)
2012​
14​
$ (760.97)
2013​
12​
$ 2,961.23
2014​
14​
$ 24,786.39
2015​
5​
$ 24,682.87
2016​
12​
$ 7,723.04
2017​
13​
$ 55,738.74
2018​
13​
$ (1,150.71)
2019​
7​
$ 43,186.44
2020​
0​
$ -
 
Hello,
Is it possible to get a link to a chart with this already applied? I have copied the code and created the indicator but nothing shows up on my chart.
 
I can't seem to get the BB and breakout by Nick Radge that Zachc lists, to load on TOS? There is nothing added to my chart?

I did add it as a strategy, but nothing shows up.

And does anyone know about the BB system that is on the Metastock platform, is there a TOS version? And is it similar to the Nick Radge code that I can't get to load yet?
 
Last edited by a moderator:
I can't seem to get the BB and breakout by Nick Radge that Zachc lists, to load on TOS? There is nothing added to my chart?

I did add it as a strategy, but nothing shows up.

And does anyone know about the BB system that is on the Metastock platform, is there a TOS version? And is it similar to the Nick Radge code that I can't get to load yet?
@greenseed2133 did you set your chart to Weekly?
 

Join useThinkScript to post your question to a community of 21,000+ developers and traders.

Not the exact question you're looking for?

Start a new thread and receive assistance from our community.

87k+ Posts
473 Online
Create Post

The Market Trading Game Changer

Join 2,500+ subscribers inside the useThinkScript VIP Membership Club
  • Exclusive indicators
  • Proven strategies & setups
  • Private Discord community
  • ‘Buy The Dip’ signal alerts
  • Exclusive members-only content
  • Add-ons and resources
  • 1 full year of unlimited support

Frequently Asked Questions

What is useThinkScript?

useThinkScript is the #1 community of stock market investors using indicators and other tools to power their trading strategies. Traders of all skill levels use our forums to learn about scripting and indicators, help each other, and discover new ways to gain an edge in the markets.

How do I get started?

We get it. Our forum can be intimidating, if not overwhelming. With thousands of topics, tens of thousands of posts, our community has created an incredibly deep knowledge base for stock traders. No one can ever exhaust every resource provided on our site.

If you are new, or just looking for guidance, here are some helpful links to get you started.

What are the benefits of VIP Membership?
VIP members get exclusive access to these proven and tested premium indicators: Buy the Dip, Advanced Market Moves 2.0, Take Profit, and Volatility Trading Range. In addition, VIP members get access to over 50 VIP-only custom indicators, add-ons, and strategies, private VIP-only forums, private Discord channel to discuss trades and strategies in real-time, customer support, trade alerts, and much more. Learn all about VIP membership here.
How can I access the premium indicators?
To access the premium indicators, which are plug and play ready, sign up for VIP membership here.
Back
Top