Watchlist Metric - Pivot Point

oskartinksw88

New member
I'm trying to automate a calculation, a pivot point, at 8:30 EST for the current day.

The calculation [(low of the day+ high of the day)/2].

For example, QQQ [(385.66 + 386.84)/2] = 386.25

This is my first attempt at coding. Please see below. I struggled with how to code the "input."

I also included a screenshot of the Watchlist gadget.

Any help would be greatly appreciated. Thanks.


MCP

input length = 1;

def hh = Highest(high, length);
def ll = Lowest(low, length);
def mid = (hh + ll) / 2;

plot mcr=mid;


Watchlist.png
 
Last edited:
I'm trying to automate a calculation, a pivot point, at 8:30 EST for the current day.
The calculation [(low of the day+ high of the day)/2].
For example, QQQ [(385.66 + 386.84)/2] = 386.25
This is my first attempt at coding. Please see below. I struggled with how to code the "input."
I also included a screenshot of the Watchlist gadget.
Any help would be greatly appreciated. Thanks.

MCP

input length = 1;

def hh = Highest(high, length);
def ll = Lowest(low, length);
def mid = (hh + ll) / 2;

plot mcr=mid;

sorry, i'm a little confused by your post.
i looked at QQQ on a chart and didn't see those price levels in the last 30 days.
calling a middle price value a pivot is an opinion and confusing.
not sure what you mean by , day high at 8:30?
don't know what you want to use input for?
not sure what we are supposed to look at in that image? the right column of horizontal bars?

you can use input in a column study to set a value. there just isn't anywhere for the user to change a value, like on a chart. the code has to be changed.

just tell us where you want to see something, ( a column study ?)
and what you want to see. ??
 

Join useThinkScript to post your question to a community of 21,000+ developers and traders.

sorry, i'm a little confused by your post.
i looked at QQQ on a chart and didn't see those price levels in the last 30 days.
calling a middle price value a pivot is an opinion and confusing.
not sure what you mean by , day high at 8:30?
don't know what you want to use input for?
not sure what we are supposed to look at in that image? the right column of horizontal bars?

you can use input in a column study to set a value. there just isn't anywhere for the user to change a value, like on a chart. the code has to be changed.

just tell us where you want to see something, ( a column study ?)
and what you want to see. ??
My apology for the confusion.

I want to see the calculation on both my chart and column study.

Currently, I pull my numbers from the website "barchart."

For example, NVDA, from the "Price Overview" tab I would pull the "Day Low" and the "Day High" between 8:30 and 9:00 a.m. Add those two figures together and divide by two and come up with a price. I would plot that price on my TOS chart.

I'm trying to automate this in TOS.

I was able to calculate the figure. However the figure changes throughout the day. I want to lock the figure for the entire day. It would only change at 6:00 p.m. the start of the Asian session and run through the NY session. Then start all over again.

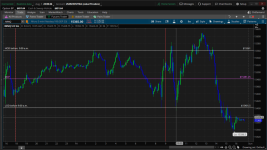
Please see attachment (I used /MNQ ).

The red vertical lines (left = p.m. EST; right vertical line = 9:00 a.m. EST).
I want to trap price between 6 p.m. (previous day) and 9:00 a.m. EST. What is/was the HOD and LOD. I want to lock in this price so it doesn't change throughout the day as the price moves.

Looking at the chart price reached it's "overall" HOD at 12:45 p.m. EST
And reached it's overall LOD at 3:50 p.m. EST. Not interested in those figures.

I drew horizonal lines on the chart for the high (15561, 1:50 a.m. candle) and low (15401.5, 8:35 candle) achieved prior to 9:00 a.m. EST. Add those 2 figures and divide by 2 you get 15481.25.

I would love to show the figure in the "column", plot it on the chart and display it as a label.

I hope this clears it up.

A big thank you for your help.
 

Attachments

  • Mid Price.png
    Mid Price.png
    403.6 KB · Views: 85

Similar threads

Not the exact question you're looking for?

Start a new thread and receive assistance from our community.

87k+ Posts
447 Online
Create Post

Similar threads

Similar threads

The Market Trading Game Changer

Join 2,500+ subscribers inside the useThinkScript VIP Membership Club
  • Exclusive indicators
  • Proven strategies & setups
  • Private Discord community
  • ‘Buy The Dip’ signal alerts
  • Exclusive members-only content
  • Add-ons and resources
  • 1 full year of unlimited support

Frequently Asked Questions

What is useThinkScript?

useThinkScript is the #1 community of stock market investors using indicators and other tools to power their trading strategies. Traders of all skill levels use our forums to learn about scripting and indicators, help each other, and discover new ways to gain an edge in the markets.

How do I get started?

We get it. Our forum can be intimidating, if not overwhelming. With thousands of topics, tens of thousands of posts, our community has created an incredibly deep knowledge base for stock traders. No one can ever exhaust every resource provided on our site.

If you are new, or just looking for guidance, here are some helpful links to get you started.

What are the benefits of VIP Membership?
VIP members get exclusive access to these proven and tested premium indicators: Buy the Dip, Advanced Market Moves 2.0, Take Profit, and Volatility Trading Range. In addition, VIP members get access to over 50 VIP-only custom indicators, add-ons, and strategies, private VIP-only forums, private Discord channel to discuss trades and strategies in real-time, customer support, trade alerts, and much more. Learn all about VIP membership here.
How can I access the premium indicators?
To access the premium indicators, which are plug and play ready, sign up for VIP membership here.
Back
Top