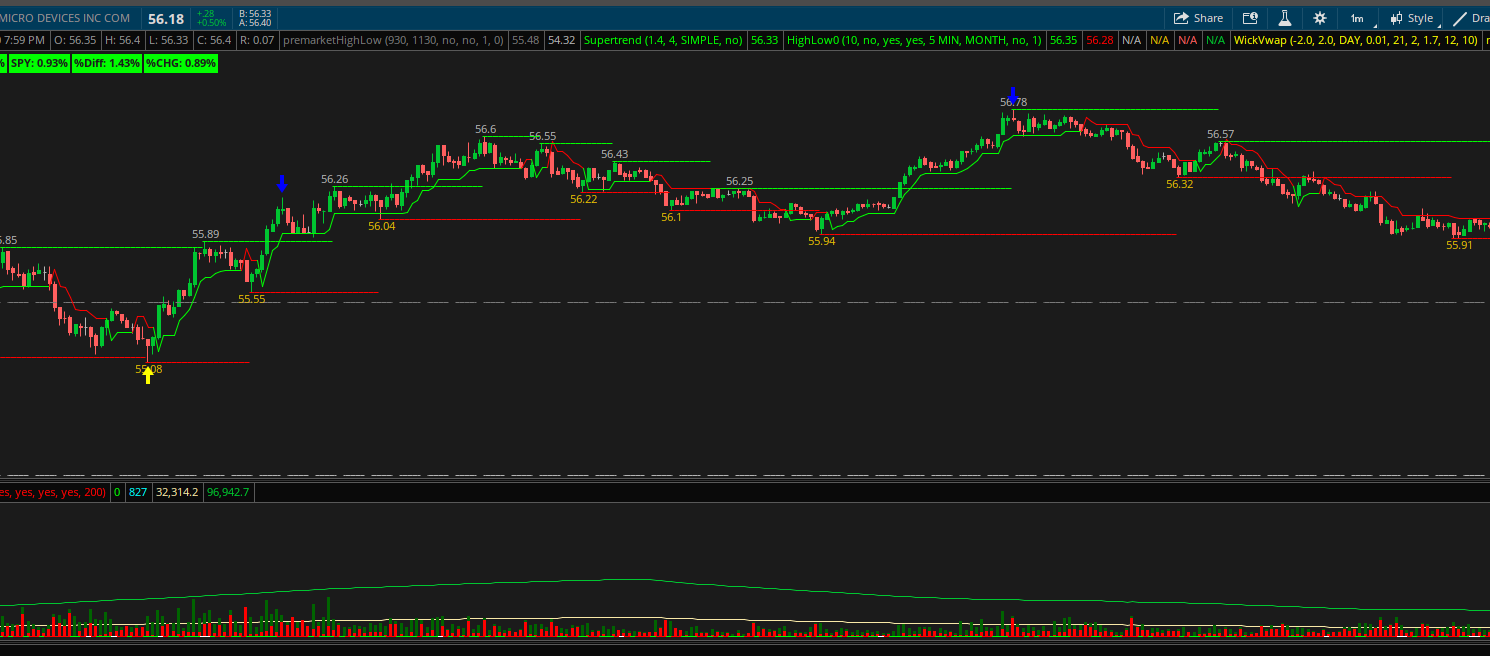
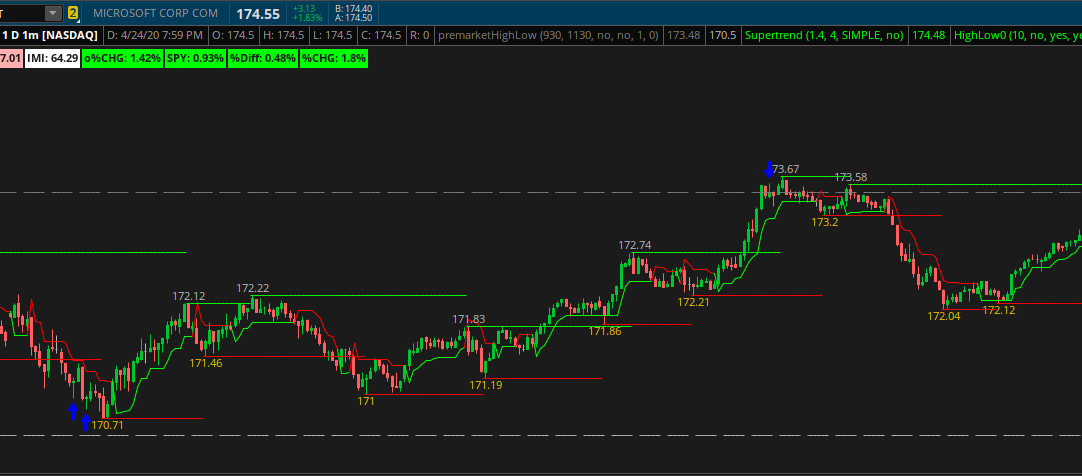
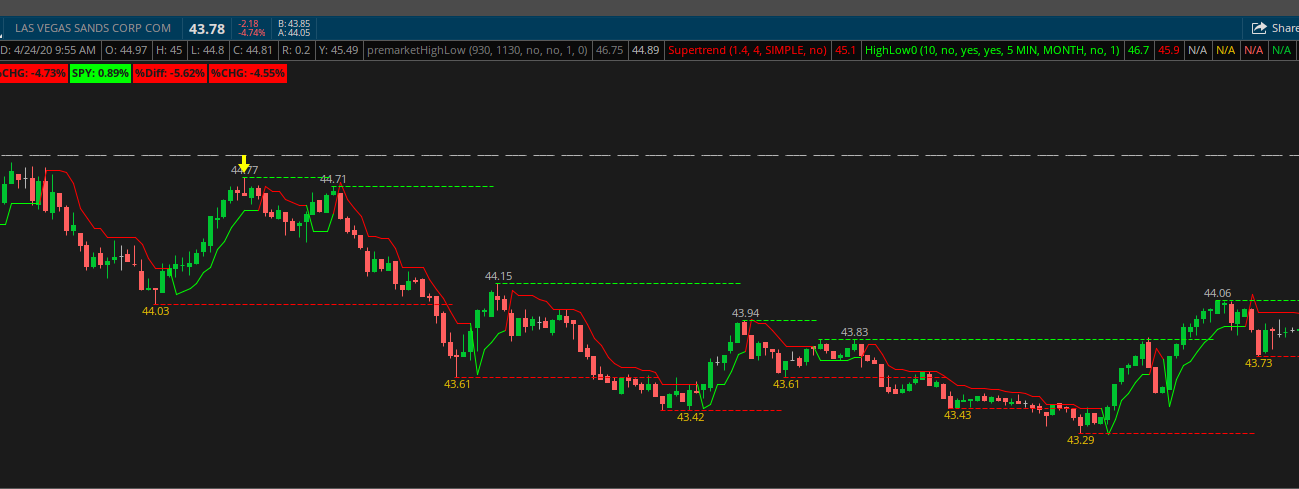
VWAP Scalp/Reversal Indicator for ThinkorSwim

I modified the v2 code to allow for changing of the aggregation period. The v1 should still allow for alerts on any time frame and based off that current time frame. Only the V2 will give you alerts for patterns on a higher time frame... for example... if you are looking at a 1min chart, it will give alerts based off a 3min chart.

I will also look into the tweezer pattern to see if i can figure out how to code it.
OK...sounds good...So for higher aggregations other than 1 min use the V2...Got it...I am really curious to see how this will work on 15 min to 1 hour...Will keep everyone posted here. Thanks again for doing the modification to allow higher timeframes.
 
OK...sounds good...So for higher aggregations other than 1 min use the V2...Got it...I am really curious to see how this will work on 15 min to 1 hour...Will keep everyone posted here. Thanks again for doing the modification to allow higher timeframes.


well... if you want to use a high time frame V1 should be fine, you will only get 1 arrow and alert based of the viewed time frame.

but... if you use the V2 and are looking at a 15min chart and set the aggregation to a 1hr it will give you 4 arrows for a valid signal; meaning the 1hr chart showed a signal.

I put both v1 and v2 on my charts. I look at a 1min chart and get alerts based off 1min. I also get alerts based on a 3min aggregate because i set the agg to 3min on the v2. This allows me to only look at a 1min chart and get alerts based off both time frames. Hope that makes sense. I would just play around with it and give it a shot.
 
I've been trading this strategy for a about 2 months and just was curious on back testing the strategy to see results. It has worked pretty well since I've been using it. I normally get stopped on spike in volatility or news. I also use RSI for spotting divergence that helps confirm setups for high probability trades.

5 Min Chart /ES
Short Rules: If price is below the VWAP & Below 200 SMA, then when price touches VWAP enter short position with STOP 0.50 points above the ATR. Profit Target 1.5 points.
Long Rules: If Price is above VWAP & Above 200 SMA, then when touches VWAP enter long position with stop 0.50 points above ATR. Profit Target 1.5 Points.

Thanks,
 
I may not have time to backtest, but I have a suggestion for your strat.
You could also implement the slope of the 200 SMA into your trading strategy as to avoid false signals given off by a choppy market.
For example, including the clause of Slope of 200 SMA > 0 ie having a positive slope.

Here is the free code for the slope the SMA from https://tickertape.tdameritrade.com...average-thinkscript-stock-momentum-tool-15190:

Code:
 declare lower;
input length = 20;
input price = close;
input averageType = AverageType. SIMPLE;
def avg = MovingAverage(averageType, price, length);
def height = avg - avg[1];
plot “Angle, deg” = Atan(height/length) * 180 / Double.Pi;
“Angle, deg”.AssignValueColor (if “Angle, deg” >=0 then color.ORANGE else color.BLUE);

:)
 
Interesting, thanks for the help. I find that the first move to the VWAP after it has been trading away above/below the VWAP for a period of time. I trade the first touch into that level. If its chopping back and forth I don't trade the chop or retests. I will attach an example from yesterdays trading. Again the idea is a small scalp for 1-1.5 pts in ES and leave a runner on STOP BE after 1.5 target. Highest Probability setup's when VWAP and 200 SMA are very close together, + RSI Divergence for even better opportunity to support/resis. I like to see cleaner price movement into that VWAP Area, not giant vol spikes.

Attached area the Area's of the 2 trades I took on Friday. 1st area RSI Divergence, VWAP close to 200 SMA almost got stopped out ATR was 4.7 entered short at 24 even bar went to 28.5 (4.5 pts) stop was 0.50 over ATR 5.25 pts. Hit 1.5 pts Target and left runner closed at PERSONS Pivot S1 3016.5 + 7.5 pts on runner.

2nd Trade - Spike into VWAP Persons Pivot S1 Resistance - Short 3017 Hit 1st Target 1.5 pts left runner and took profit at 11.5 small swing high from prior 20 min of trading. +5.5 pts on runner.

I took off early on Friday so I did not trade the next 2 moves into the VWAP below the 200 I would have been stopped out on both with the big VOL spikes. Although when I see huge volatility spikes on 5 min bar I tend not to enter those trades.

I'm trying to refine the strategy as the big VOL moves is where I get stopped out news etc.

I think maybe an additional rule would be only enter trade if the difference between VWAP Value and 200 SMA is <= ATR + 0.50?? That may give the probability of the setup much better chance as additional Resistance of the 200 SMA could help

k4ykSgE.png
 
Hello All -

The below TOS indicator attempts to determine likelihood of an upcoming reversal, pullback, or scalp opportunity from a 1 min chart. Could be used for .20 cent moves or potential full reversal points for a hold and run.

The indicator finds opportunities by candle formation, VWAP, and Intraday Momentum.

Yellow arrows = bounce in a up/down trend towards the current trend. If above VWAP and sharp pull back towards VWAP, it will look to find a location where it might bounce and continue higher/lower. These usually happen closer to VWAP.

Blue arrows = bounce from a low or high point in a up/downtrend back towards VWAP.

These point can also be used as points of trade failure to change from long to short or vise-versa.

This main has shown promise on the 1min charts.

Includes alerts as well.

40licn.jpg


O3HIzG.jpg


O6Ghez.jpg

Code:
#RCONNER7 - 4/2020
#VWAP REVERSAL/BOUNCE - CANDLE FORMATION
#v1

# Length of the candle's wick
def UpperWick = high - Max(open, close);
def LowerWick = Min(open, close) - low;
def FullLength = AbsValue(high - low);

# Length of the candle's body
def CandleBody = AbsValue(open - close);
def AvgBodyFull = Round((CandleBody / FullLength) * 100, 1);

def smallbody = if AvgBodyFull < 10 then 1 else 0;

#VWAP
input numDevDn = -2.0;
input numDevUp = 2.0;
input timeFrame = {default DAY, WEEK, MONTH};

def cap = getAggregationPeriod();
def errorInAggregation =
    timeFrame == timeFrame.DAY and cap >= AggregationPeriod.WEEK or
    timeFrame == timeFrame.WEEK and cap >= AggregationPeriod.MONTH;
assert(!errorInAggregation, "timeFrame should be not less than current chart aggregation period");

def yyyyMmDd = getYyyyMmDd();
def periodIndx;
switch (timeFrame) {
case DAY:
    periodIndx = yyyyMmDd;
case WEEK:
    periodIndx = Floor((daysFromDate(first(yyyyMmDd)) + getDayOfWeek(first(yyyyMmDd))) / 7);
case MONTH:
    periodIndx = roundDown(yyyyMmDd / 100, 0);
}
def isPeriodRolled = compoundValue(1, periodIndx != periodIndx[1], yes);

def volumeSum;
def volumeVwapSum;
def volumeVwap2Sum;

if (isPeriodRolled) {
    volumeSum = volume;
    volumeVwapSum = volume * vwap;
    volumeVwap2Sum = volume * Sqr(vwap);
} else {
    volumeSum = compoundValue(1, volumeSum[1] + volume, volume);
    volumeVwapSum = compoundValue(1, volumeVwapSum[1] + volume * vwap, volume * vwap);
    volumeVwap2Sum = compoundValue(1, volumeVwap2Sum[1] + volume * Sqr(vwap), volume * Sqr(vwap));
}
def price = volumeVwapSum / volumeSum;
def deviation = Sqrt(Max(volumeVwap2Sum / volumeSum - Sqr(price), 0));

def VWAP = price;
def UpperBand = price + numDevUp * deviation;
def LowerBand = price + numDevDn * deviation;

##True Range
input RangeGreater = .01;
def Range = TrueRangeindicator();
def OK_Range = if Range > RangeGreater then 1 else 0;

#IMI
input length = 21;
input smooth_length = 1;

def CloseOpenDiff = if close > open then close - open else 0;
def OpenCloseDiff = if close < open then open - close else 0;
def avgCloseOpen = Average(CloseOpenDiff, length);
def avgOpenClose = Average(OpenCloseDiff, length);

def IMI = avgCloseOpen / (avgCloseOpen + avgOpenClose) * 100;
#IMI.SetDefaultColor(GetColor(8));
def avgIMI = Average(IMI, smooth_length);

def IMI_VWAPLower = if low < LowerBand and avgIMI < 30 then 1 else 0;
def IMI_VWAPHigher = if high > UpperBand and avgIMI > 70 then 1 else 0;

def IMI_Low = if avgIMI < 30 then 1 else 0;
def IMI_High = if avgIMI > 70 then 1 else 0;

# Compare body to wicks
input CandleWickVar = 1.75;
def Hammer = (lowerWick / CandleBody >= CandleWickVar) and if smallbody then lowerwick > upperWick * candleWickVar else upperWick / CandleBody <= 1.33;
def STAR = (UpperWick / CandleBody >= CandleWickVar) and if smallbody then LowerWick * candleWickVar < UpperWick else (LowerWick / CandleBody <= 1.33);

#trend
input trendlookback = 10;
def uptrend = isAscending(open, trendlookback)[1];
def downtrend = isdescending(open, trendlookback)[1];

#lowest/Highest within
input HiLowLookback = 10;
def hh = high == Highest(high, HiLowLookback);
def ll = low == Lowest(low, HiLowLookback);

def bullVWAP = if open >= reference VWAP()."VWAP" and close >= reference VWAP()."VWAP" then 1 else 0;
def bearVWAP = if open <= reference VWAP()."VWAP" and close <= reference VWAP()."VWAP" then 1 else 0;

plot Hammer_Signal_IMI = Hammer and ll and bullVWAP and IMI_Low and OK_Range;
plot STAR_Signal_IMI = STAR and hh and bearVWAP and IMI_High and OK_Range;

#plot Hammer_Signal = Hammer and ll and bullVWAP and OK_Range and !Hammer_Signal_IMI and downtrend;
#plot STAR_Signal = STAR and hh and bearVWAP and OK_Range and !STAR_Signal_IMI and uptrend;

plot BullRev = Hammer and ll and IMI_VWAPLower and OK_Range;
plot BearRev = STAR and hh and IMI_VWAPHigher and OK_Range;

#Hammer_Signal.SetPaintingStrategy(PaintingStrategy.BOOLEAN_ARROW_UP);
#Hammer_Signal.AssignValueColor(Color.GREEN );
Hammer_Signal_IMI.SetPaintingStrategy(PaintingStrategy.BOOLEAN_ARROW_UP);
Hammer_Signal_IMI.AssignValueColor(Color.YELLOW);
BullRev.SetPaintingStrategy(PaintingStrategy.BOOLEAN_ARROW_UP);
BullRev.AssignValueColor(Color.BLUE );

#STAR_Signal.SetPaintingStrategy(PaintingStrategy.BOOLEAN_ARROW_DOWN);
#STAR_Signal.AssignValueColor(Color.GREEN );
STAR_Signal_IMI.SetPaintingStrategy(PaintingStrategy.BOOLEAN_ARROW_DOWN);
STAR_Signal_IMI.AssignValueColor(Color.YELLOW);
BearRev.SetPaintingStrategy(PaintingStrategy.BOOLEAN_ARROW_DOWN);
BearRev.AssignValueColor(Color.BLUE );

alert(Hammer_Signal_IMI or BullRev, "BUY BUY BUY", Alert.Bar, Sound.Bell);
alert(STAR_Signal_IMI or BearRev, "SELL SELL SELL", Alert.Bar, Sound.Ring);

aggregate min alerts on a lower min chart:

Code:
#RCONNER7 - 5/2020
#VWAP REVERSAL/BOUNCE - Priace Action Candles
#v2 - input forced aggregation - example -- set to 3min for alerts when viewing 1min chart
# agg total arrows should show. Proper entry to should done after low or high of those agg candles.

# Length of the candle's wick
input agg = aggregationPeriod.THREE_MIN;
def UpperWick = high(period = agg) - Max(open(period = agg), close(period = agg));
def LowerWick = Min(open(period = agg), close(period = agg)) - low(period = agg);
def FullLength = AbsValue(high(period = agg) - low(period = agg));

# Length of the candle's body
def CandleBody = AbsValue(open(period = agg) - close(period = agg));
def AvgBodyFull = Round((CandleBody / FullLength) * 100, 1);

def smallbody = if AvgBodyFull < 10 then 1 else 0;

#VWAP
def VWAP = reference VWAP()."VWAP";
def UpperBand = reference VWAP()."UpperBand";
def LowerBand = reference VWAP()."LowerBand";

##True Range
input RangeGreater = .02;
def Range = TrueRangeindicator();
def OK_Range = if Range > RangeGreater then 1 else 0;

#IMI
input length = 21;
#input smooth_length = 1;

def CloseOpenDiff = if close(period = agg) > open(period = agg) then close(period = agg) - open(period = agg) else 0;
def OpenCloseDiff = if close(period = agg) < open(period = agg) then open(period = agg) - close(period = agg) else 0;
def avgCloseOpen = Average(CloseOpenDiff, length);
def avgOpenClose = Average(OpenCloseDiff, length);

def IMI = avgCloseOpen / (avgCloseOpen + avgOpenClose) * 100;
#IMI.SetDefaultColor(GetColor(8));
#def avgIMI = Average(IMI, smooth_length);

def IMI_VWAPLower = if low(period = agg) < LowerBand and IMI < 30 then 1 else 0;
def IMI_VWAPHigher = if high(period = agg) > UpperBand and IMI > 70 then 1 else 0;

def IMI_Low = if IMI < 30 then 1 else 0;
def IMI_High = if IMI > 70 then 1 else 0;

# Compare body to wicks
input CandleWickVar = 1.76;
def Hammer = (lowerWick / CandleBody >= CandleWickVar) and if smallbody then lowerwick > upperWick * candleWickVar else upperWick / CandleBody <= 1.33;
def STAR = (UpperWick / CandleBody >= CandleWickVar) and if smallbody then LowerWick * candleWickVar < UpperWick else (LowerWick / CandleBody <= 1.33);

#trend
#input trendlookback = 10;
#def uptrend = isAscending(open, trendlookback)[1];
#def downtrend = isdescending(open, trendlookback)[1];

#lowest/Highest within
input HiLowLookback = 10;
def hh = high(period = agg) == Highest(high(period = agg), HiLowLookback);
def ll = low(period = agg) == Lowest(low(period = agg), HiLowLookback);

def bullVWAP = if open(period = agg) >= VWAP and close(period = agg) >= VWAP then 1 else 0;
def bearVWAP = if open(period = agg) <= VWAP and close(period = agg) <= VWAP then 1 else 0;

plot Hammer_Signal_IMI = Hammer and ll and bullVWAP and IMI_Low and OK_Range;
plot STAR_Signal_IMI = STAR and hh and bearVWAP and IMI_High and OK_Range;

#plot Hammer_Signal = Hammer and ll and bullVWAP and OK_Range and !Hammer_Signal_IMI and downtrend;
#plot STAR_Signal = STAR and hh and bearVWAP and OK_Range and !STAR_Signal_IMI and uptrend;

plot BullRev = Hammer and ll and IMI_VWAPLower and OK_Range;
plot BearRev = STAR and hh and IMI_VWAPHigher and OK_Range;

#Hammer_Signal.SetPaintingStrategy(PaintingStrategy.BOOLEAN_ARROW_UP);
#Hammer_Signal.AssignValueColor(Color.GREEN );
Hammer_Signal_IMI.SetPaintingStrategy(PaintingStrategy.BOOLEAN_ARROW_UP);
#Hammer_Signal_IMI.AssignValueColor(Color.YELLOW);
BullRev.SetPaintingStrategy(PaintingStrategy.BOOLEAN_ARROW_UP);
#BullRev.AssignValueColor(Color.BLUE );

#STAR_Signal.SetPaintingStrategy(PaintingStrategy.BOOLEAN_ARROW_DOWN);
#STAR_Signal.AssignValueColor(Color.GREEN );
STAR_Signal_IMI.SetPaintingStrategy(PaintingStrategy.BOOLEAN_ARROW_DOWN);
#STAR_Signal_IMI.AssignValueColor(Color.YELLOW);
BearRev.SetPaintingStrategy(PaintingStrategy.BOOLEAN_ARROW_DOWN);
#BearRev.AssignValueColor(Color.BLUE );

alert(Hammer_Signal_IMI or BullRev, "3MIN BUY BUY BUY", Alert.Bar, Sound.Bell);
alert(STAR_Signal_IMI or BearRev, "3MIN SELL SELL SELL", Alert.Bar, Sound.Ring);
does it repaint ?
 
does it repaint ?
The VWAP and candle patterns are not indicators which repaint.
A review of the code found no repainting scripts were added.
As with most indicators the current candle will repaint until closed.

When reviewing threads found on the forum. Make note of the ones that have a "repaints" prefix.
Those are the repainters. And read more about repainters:
https://usethinkscript.com/threads/answers-to-commonly-asked-questions.6006/#post-57833

If you're encountering something that's giving you some repainting worries. We need you to give us more information. Could you elaborate on what you're seeing? The more details you can provide, the better we'll be able to assist you.

It should be noted, that members on this thread have commented that the indicator is "broken" because they don't get signals. It is not broken. However, the candle pattern / vwap confluence is not common.
Therefore, signals from this indicator are infrequent.
 
Last edited:
Hello All -

The below TOS indicator attempts to determine likelihood of an upcoming reversal, pullback, or scalp opportunity from a 1 min chart. Could be used for .20 cent moves or potential full reversal points for a hold and run.

The indicator finds opportunities by candle formation, VWAP, and Intraday Momentum.
Thanks for the Code. Wondering if you've tried to incorporate an additional 1 standard deviation and other candle patters such as a 3 engulfing or regular engulfing candle bar? thanks for your insights.
 

Join useThinkScript to post your question to a community of 21,000+ developers and traders.

Similar threads

Not the exact question you're looking for?

Start a new thread and receive assistance from our community.

87k+ Posts
227 Online
Create Post

Similar threads

Similar threads

The Market Trading Game Changer

Join 2,500+ subscribers inside the useThinkScript VIP Membership Club
  • Exclusive indicators
  • Proven strategies & setups
  • Private Discord community
  • ‘Buy The Dip’ signal alerts
  • Exclusive members-only content
  • Add-ons and resources
  • 1 full year of unlimited support

Frequently Asked Questions

What is useThinkScript?

useThinkScript is the #1 community of stock market investors using indicators and other tools to power their trading strategies. Traders of all skill levels use our forums to learn about scripting and indicators, help each other, and discover new ways to gain an edge in the markets.

How do I get started?

We get it. Our forum can be intimidating, if not overwhelming. With thousands of topics, tens of thousands of posts, our community has created an incredibly deep knowledge base for stock traders. No one can ever exhaust every resource provided on our site.

If you are new, or just looking for guidance, here are some helpful links to get you started.

What are the benefits of VIP Membership?
VIP members get exclusive access to these proven and tested premium indicators: Buy the Dip, Advanced Market Moves 2.0, Take Profit, and Volatility Trading Range. In addition, VIP members get access to over 50 VIP-only custom indicators, add-ons, and strategies, private VIP-only forums, private Discord channel to discuss trades and strategies in real-time, customer support, trade alerts, and much more. Learn all about VIP membership here.
How can I access the premium indicators?
To access the premium indicators, which are plug and play ready, sign up for VIP membership here.
Back
Top