VWAP Crosses, Format, Watchlist, Label, Scan for ThinkorSwim

does TOS have a ticker showing % of stocks within SP500 or nasdaq 100 above vwap?

or is it possible to make such an indicator?

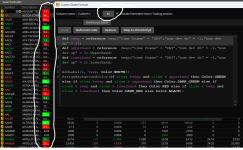
I am not aware of a ticker, but you could try scans for those. Here is an example of SP500 above VWAP

Snip.png
 
I am attempting to set up a watchlist column that would visually show if the stock has stacked VWAPs (Weekly VWAP greater or equal to Monthly VWAP). For some reason, all I am getting is a "loading". Any input would help!

Here is what I have so far:

plot VWAPW = VWAP(period = AggregationPeriod.WEEK);
plot VWAPM = VWAP(period = AggregationPeriod.MONTH);

def bullish = VWAPW is greater than or equal to VWAPM;
def bearish = VWAPW is less than VWAPM;

AddLabel(bullish, “Bullish VWAP⇧”, color.black);
AddLabel(bearish, “Bearish VWAP⇩”, color.black);
AddLabel(!bullish and !bearish, " ", color.black);

AssignBackgroundColor (if bullish then color.green else if bearish then color.red else color.black);
def VWAPW = reference VWAP("time frame" = "WEEK");
def VWAPM = reference VWAP("time frame" = "MONTH");

def bullish = VWAPW is greater than or equal to VWAPM;
def bearish = VWAPW is less than VWAPM;

AddLabel(bullish, “Bullish VWAP⇧”, color.black);
AddLabel(bearish, “Bearish VWAP⇩”, color.black);
AddLabel(!bullish and !bearish, " ", color.black);

AssignBackgroundColor (if bullish then color.green else if bearish then color.red else color.black);
 
How to create a scan query and watchlist for 9EMA crossing over VWAP? Please help.
Moved your question here. In this thread, you will find 18 pages of VWAP crosses: scans, watchlists, labels, with many formatting options.

Directions for searching through large threads:
https://usethinkscript.com/threads/answers-to-commonly-asked-questions.6006/#post-58238

How to search for answers to any additional questions:
https://usethinkscript.com/threads/search-the-forum.12626/
 
I trade this srategy now, (VWAP EMA crossover) and I wanted to get this link so I can instal in my studies in TOS.
Can someone tel her I can find it, pease?
Thank you
 
Thank you, I do have this on my chart and it works great, but I want to know if there was a way to be
notified/alert when the VWAP crossover the 9EMA
Hello Nads, I was looking for this also. Not sure how to do this from reading above posts. Were you able to make the complete code?
For VWAP I am using this & is Anchored to beginning of the trading day. Looking for Alert, when 9 EMA Crosses VWAP.

#yakBro intraday anchoredVWAP excluding extended hours volume 2019

declare hide_on_daily;

def anchorTime = 0930;
def anchorEnd = 1700;

input ShowTodayOnly = yes;
def Today = if GetDay() == GetLastDay() then 1 else 0;
def postAnchorTime = if SecondsFromTime(anchorTime) >= 0 then 1 else 0;
def endAchorTime = if SecondsTillTime(anchorEnd) >= 0 then 1 else 0;

#plot anchorVWAP for intraday
def volumeSum = compoundValue(1, if postAnchorTime and endAchorTime then volumeSum[1] + volume else 0, volume);
def volumeVwapSum = compoundValue(1, if postAnchorTime and endAchorTime then volumeVwapSum[1] + volume * vwap else 0, volume * vwap);

plot anchorVWAP = if ShowTodayOnly and !Today then Double.NaN else if anchorTime then volumeVwapSum / volumeSum else Double.NaN;
anchorVWAP.setStyle(Curve.Firm);
anchorVWAP.setDefaultColor(Color.light_ORANGE);
anchorVWAP.setlineWeight(2);

This uses the code you posted and portions of the snippets posted above to create the alert.

In the image is the alerts showing in the message center.
A sound alert also was made each of the times shown in the message center.

Screenshot-2023-01-19-152044.png
Ruby:
#yakBro intraday anchoredVWAP excluding extended hours volume 2019

declare hide_on_daily;

def anchorTime = 0930;
def anchorEnd = 1700;

input ShowTodayOnly = yes;
def Today = if GetDay() == GetLastDay() then 1 else 0;
def postAnchorTime = if SecondsFromTime(anchorTime) >= 0 then 1 else 0;
def endAchorTime = if SecondsTillTime(anchorEnd) >= 0 then 1 else 0;

#plot anchorVWAP for intraday
def volumeSum = compoundValue(1, if postAnchorTime and endAchorTime then volumeSum[1] + volume else 0, volume);
def volumeVwapSum = compoundValue(1, if postAnchorTime and endAchorTime then volumeVwapSum[1] + volume * vwap else 0, volume * vwap);

plot anchorVWAP = if ShowTodayOnly and !Today then Double.NaN else if anchorTime then volumeVwapSum / volumeSum else Double.NaN;
anchorVWAP.setStyle(Curve.Firm);
anchorVWAP.setDefaultColor(Color.light_ORANGE);
anchorVWAP.setlineWeight(2);

plot ema9 = expaverage(close, 9);
def cross = vwap crosses ema9;
alert(cross, if vwap crosses above ema9 then "OVER" else "UNDER", alert.bar, sound.Ding);
 
what did you change the 9 EMA in the code to be pls?
# EMA crossing above Upper VWAP Band Watchlist Column
input lengthMA = 9;

You can modify the highlighted line to fit your strategy.

There is no definitive perfect length.
Minor adjustments will only have minor effects.
The 9ema is highly sensitive, which may not suit everyone.
Longer lengths such as 18ema or 21ema may have reduced noise, but will lag behind more.
 
Last edited:
@BenTen @horserider any chance you can do me a quick indicator that posts signal arrows on the chart when the 5EMA crosses VWAP? Couldn't find anything like it. Thanks in advance!
Are you looking for a bullish crossover? If so, I think maybe what you're asking for is when VWAP crosses above the 5EMA. If so, this is what I came up with. If this is not what you meant, let me know.

Code:
def bullish = reference VWAP()."VWAP" crosses above MovAvgExponential("length" = 5)."AvgExp";

plot upArrow = bullish;

upArrow.SetPaintingStrategy(PaintingStrategy.BOOLEAN_ARROW_UP);
upArrow.SetDefaultColor(CreateColor(145, 210, 144));

In regards to this script I posted, is there any way to modify it so it will only display an arrow for the most recent crossover? Or possibly within a certain number of bars (for example, only display an arrow if it occurs within the last 5 bars)? I messed around with some basic things I thought might work, but couldn't figure it out.
 
Last edited by a moderator:
In regards to this script I posted, is there any way to modify it so it will only display an arrow for the most recent crossover? Or possibly within a certain number of bars (for example, only display an arrow if it occurs within the last 5 bars)? I messed around with some basic things I thought might work, but couldn't figure it out.
The following will limit the plot of arrows when yes to the number of x arrows:
input limit_arrow_plot = yes;
input show_x_arrows = 1;

The following set to 1 will plot the arrow on the cross. If set higher it will move the arrow to the right from the cross by that increase:
input show_within_bars = 1;

Screenshot-2023-02-27-075707.png
Code:
#Example_cond_limit_plot

input limit_arrow_plot = yes;
input show_x_arrows    = 1;
input show_within_bars = 1;

def bullish = reference VWAP()."VWAP" crosses above MovAvgExponential("length" = 5)."AvgExp" within show_within_bars bars;
def dataCount = CompoundValue(1, if IsNaN(dataCount[1]) then 0 else if bullish then dataCount[1] + 1 else dataCount[1], 0);

plot upArrow = if limit_arrow_plot and HighestAll(dataCount) - dataCount <= show_x_arrows - 1
               then bullish
               else if !limit_arrow_plot
               then bullish
               else Double.NaN;
upArrow.SetPaintingStrategy(PaintingStrategy.BOOLEAN_ARROW_UP);
upArrow.SetDefaultColor(CreateColor(145, 210, 144));
upArrow.SetLineWeight(4);
;
 
Last edited:
The following will limit the plot of arrows when yes to the number of x arrows:
input limit_arrow_plot = yes;
input show_x_arrows = 1;

The following set to 1 will plot the arrow on the cross. If set higher it will move the arrow to the right from the cross by that increase:
input show_within_bars = 1;
Thank you! Works perfectly. I was able to apply this to a few other studies and it cleaned things up nicely (y)
 
good day @sleepZ,
i used your script
https://usethinkscript.com/threads/...r-pocs-for-thinkorswim.8153/page-6#post-72446
to do the same thing for vwap but it looks like it doesn't work properly
here is the code i hope you can guide me to fix it
Code:
def vwap = reference vwap("time frame" = "DAY","num dev dn" = -1,"num dev up" = 1);
def upperband = reference  vwap("time frame" = "DAY","num dev dn" = -1,"num dev up" = 1).UpperBand;
def lowerband = reference  vwap("time frame" = "DAY","num dev dn" = -1,"num dev up" = 1).LowerBand;

AddLabel(1, vwap, Color.WHITE);
AssignBackgroundColor(if close >vwap and close < upperband then Color.GREEN else if close >vwap and close > upperband then Color.DARK_GREEN else if close < vwap and close > lowerband then Color.RED else if close < vwap and close < lowerband then Color.DARK_RED else Color.BLACK);
 
Last edited by a moderator:
good day @sleepZ,
i used your script
https://usethinkscript.com/threads/...r-pocs-for-thinkorswim.8153/page-6#post-72446
to do the same thing for vwap but it looks like it doesn't work properly
here is the code i hope you can guide me to fix it
Code:
def vwap = reference vwap("time frame" = "DAY","num dev dn" = -1,"num dev up" = 1);
def upperband = reference  vwap("time frame" = "DAY","num dev dn" = -1,"num dev up" = 1).UpperBand;
def lowerband = reference  vwap("time frame" = "DAY","num dev dn" = -1,"num dev up" = 1).LowerBand;

AddLabel(1, vwap, Color.WHITE);
AssignBackgroundColor(if close >vwap and close < upperband then Color.GREEN else if close >vwap and close > upperband then Color.DARK_GREEN else if close < vwap and close > lowerband then Color.RED else if close < vwap and close < lowerband then Color.DARK_RED else Color.BLACK);

What problem are you having? It is a watchlist and looks okay on my testing your code.
 
the calculations are correct im having problems with the coloring its always dark green or red and not the tow other options

It appears to be working. Here it is in a watchlist of scan results. The custom column is set to 1min timeframe with the DAY VWAP
 

Attachments

  • Screenshot 2023-05-24 072006.png
    Screenshot 2023-05-24 072006.png
    182.2 KB · Views: 155
Last edited:
@BenTen I copied the orignal link today and noticed the vwap values in the watchlist were not even close to accurate. It's such a simple script that I can't find any reason for it. I tried it with ext hours both on and off. Any suggestions?
 
@BenTen I copied the orignal link today and noticed the vwap values in the watchlist were not even close to accurate. It's such a simple script that I can't find any reason for it. I tried it with ext hours both on and off. Any suggestions?
You didn't provide enough information to say where you went astray.
Disparate data would indicate the settings of your chart are not the same as your watchlist.
A common culprit is the timeframe settings.

If you are still having difficulties, you would need to provide a shared chart link and a shared watchlist link, so the contributors can see what you are seeing and then offer solutions.
 

Join useThinkScript to post your question to a community of 21,000+ developers and traders.

Similar threads

Not the exact question you're looking for?

Start a new thread and receive assistance from our community.

87k+ Posts
256 Online
Create Post

Similar threads

Similar threads

The Market Trading Game Changer

Join 2,500+ subscribers inside the useThinkScript VIP Membership Club
  • Exclusive indicators
  • Proven strategies & setups
  • Private Discord community
  • ‘Buy The Dip’ signal alerts
  • Exclusive members-only content
  • Add-ons and resources
  • 1 full year of unlimited support

Frequently Asked Questions

What is useThinkScript?

useThinkScript is the #1 community of stock market investors using indicators and other tools to power their trading strategies. Traders of all skill levels use our forums to learn about scripting and indicators, help each other, and discover new ways to gain an edge in the markets.

How do I get started?

We get it. Our forum can be intimidating, if not overwhelming. With thousands of topics, tens of thousands of posts, our community has created an incredibly deep knowledge base for stock traders. No one can ever exhaust every resource provided on our site.

If you are new, or just looking for guidance, here are some helpful links to get you started.

What are the benefits of VIP Membership?
VIP members get exclusive access to these proven and tested premium indicators: Buy the Dip, Advanced Market Moves 2.0, Take Profit, and Volatility Trading Range. In addition, VIP members get access to over 50 VIP-only custom indicators, add-ons, and strategies, private VIP-only forums, private Discord channel to discuss trades and strategies in real-time, customer support, trade alerts, and much more. Learn all about VIP membership here.
How can I access the premium indicators?
To access the premium indicators, which are plug and play ready, sign up for VIP membership here.
Back
Top