red_man_1111
New member
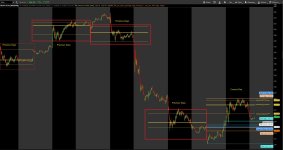
Hello guys, I'm trying to plot bubbles in the right extension (w same format of the other indicator) and also plot lines of the volume profile values to the right as expansion of the current day only (not previous days). See attached image for reference, I've tried some codes with no luck, this is the main code:
plot dataOne = reference VolumeProfile("price per row height mode" = "TICKSIZE", "time per profile" = "DAY", "on expansion" = no)."VAHigh";
dataOne.SetDefaultColor(GetColor(8));
dataOne.SetPaintingStrategy(PaintingStrategy.HORIZONTAL);
plot dataTwo = reference VolumeProfile("price per row height mode" = "TICKSIZE", "time per profile" = "DAY", "on expansion" = no)."POC";
dataTwo.SetDefaultColor(GetColor(5));
dataTwo.SetPaintingStrategy(PaintingStrategy.HORIZONTAL);
plot dataThree = reference VolumeProfile("price per row height mode" = "TICKSIZE", "time per profile" = "DAY", "on expansion" = no)."VALow";
dataThree.SetDefaultColor(GetColor(8));
dataThree.SetPaintingStrategy(PaintingStrategy.HORIZONTAL);
its possible to include the Daily POC, VAH, VAL plot lines w bubbles sorted on the right like the rest of the plot/bubbles?