

Volume Pressure Expert Advisor For ThinkOrSwim

dap711

Well-known member
VIP
What this strategy does
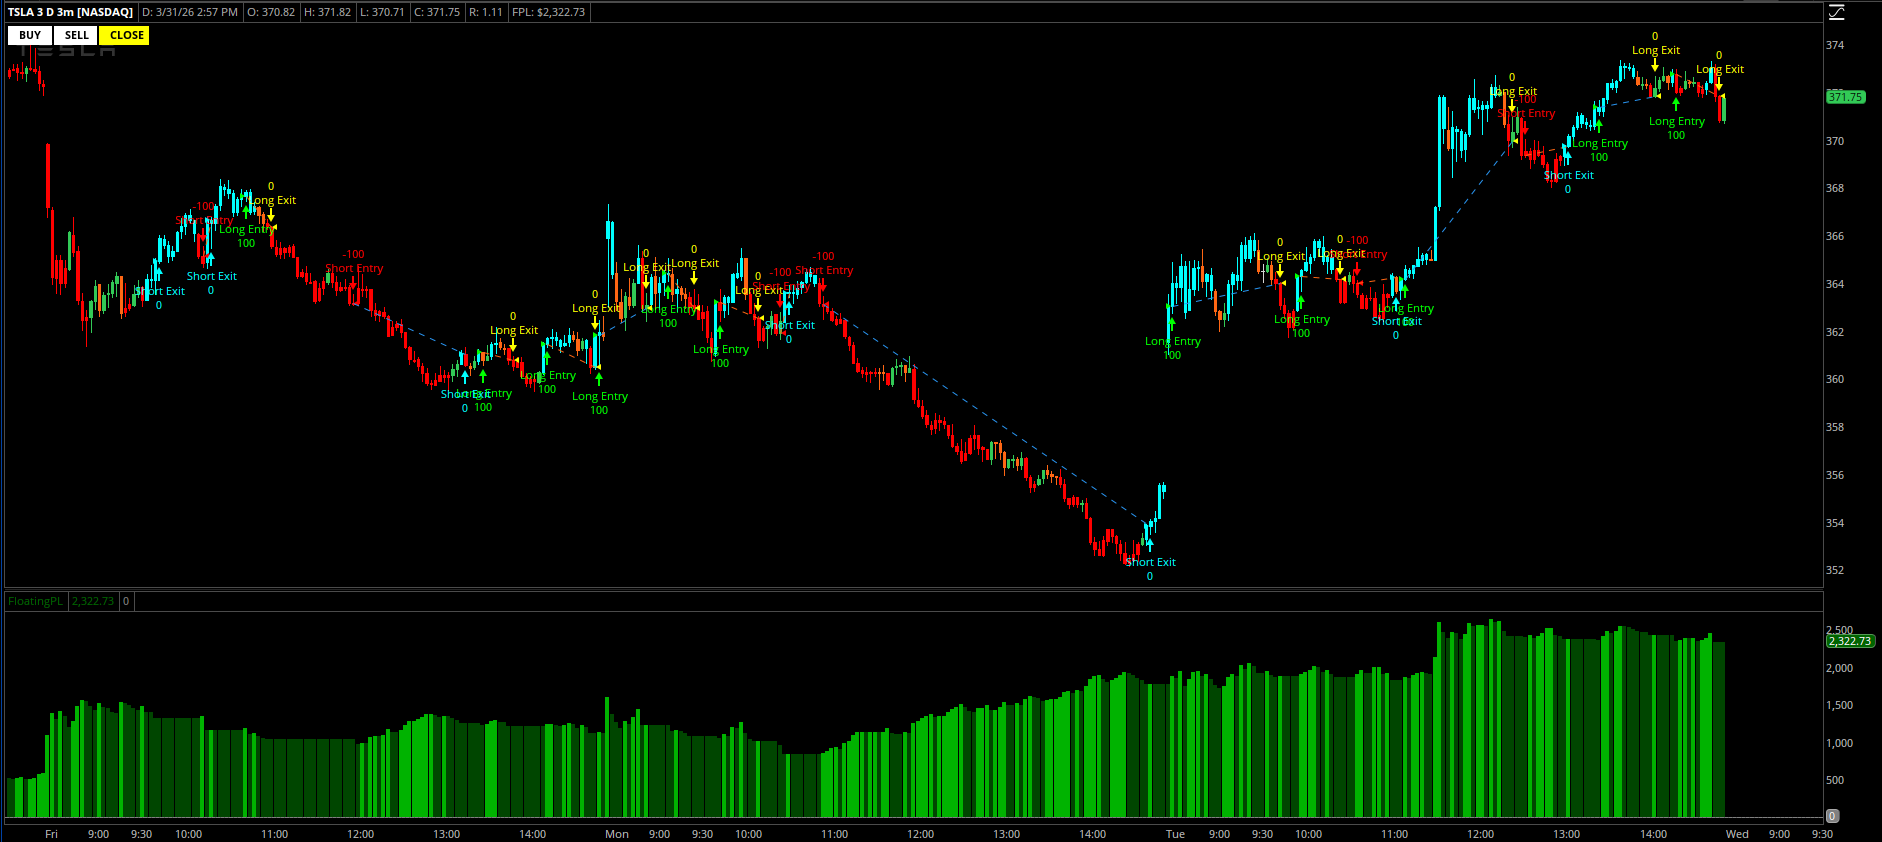
This strategy is a trend-and-volume-pressure confirmation system. It tries to enter trades only when your chart symbol, plus the broader market filters you chose, are aligned in the same direction.

At the chart-symbol level, it measures:
  • Buying pressure versus selling pressure
  • A moving average trend filter
A long setup happens when:
  • smoothed buying pressure is greater than smoothed selling pressure, and
  • price is above the moving average
A short setup happens when:
  • smoothed selling pressure is greater than smoothed buying pressure, and
  • price is below the moving average
In the strategy version, those conditions become simulated orders through AddOrder(). In thinkScript, AddOrder() places the simulated order on the next bar when the condition is true, and open[-1] is the standard next-bar fill price unless you override it.

xkc6JeR.png

How the market filters work
The script also calculates volume pressure for:
  • the Magnificent 7 as a group
  • QQQ
  • SPY
These are used as optional directional filters.
For a long trade:
  • your symbol must be bullish
  • and, if enabled, Mag 7 must be bullish
  • and, if enabled, QQQ must be bullish
  • and, if enabled, SPY must be bullish
For a short trade:
  • your symbol must be bearish
  • and the enabled filters must also be bearish
This makes the strategy more selective. It is trying to avoid taking a long when your symbol looks good but the broader market is weak, or taking a short when the market backdrop is strong.

How entries happen
The strategy does not enter every bar that stays bullish or bearish.
It only enters when the condition turns true on this bar after being false on the prior bar:
  • longEntry = longFilterOK and !longFilterOK[1]
  • shortEntry = shortFilterOK and !shortFilterOK[1]
That means it is looking for a fresh signal, not repeated signals every bar.

Inputs you can control

Main display input

  • PaintBars
    • colors price bars cyan when bullish
    • colors price bars red when bearish
    • otherwise gray
Filter toggles
  • Use_Mag7_Filter
  • Use_QQQ_Filter
  • Use_SPY_Filter
Turning filters on makes the strategy stricter.
Turning them off makes it trade based more on the chart symbol alone.

Volume-pressure settings
  • Volume_AvgType
  • Volume_Length
These control how fast or slow the buy/sell pressure averages respond.

Smaller length:
  • faster signals
  • more trades
  • more noise
Larger length:
  • slower signals
  • fewer trades
  • more smoothing

Moving-average settings
  • MovAvg_AvgType
  • MovAvg_Price
  • MovAvg_Length
These control the trend filter.

Smaller MA length:
  • faster trend changes
  • earlier entries
  • more whipsaws
Larger MA length:
  • slower trend changes
  • fewer but more filtered entries

Best way to use it
This strategy is best used as:
  • a directional alignment tool
  • a backtesting idea generator
  • a confirmation system for intraday or swing entries
It is especially useful when you want to know:
  • is my symbol strong or weak?
  • is that strength or weakness confirmed by the broader market?
  • did a fresh alignment just appear?

How to add it in Thinkorswim
Thinkorswim separates studies and strategies. Strategies are added from the Strategies tab in the “Edit Studies and Strategies” window, and custom strategies can be created in the thinkScript editor there.

Basic workflow:
  1. Open a chart.
  2. Go to Studies > Edit Studies and Strategies.
  3. Open the Strategies tab.
  4. Click Create.
  5. Paste the strategy code.
  6. Save it with a name.
  7. Add it to the chart.

How to backtest it
Once added as a strategy, Thinkorswim will show simulated entries and exits on the chart. Strategies in thinkorswim are technical analysis tools that add historical trade signals so you can backtest the conditions.

When testing it:
  • try multiple timeframes
  • test with all filters on, then selectively turn some off
  • compare shorter versus longer moving-average lengths
  • compare shorter versus longer volume lengths
  • check whether the strategy fits trending symbols better than choppy symbols

Important limitations
Right now it does not include:
  • stop loss
  • profit target
  • trailing stop
  • time-of-day filter
  • volume minimum
  • volatility filter
  • position sizing logic beyond the fixed strategy size
Also, because it uses next-bar simulated fills, actual live fills can differ from backtest fills. Thinkorswim’s strategy engine is for simulated order testing, not a guarantee of real execution.


Practical starting settings
A good starting point is:
  • Volume_Length = 8
  • MovAvg_Length = 16
  • all three filters on
Then test:
  • aggressive mode: shorter lengths, fewer filters
  • conservative mode: longer lengths, all filters on

Simple summary
In one sentence:
The strategy goes long when your symbol’s buying pressure and price trend turn bullish, goes short when they turn bearish, and can require Mag 7, QQQ, and SPY to agree before taking the trade.
 

Attachments
  • 1775016924297.png
    1775016924297.png
    79.7 KB · Views: 645
Last edited:
What this strategy does
This strategy is a trend-and-volume-pressure confirmation system. It tries to enter trades only when your chart symbol, plus the broader market filters you chose, are aligned in the same direction.

At the chart-symbol level, it measures:
  • Buying pressure versus selling pressure
  • A moving average trend filter
A long setup happens when:
  • smoothed buying pressure is greater than smoothed selling pressure, and
  • price is above the moving average
A short setup happens when:
  • smoothed selling pressure is greater than smoothed buying pressure, and
  • price is below the moving average
In the strategy version, those conditions become simulated orders through AddOrder(). In thinkScript, AddOrder() places the simulated order on the next bar when the condition is true, and open[-1] is the standard next-bar fill price unless you override it.

xkc6JeR.png

How the market filters work
The script also calculates volume pressure for:
  • the Magnificent 7 as a group
  • QQQ
  • SPY
These are used as optional directional filters.
For a long trade:
  • your symbol must be bullish
  • and, if enabled, Mag 7 must be bullish
  • and, if enabled, QQQ must be bullish
  • and, if enabled, SPY must be bullish
For a short trade:
  • your symbol must be bearish
  • and the enabled filters must also be bearish
This makes the strategy more selective. It is trying to avoid taking a long when your symbol looks good but the broader market is weak, or taking a short when the market backdrop is strong.

How entries happen
The strategy does not enter every bar that stays bullish or bearish.
It only enters when the condition turns true on this bar after being false on the prior bar:
  • longEntry = longFilterOK and !longFilterOK[1]
  • shortEntry = shortFilterOK and !shortFilterOK[1]
That means it is looking for a fresh signal, not repeated signals every bar.

Inputs you can control

Main display input

  • PaintBars
    • colors price bars cyan when bullish
    • colors price bars red when bearish
    • otherwise gray
Filter toggles
  • Use_Mag7_Filter
  • Use_QQQ_Filter
  • Use_SPY_Filter
Turning filters on makes the strategy stricter.
Turning them off makes it trade based more on the chart symbol alone.

Volume-pressure settings
  • Volume_AvgType
  • Volume_Length
These control how fast or slow the buy/sell pressure averages respond.

Smaller length:
  • faster signals
  • more trades
  • more noise
Larger length:
  • slower signals
  • fewer trades
  • more smoothing

Moving-average settings
  • MovAvg_AvgType
  • MovAvg_Price
  • MovAvg_Length
These control the trend filter.

Smaller MA length:
  • faster trend changes
  • earlier entries
  • more whipsaws
Larger MA length:
  • slower trend changes
  • fewer but more filtered entries

Best way to use it
This strategy is best used as:
  • a directional alignment tool
  • a backtesting idea generator
  • a confirmation system for intraday or swing entries
It is especially useful when you want to know:
  • is my symbol strong or weak?
  • is that strength or weakness confirmed by the broader market?
  • did a fresh alignment just appear?

How to add it in Thinkorswim
Thinkorswim separates studies and strategies. Strategies are added from the Strategies tab in the “Edit Studies and Strategies” window, and custom strategies can be created in the thinkScript editor there.

Basic workflow:
  1. Open a chart.
  2. Go to Studies > Edit Studies and Strategies.
  3. Open the Strategies tab.
  4. Click Create.
  5. Paste the strategy code.
  6. Save it with a name.
  7. Add it to the chart.

How to backtest it
Once added as a strategy, Thinkorswim will show simulated entries and exits on the chart. Strategies in thinkorswim are technical analysis tools that add historical trade signals so you can backtest the conditions.

When testing it:
  • try multiple timeframes
  • test with all filters on, then selectively turn some off
  • compare shorter versus longer moving-average lengths
  • compare shorter versus longer volume lengths
  • check whether the strategy fits trending symbols better than choppy symbols

Important limitations
Right now it does not include:
  • stop loss
  • profit target
  • trailing stop
  • time-of-day filter
  • volume minimum
  • volatility filter
  • position sizing logic beyond the fixed strategy size
Also, because it uses next-bar simulated fills, actual live fills can differ from backtest fills. Thinkorswim’s strategy engine is for simulated order testing, not a guarantee of real execution.


Practical starting settings
A good starting point is:
  • Volume_Length = 8
  • MovAvg_Length = 16
  • all three filters on
Then test:
  • aggressive mode: shorter lengths, fewer filters
  • conservative mode: longer lengths, all filters on

Simple summary
In one sentence:
The strategy goes long when your symbol’s buying pressure and price trend turn bullish, goes short when they turn bearish, and can require Mag 7, QQQ, and SPY to agree before taking the trade.
looks insanely profitable
 
1789720604672.png


Ruby:
# ──────────────────────────────────────────────────────────────────
# Inputs
# ──────────────────────────────────────────────────────────────────
input PaintBars         = yes;

input NumberOfShares    = 10;

# Strategy filters
input Use_Mag7_Filter   = yes;
input Use_QQQ_Filter    = yes;
input Use_SPY_Filter    = no;

# Volume Pressure Inputs
input Volume_AvgType    = AverageType.EXPONENTIAL;
input Volume_Length     = 8;

# Moving Average Inputs
input MovAvg_AvgType    = AverageType.EXPONENTIAL;
input MovAvg_Price      = close;
input MovAvg_Length     = 16;

# ───────────────────────────────────────────────────────────────────────
# Raw Data
# ───────────────────────────────────────────────────────────────────────
def vol = volume;
def range = high - low;
def selling = if range != 0 then vol * (high - close) / range else 0;
def buying = if range != 0 then vol * (close - low) / range else 0;
def buyV_ma  = MovingAverage(Volume_AvgType, buying, Volume_Length);
def sellV_ma = MovingAverage(Volume_AvgType, selling, Volume_Length);
def MA = MovingAverage(MovAvg_AvgType, MovAvg_Price, MovAvg_Length);

# Core symbol signals
def bullishSymbol = buyV_ma > sellV_ma and close > MA;
def bearishSymbol = buyV_ma < sellV_ma and close < MA;

def Dot_Cyan = if bullishSymbol then 1 else Double.NaN;
def Dot_Red = if bearishSymbol then 1 else Double.NaN;

AssignPriceColor(if PaintBars and !IsNaN(Dot_Cyan)
                 then Color.CYAN else
                    if PaintBars and !IsNaN(Dot_Red)
                    then Color.RED else
                       Color.CURRENT);

# ────────────────────────────────────────────────────────────────────────
# Volume Pressure Script
# ────────────────────────────────────────────────────────────────────────
script VolumePressure {
    input sym = "AAPL";
    input VolLen = 14;

    def o = open(sym);
    def h = high(sym);
    def l = low(sym);
    def c = close(sym);
    def v = volume(sym);

    def sp = h - l;
    def uw = if c > o then h - c else h - o;
    def lw = if c > o then o - l else c - l;
    def bd = sp - (uw + lw);
    def pctB = if sp != 0 then bd / sp else 0;
    def pctW = if sp != 0 then (uw + lw) / sp else 0;
    def buyR = if c > o then (pctB + pctW / 2) * v else (pctW / 2) * v;
    def sellR = if c < o then (pctB + pctW / 2) * v else (pctW / 2) * v;
    plot Buy  = MovingAverage(AverageType.EXPONENTIAL, buyR, VolLen);
    plot Sell = MovingAverage(AverageType.EXPONENTIAL, sellR, VolLen);
}

# ────────────────────────────────────────────────────────────────────────
# Mag 7 Aggregate
# ────────────────────────────────────────────────────────────────────────
def avgBuy =
    ( VolumePressure("AAPL", Volume_Length).Buy +
      VolumePressure("MSFT", Volume_Length).Buy +
      VolumePressure("GOOGL", Volume_Length).Buy +
      VolumePressure("AMZN", Volume_Length).Buy +
      VolumePressure("META", Volume_Length).Buy +
      VolumePressure("TSLA", Volume_Length).Buy +
      VolumePressure("NVDA", Volume_Length).Buy ) / 7;

def avgSell =
    ( VolumePressure("AAPL", Volume_Length).Sell +
      VolumePressure("MSFT", Volume_Length).Sell +
      VolumePressure("GOOGL", Volume_Length).Sell +
      VolumePressure("AMZN", Volume_Length).Sell +
      VolumePressure("META", Volume_Length).Sell +
      VolumePressure("TSLA", Volume_Length).Sell +
      VolumePressure("NVDA", Volume_Length).Sell ) / 7;
def mag7Bull = avgBuy > avgSell;
def mag7Bear = avgBuy < avgSell;

def Cyan_M7 = if mag7Bull then -1 else Double.NaN;
def Red_M7 = if mag7Bear then -1 else Double.NaN;

# ────────────────────────────────────────────────────────────────────────
# QQQ
# ────────────────────────────────────────────────────────────────────────
def qqqBuy  = VolumePressure("QQQ", Volume_Length).Buy;
def qqqSell = VolumePressure("QQQ", Volume_Length).Sell;
def qqqBull = qqqBuy > qqqSell;
def qqqBear = qqqBuy < qqqSell;
def Cyan_QQQ = if qqqBull then -2 else Double.NaN;
def Red_QQQ = if qqqBear then -2 else Double.NaN;

# ────────────────────────────────────────────────────────────────────────
# SPY
# ────────────────────────────────────────────────────────────────────────
def spyBuy  = VolumePressure("SPY", Volume_Length).Buy;
def spySell = VolumePressure("SPY", Volume_Length).Sell;
def spyBull = spyBuy > spySell;
def spyBear = spyBuy < spySell;
def Cyan_SPY = if spyBull then -3 else Double.NaN;
def Red_SPY = if spyBear then -3 else Double.NaN;


# ────────────────────────────────────────────────────────────────────────
# Strategy Logic
# ────────────────────────────────────────────────────────────────────────
def longFilterOK =
    bullishSymbol
    and (if Use_Mag7_Filter then mag7Bull else yes)
    and (if Use_QQQ_Filter then qqqBull else yes)
    and (if Use_SPY_Filter then spyBull else yes);

def shortFilterOK =
    bearishSymbol
    and (if Use_Mag7_Filter then mag7Bear else yes)
    and (if Use_QQQ_Filter then qqqBear else yes)
    and (if Use_SPY_Filter then spyBear else yes);

def longEntry = longFilterOK and !longFilterOK[1];
def shortEntry = shortFilterOK and !shortFilterOK[1];

# Macro Recorder Labels
addLabel(yes,"   BUY   ",if longEntry then Color.CYAN else Color.WHITE);
addLabel(yes,"   SELL  ",if shortEntry then Color.RED else Color.WHITE);
addLabel(yes,"   CLOSE ",if !longEntry AND !shortEntry then Color.YELLOW else Color.WHITE);

AddOrder(OrderType.BUY_TO_OPEN, longEntry, open[-1], NumberOfShares, Color.GREEN, Color.GREEN, "Long Entry");
AddOrder(OrderType.SELL_TO_CLOSE, shortEntry, open[-1], NumberOfShares, Color.YELLOW, Color.YELLOW, "Long Exit");

AddOrder(OrderType.SELL_TO_OPEN, shortEntry, open[-1], NumberOfShares, Color.RED, Color.RED, "Short Entry");
AddOrder(OrderType.BUY_TO_CLOSE, longEntry, open[-1], NumberOfShares, Color.CYAN, Color.CYAN, "Short Exit");
 

Join useThinkScript to post your question to a community of 21,000+ developers and traders.

Not the exact question you're looking for?

Start a new thread and receive assistance from our community.

87k+ Posts
1203 Online
Create Post

The Market Trading Game Changer

Join 2,500+ subscribers inside the useThinkScript VIP Membership Club
  • Exclusive indicators
  • Proven strategies & setups
  • Private Discord community
  • ‘Buy The Dip’ signal alerts
  • Exclusive members-only content
  • Add-ons and resources
  • 1 full year of unlimited support

Frequently Asked Questions

What is useThinkScript?

useThinkScript is the #1 community of stock market investors using indicators and other tools to power their trading strategies. Traders of all skill levels use our forums to learn about scripting and indicators, help each other, and discover new ways to gain an edge in the markets.

How do I get started?

We get it. Our forum can be intimidating, if not overwhelming. With thousands of topics, tens of thousands of posts, our community has created an incredibly deep knowledge base for stock traders. No one can ever exhaust every resource provided on our site.

If you are new, or just looking for guidance, here are some helpful links to get you started.

What are the benefits of VIP Membership?
VIP members get exclusive access to these proven and tested premium indicators: Buy the Dip, Advanced Market Moves 2.0, Take Profit, and Volatility Trading Range. In addition, VIP members get access to over 50 VIP-only custom indicators, add-ons, and strategies, private VIP-only forums, private Discord channel to discuss trades and strategies in real-time, customer support, trade alerts, and much more. Learn all about VIP membership here.
How can I access the premium indicators?
To access the premium indicators, which are plug and play ready, sign up for VIP membership here.
Back
Top
