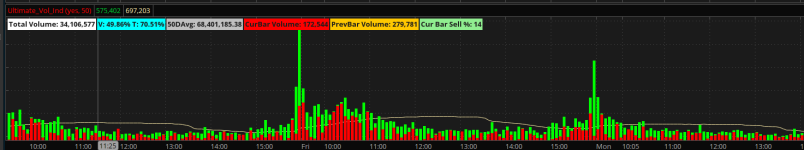
I ran across some thinkScript label that has helped me see comparative volumes at a glance.

On my charts I have them in the Lower Charts (where I use the Ultimate_Volume_Indicator). I don't know who wrote the script. It wasn't in the notes. My contribution was adding a calculation to give the percent calculation showing percent of this day's volume to the average daily volume AND the percent of time elapsed through the day in hours.
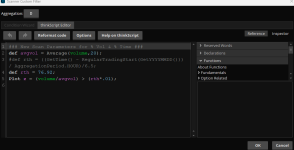
The Code:
On my charts I have them in the Lower Charts (where I use the Ultimate_Volume_Indicator). I don't know who wrote the script. It wasn't in the notes. My contribution was adding a calculation to give the percent calculation showing percent of this day's volume to the average daily volume AND the percent of time elapsed through the day in hours.
The Code:
Code:
Input ShowTotalVolume = yes;
Input ShowCurrentBarVolume = yes;
Input ShowPreviousBarVolume = yes;
Input ShowDaysAverageVolume = yes;
Input DaysAverage = 50;

### TOTAL VOLUME ###
AddLabel (ShowTotalVolume, "Total Volume: " + volume(period = aggregationperiod.DAY), color.WHITE);

### PERCENT CURRENT VOLUME TO DAYS AVERAGE VOLUME by CloudMan ###
def PercentVol = volume(period = aggregationperiod.DAY)/average(volume(period = aggregationperiod.day),DaysAverage);
def rth = ((GetTime() - RegularTradingStart(GetYYYYMMDD())) / AggregationPeriod.HOUR)/6.5;
AddLabel (yes, "V: " + AsPercent (PercentVol) + " T: " + AsPercent (rth), color.CYAN);

### DAYS AVERAGE VOLUME ###
AddLabel (ShowDaysAverageVolume, DaysAverage + "DAvg: " + average(volume(period = aggregationperiod.day),DaysAverage), color.light_gray);


### CURRENT BAR VOLUME ###
AddLabel (ShowCurrentBarVolume, "CurBar Volume: " + volume, if volume > volume[1] then color.green else color.red);

### PREVIOUS BAR VOLUME ###
AddLabel (ShowPreviousBarVolume, "PrevBar Volume: " + volume[1], color.orange);
Attachments
Last edited by a moderator: