
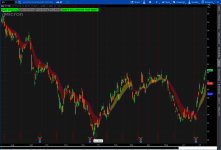
Alternative to Trend Exhaustion which show Volume strength, Price Strength and EMA 9/21 position. Also plots 9/21 EMAs and cloud on he chart.

Remember to set time frame to chart time. Can easily be changed to show labels only.
https://tos.mx/mfbFUp
Remember to set time frame to chart time. Can easily be changed to show labels only.
https://tos.mx/mfbFUp
thinkScript Code
Code:
#MUST ADJUST TIME FRAME OF THIS FORMULA TO MATCH CHART;

def agg = getAggregationPeriod();
input vPeriod = AggregationPeriod.HOUR;

def O = open(period = vPeriod);
def H = high(period = vPeriod);
def C = close(period = vPeriod);
def L = low(period = vPeriod);
def V = volume(period = vPeriod);

def SV = V * (H - C) / (H - L);
def BV = V * (C - L) / (H - L);

AddLabel(yes, "Buyer Vol Strong ", if high > high[1] and low > low[1] and BV*1.05 > SV then Color.GREEN else color.GRAY);

AddLabel(yes, "Seller Vol Strong", if high < high[1] and low < low[1] and SV*1.05 > BV then Color.MAGENTA else color.GRAY);


AddLabel(yes, "Price Strong ", if high > high[1] and high [1] > high[2] and low > low[1] and low[1] > low[2] then Color.GREEN else color.GRAY);

AddLabel(yes, "Price Weak", if high < high[1] and high[1] < high[2] and low < low[1] and low[1] < low[2] then Color.MAGENTA else color.GRAY);


declare upper;
input price = close;
input displace = 0;

input EMALength1 = 9;
input EMALength2 = 21;
Attachments
Last edited by a moderator: