
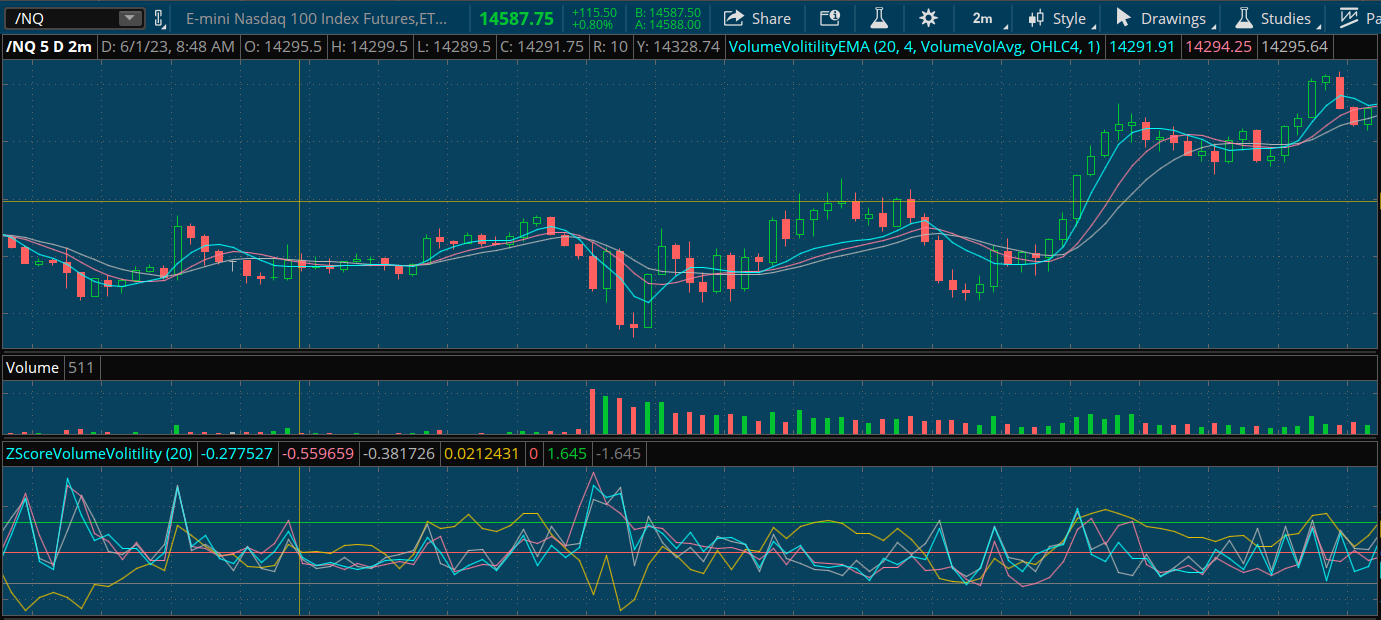
Hey everyone, I have been working on weighting various indicators by volume and volatility to try and make my analysis more holistic. I wanted to share one here that I think has the potential to be pretty useful. It's the Z scores of volume, volatility, and price on one plot. The overall goal is using the volume and volatility Z scores to help confirm what you are looking at. In the picture below, the yellow line is close price Z score, the pink volume, the blue true range, and the gray open minus close. More explanation is in the code.
Ruby:
#Volitility Volume Price Z-Score
#StoneMan (StoneF)
#6.2.2023
#V1.0
#Looks at Z score of price action, volatility, and volume for more comprehensive analysis

#Brief statistics lesson:

#Z score is data's relationship to its mean divided by its standard deviation
#The zero line represents the mean values above the mean are positive and below negative
#The values of 1.645 and -1.645 represent the level of which 95% of the data is expected to fall below and above assuming standard normal distribution
#In practical application of this indicator that provides a good "overbought" and "oversold" level

#How to use:

#I have found the best use of the indicator in looking for "jaws" between price and volatility and volume
#When price is below -1.645 and volatility and volume above 1.645 wait for those values to begin to converge to 0
#I have found a good signal to be when price Z score slope turns positive and volume and volatility fall below 1.645
#Confirmation may have to be when price crosses back above 1.645, use discretion
#Similar overbought conditions can be traded with the same method look for all lines above 1.645 in this case
#Do to the "escalator up elevator down" phenomenon I have found the "jaws" method for dip buying to be a clearer signal

#Note:
#Two ways to obtain volatility are provided you can use either or both with price and volume

declare lower;

input Length = 10;

#Calculating volitility Z-Score using true range
def TrueRange = TrueRange(high, close, low); #Observed value
def TR_Average = Average(TrueRange, Length); #Mean of sample
def TR_StDev = StDev(TrueRange, Length);     #Standard Deviation of sample

def TR_Z_Score = (TrueRange - TR_Average) / TR_StDev;

#Calculating volume Z-Score
Def V = Volume;                     #Observed value
def V_Average = Average(V, Length); #Mean of sample
def V_StDev = StDev(V, Length);     #Standard Deviation of sample

def V_Z_Score = (V - V_Average) / V_StDev;

#Calculating volitility Z-Score using difference between open and close
def OpenCloseDiff = AbsValue(open - close);      #Observed value
def OCD_Average = Average(OpenCloseDiff, Length); #Mean of sample
def OCD_StDev = StDev(OpenCloseDiff, Length);     #Standard Deviation of sample

def OCD_Z_Score = (OpenCloseDiff - OCD_Average) / OCD_StDev;

#Calculating Close Price Z-Score
Def C = Close;                      #Observed value
def C_Average = Average(C, Length); #Mean of sample
def C_StDev = StDev(C, Length);     #Standard Deviation of sample

def C_Z_Score = (C - C_Average) / C_StDev;

Plot TrueRange_Z = TR_Z_Score;
Plot Volume_Z = V_Z_Score;
plot OpenMinusClose_Z = OCD_Z_Score;
plot Close_Z = C_Z_Score;
plot ZeroLine = 0;
Plot Upper95 = 1.645;  #95th percentile
Plot Lower95 = -1.645; #95th percentile