Author states:
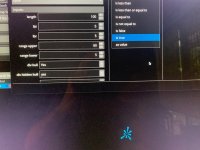
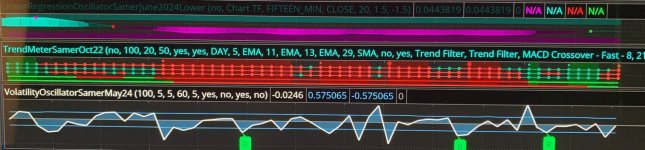
This tool displays relative volatility and directional trend. Excellent way to pickup diversions and reversals. Length can be lowered to 11 or 13 in settings to show price range.
Can be used to identify patterns such as parallel channels and likely direction of price action as pictured below.

Per member request:
https://usethinkscript.com/threads/trend-meter-for-thinkorswim.13179/#post-111303
This tool displays relative volatility and directional trend. Excellent way to pickup diversions and reversals. Length can be lowered to 11 or 13 in settings to show price range.
Can be used to identify patterns such as parallel channels and likely direction of price action as pictured below.
Per member request:
https://usethinkscript.com/threads/trend-meter-for-thinkorswim.13179/#post-111303
CSS:
#// This source code is subject to the terms of the Mozilla Public License 2.0 at https://mozilla.org/MPL/2.0/
#// © veryfid
# Converted by Sam4Cok@Samer800 - 10/2022
declare lower;
#//@version=4
#study("Volatility Oscillator", resolution = "")
def na = Double.NaN;
########################################################
DefineGlobalColor("Bull", CreateColor(100, 181, 246));
DefineGlobalColor("Bear", CreateColor(239, 83, 80));
DefineGlobalColor("bullcol", Color.GREEN);
DefineGlobalColor("bearcol", Color.RED);
DefineGlobalColor("weakcol", CreateColor( 255, 235, 59));
#########################################################
input length = 100;
def c = close; def o = open; def l = low; def h = high;
def diff = c-o;
plot spike = diff; #"Spike Linel"
spike.SetDefaultColor(Color.WHITE);
spike.SetLineWeight(2);
AddCloud (spike, 0, GlobalColor("Bull"), GlobalColor("Bull"));
def x = StDev(spike, length);
def y = StDev(spike, length) * -1;
plot p1 = x; # "Upper Line")
plot p2 = y; # "Lower Line")
p1.SetDefaultColor(GlobalColor("Bull"));
p2.SetDefaultColor(GlobalColor("Bull"));
plot ZeroLine = 0; #, color= color.gray, title= "Zero Line")
ZeroLine.SetDefaultColor(Color.GRAY);
#--- Div
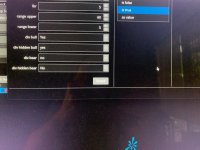
input lbl = 5;
input lbr = 5;
input rangeUpper = 60;
input rangeLower = 5;
input DivBull = yes; # "Plot Bullish"
input DivHiddenBull = no; # "Plot Hidden Bullish"
input DivBear = yes; # "Plot Bearish"
input DivHiddenBear = no; # "Plot Hidden Bearish"
def divSrc = spike;
script FindPivots {
input dat = high; # default data or study being evaluated
input HL = 0; # default high or low pivot designation, -1 low, +1 high
input PF = 1; # default pivot forward period
input PB = 5; # default pivot backward period
##############
def _nan; # used for non-number returns
def _BN; # the current barnumber
def _VStop; # confirms that the lookforward period continues the pivot trend
def _V; # the Value at the actual pivot point
def _VBar; # the bar number at the pivot point
def _PV; # the previous pivot Value
def _PVBar; # the previous pivot bar number
def _VDiff; # the difference in values between last two pivot points
def _VDist; # the diffence in barnumbers between last two pivot points
def _VSlope; # the Slope calculated using value and distance changes
def _VPivot; # used for the pivot point connector line only
##############
_BN = BarNumber();
_nan = Double.NaN;
_VStop =
fold a = 1 to PF + 1
with b = 1 while b
do if HL > 0 then
dat > GetValue(dat, -a) else
dat < GetValue(dat, -a) ;
if (HL > 0) {
_V = if _BN > PB and dat == Highest(dat, PB) and _VStop
then dat else _nan;
} else {
_V = if _BN > PB and dat == Lowest(dat, PB) and _VStop
then dat else _nan;
}
_VBar = if !IsNaN(_V) then _BN else _VBar[1];
_PV = if !IsNaN(_V) then GetValue(dat, _BN - _VBar[1]) else _PV[1];
_PVBar = if _VBar != _VBar[1]
then _PVBar[1] else _VBar;
_VDiff = AbsValue(_V) - AbsValue(_PV);
_VDist = _BN - _PVBar;
_VSlope = if _V > _PV then 1 else
if _V < _PV then -1 else 0;
if (HL > 0) {
_VPivot = _BN >= HighestAll(_PVBar);
} else {
_VPivot = _BN >= LowestAll(_PVBar);
}
plot result = if !IsNaN(_V) and _VStop then _V else _nan;
}
script valuewhen {
input cond = 0;
input pr = 0;
input n2 = 0;
def n = n2 + 1;
def offset2 = fold j = 0 to 200
with p
while p < n + 1
do p + ( if p == n then j - n else if GetValue(cond, j) then 1 else 0 );
plot price = GetValue(pr, offset2-1);
}
#_inRange(cond) =>
script _inRange {
input cond = yes;
input rangeUpper = 60;
input rangeLower = 5;
def bars = if cond then 0 else bars[1] + 1;
def inrange = (rangeLower <= bars) and (bars <= rangeUpper);
plot retrun = inRange;
}
def ph = findpivots(divSrc, 1, lbr, lbl);
def pl = findpivots(divSrc, -1, lbr, lbl);
def phFound = if isNaN(ph) then 0 else 1;
def plFound = if isNaN(pl) then 0 else 1;
def vhFound = valuewhen(phFound, divSrc, 1);
def vlFound = valuewhen(plFound, divSrc, 1);
def phPrice = valuewhen(phFound, h, 1);
def plPrice = valuewhen(plFound, l, 1);
#// Regular Bullish
def oscHL = divSrc > vlFound and _inRange(plFound[1],rangeUpper,rangeLower);
def priceLL = l < plPrice;
def bullCond = DivBull and plFound and oscHL and priceLL;
#// Hidden Bullish
def oscLL = divSrc < vlFound and _inRange(plFound[1],rangeUpper,rangeLower);
def priceHL = l > plPrice;
def hiddenBullCond = DivHiddenBull and plFound and oscLL and priceHL;
#// Regular Bearish
def oscLH = divSrc < vhFound and _inRange(phFound[1],rangeUpper,rangeLower);
def priceHH = h > phPrice;
def bearCond = DivBear and phFound and oscLH and priceHH;
#// Hidden Bearish
def oscHH = divSrc > vhFound and _inRange(phFound[1],rangeUpper,rangeLower);
def priceLH = h < phPrice;
def hiddenBearCond = DivHiddenBear and phFound and oscHH and priceLH;
addchartbubble(bullCond, divSrc, "R", color.green, no);
addchartbubble(bearCond, divSrc, "R", color.red, yes);
addchartbubble(hiddenBullCond, divSrc, "H", color.DARK_green, no);
addchartbubble(hiddenBearCond, divSrc, "H", color.DARK_red, yes);
#---- END
Last edited by a moderator: