
Author Message:
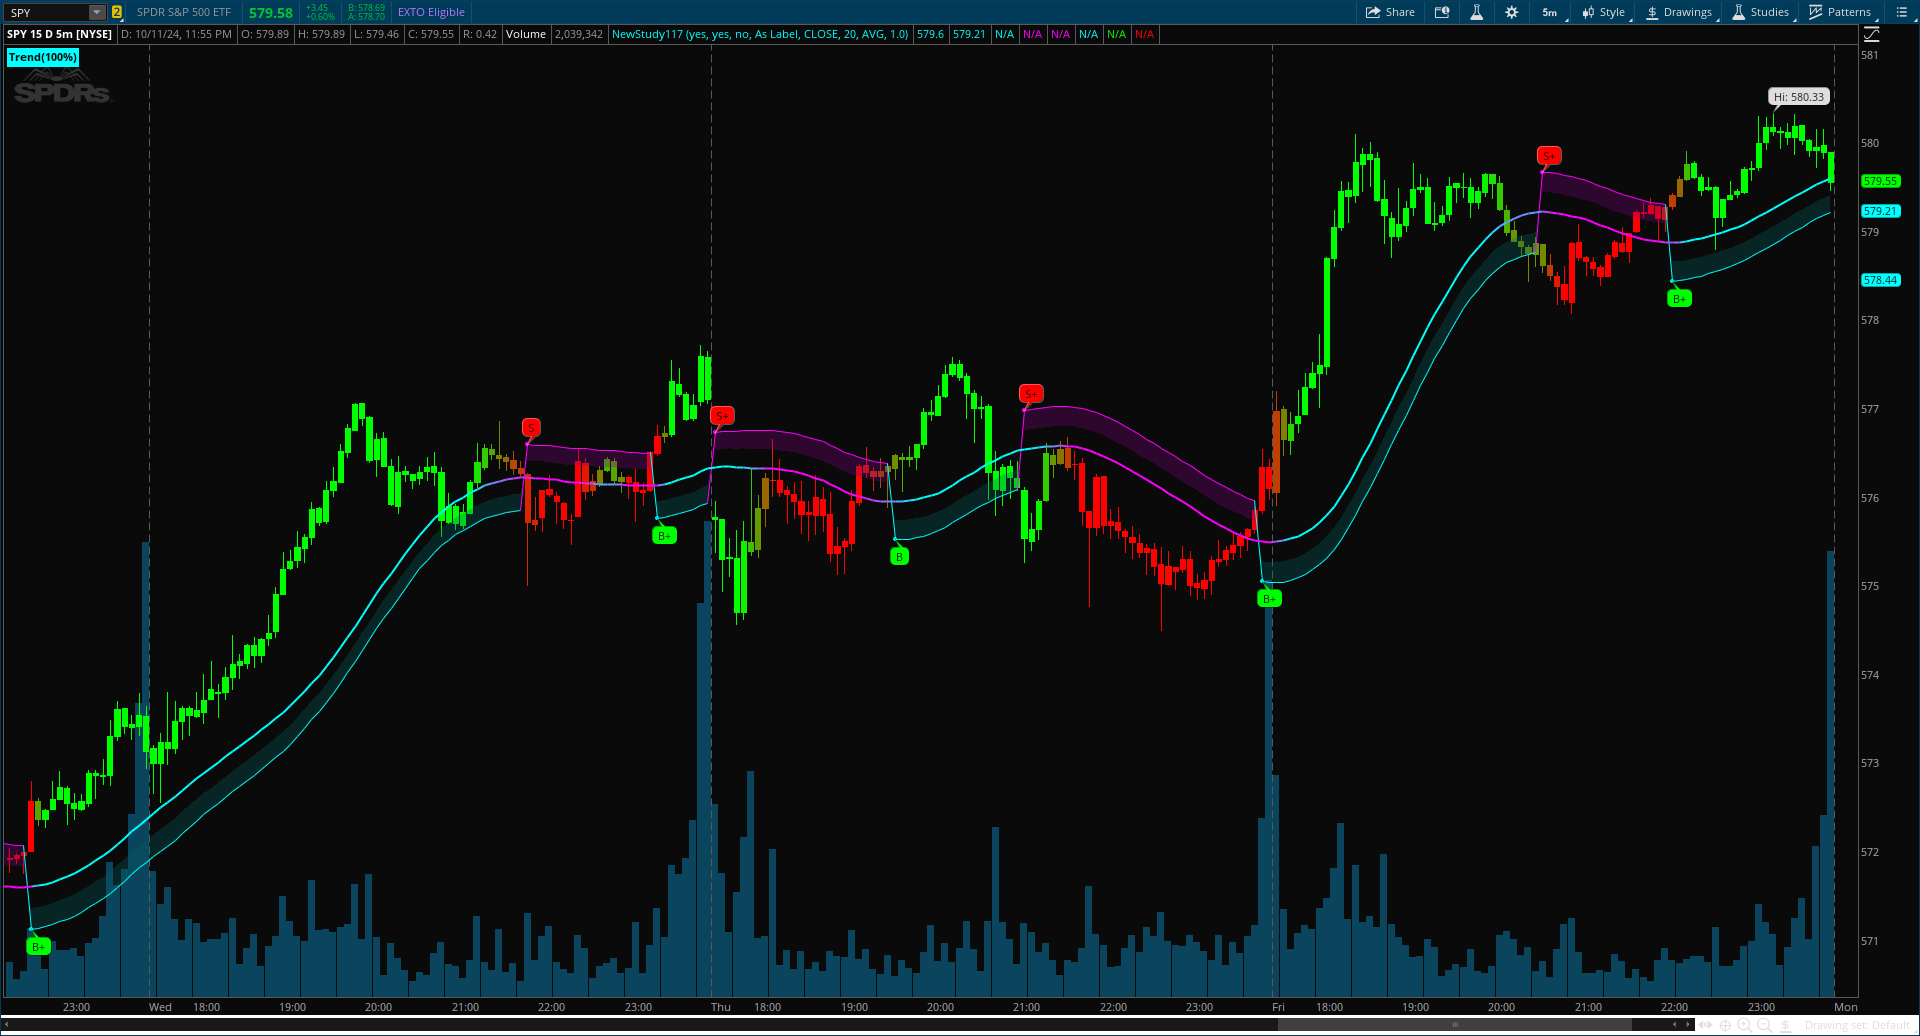
The Volatility Gaussian Bands indicator is a cutting-edge tool designed to analyze market trends and volatility with high precision. By applying a Gaussian filter to smooth price data and implementing dynamic bands based on market volatility, this indicator provides clear signals for trend direction, strength, and potential reversals. With updated volatility calculations, it enhances the accuracy of trend detection, making it a powerful addition to any trader's toolkit.
CODE:
CSS:
#// Indicator for TOS
#//@BigBeluga
#indicator("Volatility Gaussian Bands [BigBeluga]",
# Converted by Sam4Cok@Samer800    - 10/2024

input timeframe = AggregationPeriod.MIN;
input colorBars = yes;
input showSignals = yes;
input showRetestSignals = no; # "Retest Signals"
input showScore = {Default "As Label", "On Chart", "As Label & On Chart", "Don't Show Score"};
input source = FundamentalType.CLOSE;
input length = 20;         # "Length"
input calcType    = {Default "AVG", "MEADIAN", "MODE"} ;    # "Type"
input distance    = 1.0;

def na = Double.NaN;
def last = isNaN(close);
def current = GetAggregationPeriod();
def tf = Max(Current, timeframe);
def src = Fundamental(FundamentalType = source, Period = tf);
def sigma = 10;
def len = length;

#// CALCULATIONS
#//@function Calculates a Gaussian filter for smoothing the data
Script gaussian_filter {
input src = close;
input length = 20;
#input tf = 1;
#    def val = Fundamental(src, Period = tf);
    def sigma = 10;
    def pi = Double.Pi;
    def sqrtPi = sqrt(sigma * 2.0 * pi);
    def total = fold j = 0 to length with q do
                q + exp(-0.5 * power((j - length / 2) / sigma, 2.0)) / sqrtPi;
    def sum = fold i = 0 to length with p do
              p + (src[i] * exp(-0.5 * power((i - length / 2) / sigma, 2.0)) / sqrtPi / total);
    plot out = if isNaN(sum) then 0 else sum;
}

def pi = Double.Pi;
def coeff = 0.05;
def volatility = Average(high(Period = tf) - low(Period = tf), 100);

def gf00 = gaussian_filter(src, len + 0);
def gf01 = gaussian_filter(src, len + 1);
def gf02 = gaussian_filter(src, len + 2);
def gf03 = gaussian_filter(src, len + 3);
def gf04 = gaussian_filter(src, len + 4);
def gf05 = gaussian_filter(src, len + 5);
def gf06 = gaussian_filter(src, len + 6);
def gf07 = gaussian_filter(src, len + 7);
def gf08 = gaussian_filter(src, len + 8);
def gf09 = gaussian_filter(src, len + 9);
def gf10 = gaussian_filter(src, len + 10);
def gf11 = gaussian_filter(src, len + 11);
def gf12 = gaussian_filter(src, len + 12);
def gf13 = gaussian_filter(src, len + 13);
def gf14 = gaussian_filter(src, len + 14);
def gf15 = gaussian_filter(src, len + 15);
def gf16 = gaussian_filter(src, len + 16);
def gf17 = gaussian_filter(src, len + 17);
def gf18 = gaussian_filter(src, len + 18);
def gf19 = gaussian_filter(src, len + 19);
def gf20 = gaussian_filter(src, len + 20);

def score0 = 0;
def score1 = if gf01 > gf00 then score0 + coeff else score0;
def score2 = if gf02 > gf00 then score1 + coeff else score1;
def score3 = if gf03 > gf00 then score2 + coeff else score2;
def score4 = if gf04 > gf00 then score3 + coeff else score3;
def score5 = if gf05 > gf00 then score4 + coeff else score4;
def score6 = if gf06 > gf00 then score5 + coeff else score5;
def score7 = if gf07 > gf00 then score6 + coeff else score6;
def score8 = if gf08 > gf00 then score7 + coeff else score7;
def score9 = if gf09 > gf00 then score8 + coeff else score8;
def score10 = if gf10 > gf00 then score9 + coeff else score9;
def score11 = if gf11 > gf00 then score10 + coeff else score10;
def score12 = if gf12 > gf00 then score11 + coeff else score11;
def score13 = if gf13 > gf00 then score12 + coeff else score12;
def score14 = if gf14 > gf00 then score13 + coeff else score13;
def score15 = if gf15 > gf00 then score14 + coeff else score14;
def score16 = if gf16 > gf00 then score15 + coeff else score15;
def score17 = if gf17 > gf00 then score16 + coeff else score16;
def score18 = if gf18 > gf00 then score17 + coeff else score17;
def score19 = if gf19 > gf00 then score18 + coeff else score18;
def score = if gf20 > gf00 then score19 + coeff else score19;
def col = score * 255;

def avg1 = (gf00 + gf01 + gf02 + gf03 + gf04 + gf05 + gf06 + gf07 + gf08 + gf09 + gf10 +
           gf11 + gf12 + gf13 + gf14 + gf15 + gf16 + gf17 + gf18 + gf19 + gf20);
def mode1 = Min(gf00, Min(gf01, Min(gf02, Min(gf03, Min(gf04, Min(gf05, Min(gf06, Min(gf07, Min(gf08, gf09)))))))));
def mode2 = Min(gf10, Min(gf11, Min(gf12, Min(gf13, Min(gf14, Min(gf15, Min(gf16, Min(gf17, Min(gf18, gf19)))))))));
def mode  = Min(gf20, Min(mode1, mode2));
def avg = avg1 / 21;

def g_f;
Switch (calcType) {
Case "MEADIAN" : g_f = if gf10 then gf10 else na;
Case "MODE" :    g_f = if mode then mode else na;
Default :        g_f = if avg then avg else na;
}
def lower_band = g_f - volatility * distance; #  // Calculate lower band based on value and volatility
def upper_band = g_f + volatility * distance; #  // Calculate upper band based on value and volatility
#// Check crossover and crossunder of price with bands to determine trend
def crossUp = (src > upper_band) and (src[1] <= upper_band[1]);
def crossDn = (src < lower_band) and (src[1] >= lower_band[1]);
def trend = if crossUp then yes else if crossDn then no else trend[1];
#// Set trend line based on trend direction
def trend_line = if trend then lower_band else
                 if !trend then upper_band else na;

#-- Lines
plot avgLine = if g_f then g_f else na;
plot trendLine = if trend_line then trend_line else na;
avgLine.SetLineWeight(2);
avgLine.AssignValueColor(CreateColor(col,255- col, 255));
trendLine.AssignValueColor(if trend then Color.CYAN else Color.MAGENTA);

AddCloud(avgLine - (avgLine - trendLine)/2, trendLine, CreateColor(0, 100, 100), Color.PLUM);

#-- Signals
def sigUp = (src > trend_line) and (src[1] <= trend_line[1]);
def sigDn = (src < trend_line) and (src[1] >= trend_line[1]);

plot sigUpPt = if sigUp then trend_line else na;
plot sigDnPt = if sigDn then trend_line else na;
sigUpPt.SetStyle(Curve.POINTS);
sigDnPt.SetStyle(Curve.POINTS);
sigDnPt.SetDefaultColor(Color.MAGENTA);
sigUpPt.SetDefaultColor(Color.CYAN);

AddChartBubble(showSignals and sigUp, trend_line, if score > 0.5 then "B+" else "B", Color.GREEN, no);
AddChartBubble(showSignals and sigDn, trend_line, if score < 0.5 then "S+" else "S", Color.RED);

#--retest
def retestUp = showRetestSignals and ((low > avgLine) and (low[1] <= avgLine[1])) and trend;
def retestDn = showRetestSignals and ((high < avgLine) and (high[1] >= avgLine[1])) and !trend;

plot retestHi = if retestDn[-1] then retestDn[-1] else na;
plot retestLo = if retestUp[-1] then retestUp[-1] else na;

retestHi.SetDefaultColor(Color.MAGENTA);
retestLo.SetDefaultColor(Color.CYAN);
retestHi.SetPaintingStrategy(PaintingStrategy.BOOLEAN_WEDGE_UP);
retestLo.SetPaintingStrategy(PaintingStrategy.BOOLEAN_WEDGE_DOWN);

#-- Score
def lab; def chart;
Switch (showScore) {
Case "As Label & On Chart" :
    lab = yes;
    chart = yes;
Case "On Chart" :
    lab = no;
    chart = yes;
Case "Don't Show Score" :
    lab = no;
    chart = no;
Default :
    lab = yes;
    chart = no;
}
#// Calculate score-up and score-down for trend strength representation
def score_up = (score - 1) * -1;
def score_dn = 1 - score_up;

AddLabel(lab and score_up>0, "Trend(" + AsPercent(score_up) + ")", CreateColor(col,255- col, 255));
AddLabel(lab and score_dn>0, "Trend(" + AsPercent(-score_dn) + ")", CreateColor(col,255- col, 255));

plot scoreUp = if chart and score_up > 0 then score_up else na;
plot scoreDn = if chart and score_dn > 0 then -score_dn else na;
scoreup.SetPaintingStrategy(PaintingStrategy.VALUES_BELOW);
scoredn.SetPaintingStrategy(PaintingStrategy.VALUES_ABOVE);
scoreUp.SetDefaultColor(Color.GREEN);
scoreDn.SetDefaultColor(Color.RED);

# Bar Colors
AssignPriceColor(if !colorBars then Color.CURRENT else CreateColor(col,255- col, 0));

#-- END of CODE