Volatility Based Momentum Indicator for ThinkorSwim

BenTen

Administrative
Staff member
Staff
VIP
Lifetime
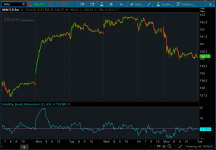
The Volatility Based Momentum (VBM) indicator is a variation on the rate-of-change ( ROC ) indicator. Instead of expressing momentum in a percentage gain or loss, VBM normalizes momentum using the historical volatility of the underlying security...The calculation for a volatility based momentum (VBM) indicator is very similar to ROC , but divides by the security’s historical volatility instead. The average true range indicator (ATR) is used to compute historical volatility.

For example, on a daily chart , VBM(22,65) calculates how many MoV price has increased or decreased over the last 22 trading days (approximately one calendar month). The second parameter is the number of periods to use with the ATR indicator to normalize the momentum in terms of volatility.

For more details, there is an article further describing VBM and its applicability versus ROC.

U03412B.png


thinkScript Code

Code:
declare lower;

input rocPeriod = 22;
input atrPeriod = 65;

def rateOfChange = close[0] - close[rocPeriod];
def normalizationATR = atr(atrPeriod)[0];
def volatilityBasedMomentum = rateOfChange / normalizationATR;

plot VBM = volatilityBasedMomentum;
plot ZeroLine = 0;
ZeroLine.AssignValueColor(GetColor(0));
 

Attachments

  • U03412B.png
    U03412B.png
    107.4 KB · Views: 135
I looked at this request, after adding the snippet that @BenTen posted earlier, the resulting display does look a bit squished. I was thinking that perhaps it might be a better idea to transform this into an upper study so that the arrows can be clearly marked on the chart. However perhaps this might not be a perfect study to use for buy/sell as we see the convergence of the so-called "buy"/"sell" arrows that make the signal not clear and confusing. However if the requester really wishes to see those arrows, here is version 1.1 based on @BenTen original study

Code:
# Volatility Based Momentum
# tomsk
# 1.12.2020

# V1.0 - 12.03.2019 - BenTen - Initial release of Volatility Based Momentum study (Lower Study)
# V1.1 - 01.12.2020 - tomsk  - Converted to upper study so that intended signals can be displayed

input rocPeriod = 22;
input atrPeriod = 65;

def rateOfChange = close[0] - close[rocPeriod];
def normalizationATR = atr(atrPeriod)[0];
def volatilityBasedMomentum = rateOfChange / normalizationATR;
def VBM = volatilityBasedMomentum;

plot bull = if VBM crosses above 0 then low * 0.996  else Double.NaN;
plot bear = if VBM crosses below 0 then high * 1.004 else Double.NaN;

bull.SetPaintingStrategy(PaintingStrategy.BOOLEAN_ARROW_UP);
bull.SetDefaultColor(Color.YELLOW);
bull.SetLineWeight(3);

bear.SetPaintingStrategy(PaintingStrategy.BOOLEAN_ARROW_DOWN);
bear.SetDefaultColor(Color.CYAN);
bear.SetLineWeight(3);
# End Volatility Based Momentum
 
thanks @tomsk - Quick testing on lower time frames, a value of 15, 39 seems to be a good optimization for lower time frame intraday scalps (e.g. 1 to 3 min TF).
 

Join useThinkScript to post your question to a community of 21,000+ developers and traders.

Similar threads

Not the exact question you're looking for?

Start a new thread and receive assistance from our community.

87k+ Posts
377 Online
Create Post

Similar threads

Similar threads

The Market Trading Game Changer

Join 2,500+ subscribers inside the useThinkScript VIP Membership Club
  • Exclusive indicators
  • Proven strategies & setups
  • Private Discord community
  • ‘Buy The Dip’ signal alerts
  • Exclusive members-only content
  • Add-ons and resources
  • 1 full year of unlimited support

Frequently Asked Questions

What is useThinkScript?

useThinkScript is the #1 community of stock market investors using indicators and other tools to power their trading strategies. Traders of all skill levels use our forums to learn about scripting and indicators, help each other, and discover new ways to gain an edge in the markets.

How do I get started?

We get it. Our forum can be intimidating, if not overwhelming. With thousands of topics, tens of thousands of posts, our community has created an incredibly deep knowledge base for stock traders. No one can ever exhaust every resource provided on our site.

If you are new, or just looking for guidance, here are some helpful links to get you started.

What are the benefits of VIP Membership?
VIP members get exclusive access to these proven and tested premium indicators: Buy the Dip, Advanced Market Moves 2.0, Take Profit, and Volatility Trading Range. In addition, VIP members get access to over 50 VIP-only custom indicators, add-ons, and strategies, private VIP-only forums, private Discord channel to discuss trades and strategies in real-time, customer support, trade alerts, and much more. Learn all about VIP membership here.
How can I access the premium indicators?
To access the premium indicators, which are plug and play ready, sign up for VIP membership here.
Back
Top