Nice work good sir... Added some pretty colors and rounded to whole number...
Code:
#Defining variables

def Delta = Delta();

def Ivol = imp_volatility(GetUnderlyingSymbol());

def OptionMarkPrice = close;

def UnderlyingPrice = close(getUnderlyingSymbol());

def UnderlyingVolume = volume(getUnderlyingSymbol());

#V.A.L.R - Volitility Adjusted Leverage Ratio

def Leverage = (Delta * UnderlyingPrice);

def LeverageRatio = Leverage / OptionMarkPrice;

def VALR = LeverageRatio * Ivol;

#Volume to open interest ratio (if statement pervents divide by zero errors)

def OpenInterest = if open_interest(period = AggregationPeriod.DAY) == 0 then 1 else open_interest(period = AggregationPeriod.DAY);

def volOI = volume / OpenInterest;

#Option dollar volume traded

def DvolumeOpt = volume * ohlc4 * 100;

#Underlying dollar volume traded

def DvolumeUnd = UnderlyingPrice * UnderlyingVolume;

def DvolumeRatio = DvolumeOpt / DvolumeUnd;

#Multiply by 1000 so output better displays in the columns

def WhaleScore = round(VALR * volOI * DvolumeRatio * 1000,0);

plot WhalePlot = WhaleScore;
addlabel(yes, whalescore, if (WHALESCORE >=2100) then Color.black
else if WHALESCORE >=1000 and WHALESCORE<2100 then Color.white
else if WHALESCORE <1000 and  WHALESCORE >=100 then Color.white
else if WHALESCORE <100 and  WHALESCORE >=0 then Color.white
else if WHALESCORE <0 and  WHALESCORE >=-100 then Color.white
else if WHALESCORE <-100 and  WHALESCORE >=-1000 then Color.white
else if WHALESCORE <-2100 then Color.black
else Color.dark_GRAY);

AssignBackgroundColor(
if (WHALESCORE >=2100) then Color.cyan
else if WHALESCORE >=1000 and WHALESCORE<2100 then Color.dark_green
else if WHALESCORE <1000 and  WHALESCORE >=100 then Color.gray
else if WHALESCORE <100 and  WHALESCORE >=0 then Color.gray
else if WHALESCORE <0 and  WHALESCORE >=-100 then Color.gray
else if WHALESCORE <-100 and  WHALESCORE >=-1000 then Color.dark_green
else if WHALESCORE <-2100 then Color.cyan
else Color.dark_GRAY);
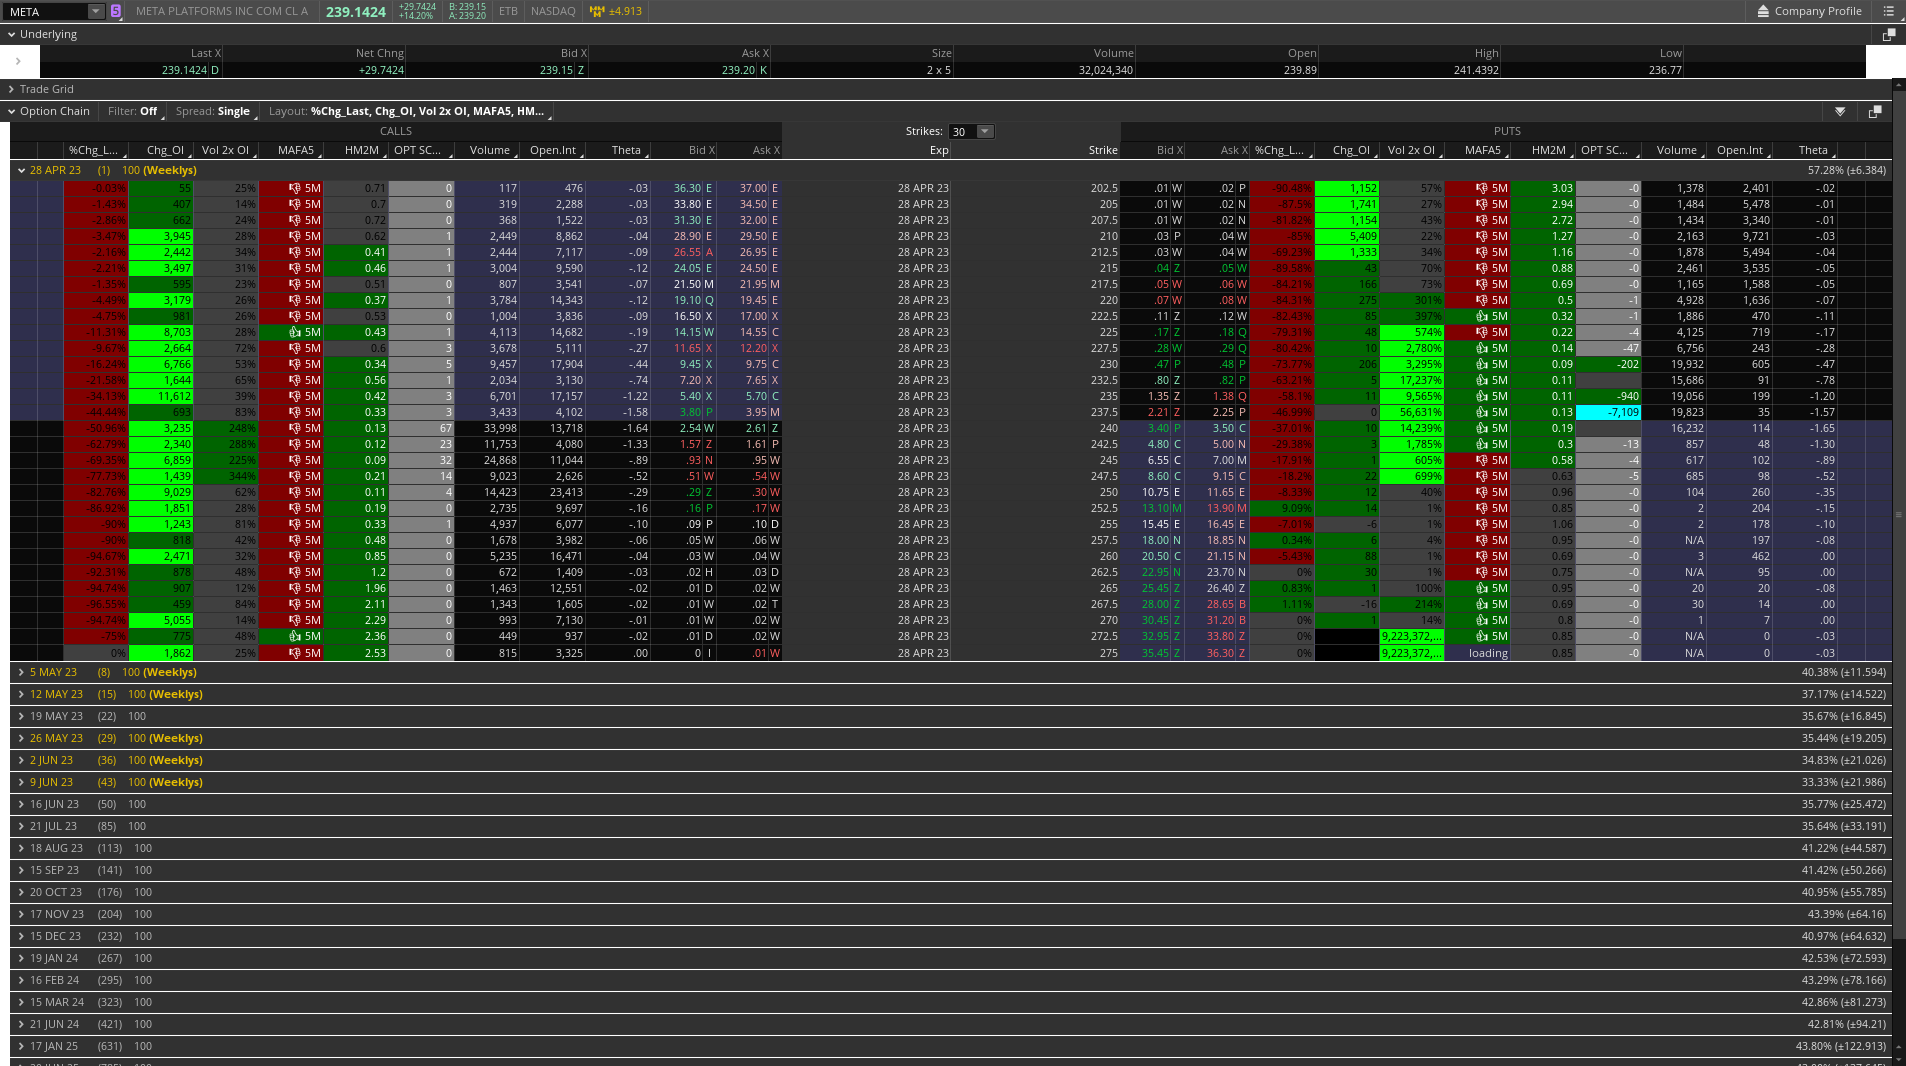
Hey everyone. I created a metric to judge unusual options activity that works as a column. Here is the code:
Code:
#Defining variables

def Delta = Delta();

def Ivol = imp_volatility(GetUnderlyingSymbol());

def OptionMarkPrice = close;

def UnderlyingPrice = close(getUnderlyingSymbol());

def UnderlyingVolume = volume(getUnderlyingSymbol());

#V.A.L.R - Volitility Adjusted Leverage Ratio

def Leverage = (Delta * UnderlyingPrice);

def LeverageRatio = Leverage / OptionMarkPrice;

def VALR = LeverageRatio * Ivol;

#Volume to open interest ratio (if statement pervents divide by zero errors)

def OpenInterest = if open_interest(period = AggregationPeriod.DAY) == 0 then 1 else open_interest(period = AggregationPeriod.DAY);

def volOI = volume / OpenInterest;

#Option dollar volume traded

def DvolumeOpt = volume * ohlc4 * 100;

#Underlying dollar volume traded

def DvolumeUnd = UnderlyingPrice * UnderlyingVolume;

def DvolumeRatio = DvolumeOpt / DvolumeUnd;

#Multiply by 1000 so output better displays in the columns

def WhaleScore = VALR * volOI * DvolumeRatio * 1000;

plot WhalePlot = WhaleScore;
Here is the logic behind the calculations:
def Leverage: We begin by multiplying the Delta of a contract by the price of the underlying to get how many dollars worth of the underlying one contract controls. Using the amount of dollars controlled per contract normalizes the measurement so it can be compared between instruments.
def LeverageRatio: We divide the dollar volume controlled per contract by the dollar amount of that contract. This gives us a unitless ratio that is how many dollars worth of the underlying you are controlling per dollar spent on the contract. This alone could be a useful metric.
def VALR: We multiply the LeverageRatio by the implied volitility (IVol) of the underlying instrument. This is done to normalize the value because low implied volitility instruments naturally allow for more leverage in their options contracts than high ones. So now all instruments dollar leverage per contract should be on an even playing field. This metric is still unitless.
def volOI: volume to open interest ratio. This is the classic metric considered when hunting for unusual options and is very important.
def DvolumeOpt: Dollar volume traded in the option contract, just multiplying option price by volume. Keeping to the theme of normalizing to dollars so we can better compare instruments.
def DvolumeUnd: Dollar volume traded in the underlying, just multiplying underlying price by underlying volume. Keeping to the theme of normalizing to dollars so we can better compare instruments.
def DvolumeRatio: Ratio of money spent on the option contract to the whole of the underlying. Represents underlyings capacity to absorb options activity. Higher values show that contract has more impact on the underlying by representing a higher proportion of liquidity. A problem I've noticed with other unusual options scanners is tickers like SPY and AAPL always showing lots of "unusual activity" due to massive dollar volumes traded at given strikes. Relative to the liquidity of SPY and AAPL the activity is actually not that unusual. This ratio is how we account for differing levels of liquidity across instruments.
Def WhaleScore: Our final unusual options activity metric, we get it by multiplying three ratios. The unitless metric VALR which measures how many dollars worth of the underlying you are controlling per dollar spent on a contract on a volitility adjusted basis. Higher values equate to more risk (and therefore more conviction) by naturally prioritizing out of the money high risk plays. Volume to open interest ratio shows money being put where it wasn't previously. DvolumeRatio shows the amount of money spent on the option contract relative to the whole of the underlying. Higher values are more unusual as it means option contract spend is a higher proportion of the total liquidity. All of these metrics are multiplied together to get a value where the farther you are from zero the more "unusual" the activity. Multiplying by 1000 is just to make the output more user friendly to display in the columns.
Note: In the thinkorswim implementation WhaleScore positive values are calls and negative values are puts due to the delta value being positive or negative depending on put or call designation.
And here is the thread where I ask questions on how it can be improved so those discussions can be had there:
@StoneMan: I really like your study. Unfortunately, when added to my options montage as a custom column, it does not display any numbers. Just "NaN". I have the aggregation for your study set to "Day". The amount of strikes for my montage is set to "Strikes: 30". Any ideas as to why this is happening?
Nice work good sir... Added some pretty colors and rounded to whole number...
Code:
#Defining variables

def Delta = Delta();

def Ivol = imp_volatility(GetUnderlyingSymbol());

def OptionMarkPrice = close;

def UnderlyingPrice = close(getUnderlyingSymbol());

def UnderlyingVolume = volume(getUnderlyingSymbol());

#V.A.L.R - Volitility Adjusted Leverage Ratio

def Leverage = (Delta * UnderlyingPrice);

def LeverageRatio = Leverage / OptionMarkPrice;

def VALR = LeverageRatio * Ivol;

#Volume to open interest ratio (if statement pervents divide by zero errors)

def OpenInterest = if open_interest(period = AggregationPeriod.DAY) == 0 then 1 else open_interest(period = AggregationPeriod.DAY);

def volOI = volume / OpenInterest;

#Option dollar volume traded

def DvolumeOpt = volume * ohlc4 * 100;

#Underlying dollar volume traded

def DvolumeUnd = UnderlyingPrice * UnderlyingVolume;

def DvolumeRatio = DvolumeOpt / DvolumeUnd;

#Multiply by 1000 so output better displays in the columns

def WhaleScore = round(VALR * volOI * DvolumeRatio * 1000,0);

plot WhalePlot = WhaleScore;
addlabel(yes, whalescore, if (WHALESCORE >=2100) then Color.black
else if WHALESCORE >=1000 and WHALESCORE<2100 then Color.white
else if WHALESCORE <1000 and  WHALESCORE >=100 then Color.white
else if WHALESCORE <100 and  WHALESCORE >=0 then Color.white
else if WHALESCORE <0 and  WHALESCORE >=-100 then Color.white
else if WHALESCORE <-100 and  WHALESCORE >=-1000 then Color.white
else if WHALESCORE <-2100 then Color.black
else Color.dark_GRAY);

AssignBackgroundColor(
if (WHALESCORE >=2100) then Color.cyan
else if WHALESCORE >=1000 and WHALESCORE<2100 then Color.dark_green
else if WHALESCORE <1000 and  WHALESCORE >=100 then Color.gray
else if WHALESCORE <100 and  WHALESCORE >=0 then Color.gray
else if WHALESCORE <0 and  WHALESCORE >=-100 then Color.gray
else if WHALESCORE <-100 and  WHALESCORE >=-1000 then Color.dark_green
else if WHALESCORE <-2100 then Color.cyan
else Color.dark_GRAY);
@StoneMan: I really like your study. Unfortunately, when added to my options montage as a custom column, it does not display any numbers. Just "NaN". I have the aggregation for your study set to "Day". The amount of strikes for my montage is set to "Strikes: 30". Any ideas as to why this is happening?
Try selecting include extended trading hours and see if that fixes it. I have found that doing this can help in some instances. Let me know if that works.
Try selecting include extended trading hours and see if that fixes it. I have found that doing this can help in some instances. Let me know if that works.
@StoneMan: Seems like I have found the problem. Your study produces "Nan" for the SPX. It works fine for stocks or ETFs such as SPY. As of 1 pm (CT) today, it is showing a whopping -407.80 for the .TSLA230519P172.5 . So I will be keeping a close eye on that one. Thanks again for creating and sharing this awesome study! And also thanks to HODL-Lay-HE-hoo! for adding the colors to the script!
Nice work good sir... Added some pretty colors and rounded to whole number...
Code:
#Defining variables

def Delta = Delta();

def Ivol = imp_volatility(GetUnderlyingSymbol());

def OptionMarkPrice = close;

def UnderlyingPrice = close(getUnderlyingSymbol());

def UnderlyingVolume = volume(getUnderlyingSymbol());

#V.A.L.R - Volitility Adjusted Leverage Ratio

def Leverage = (Delta * UnderlyingPrice);

def LeverageRatio = Leverage / OptionMarkPrice;

def VALR = LeverageRatio * Ivol;

#Volume to open interest ratio (if statement pervents divide by zero errors)

def OpenInterest = if open_interest(period = AggregationPeriod.DAY) == 0 then 1 else open_interest(period = AggregationPeriod.DAY);

def volOI = volume / OpenInterest;

#Option dollar volume traded

def DvolumeOpt = volume * ohlc4 * 100;

#Underlying dollar volume traded

def DvolumeUnd = UnderlyingPrice * UnderlyingVolume;

def DvolumeRatio = DvolumeOpt / DvolumeUnd;

#Multiply by 1000 so output better displays in the columns

def WhaleScore = round(VALR * volOI * DvolumeRatio * 1000,0);

plot WhalePlot = WhaleScore;
addlabel(yes, whalescore, if (WHALESCORE >=2100) then Color.black
else if WHALESCORE >=1000 and WHALESCORE<2100 then Color.white
else if WHALESCORE <1000 and  WHALESCORE >=100 then Color.white
else if WHALESCORE <100 and  WHALESCORE >=0 then Color.white
else if WHALESCORE <0 and  WHALESCORE >=-100 then Color.white
else if WHALESCORE <-100 and  WHALESCORE >=-1000 then Color.white
else if WHALESCORE <-2100 then Color.black
else Color.dark_GRAY);

AssignBackgroundColor(
if (WHALESCORE >=2100) then Color.cyan
else if WHALESCORE >=1000 and WHALESCORE<2100 then Color.dark_green
else if WHALESCORE <1000 and  WHALESCORE >=100 then Color.gray
else if WHALESCORE <100 and  WHALESCORE >=0 then Color.gray
else if WHALESCORE <0 and  WHALESCORE >=-100 then Color.gray
else if WHALESCORE <-100 and  WHALESCORE >=-1000 then Color.dark_green
else if WHALESCORE <-2100 then Color.cyan
else Color.dark_GRAY);
shared workspace does not convey scripts so would not provide you with what you are looking for.
As you did not say where you are incurring an issue.
We can't begin to say where you went astray.
Here are some general directions on:
How to add a watchlist script to the option chain:
same as adding custom watchlist column
Trade > Click on Mark in either Put or Call column
add new custom quote
insert code
For those of you still having problems trying to add @StoneMan's Unusual Options Metric study to your options chain, here are two YouTube videos that should help.
@StoneMan: Seems like I have found the problem. Your study produces "Nan" for the SPX. It works fine for stocks or ETFs such as SPY. As of 1 pm (CT) today, it is showing a whopping -407.80 for the .TSLA230519P172.5 . So I will be keeping a close eye on that one. Thanks again for creating and sharing this awesome study! And also thanks to HODL-Lay-HE-hoo! for adding the colors to the script!
That is because SPX does not trade the underlying so there is no underlying volume data to return. Part of this metric is comparing the "relative liquidity" of the underlying by finding the dollar volume traded on it (underlying price times volume) to that of the option (option price times volume).
Regarding the .TSLA230519P172.5 that I mentioned in post #28 of this thread. It should be noted that just because that PUT had a very high Unusual Options Metric number, one should not assume that all of those puts were on the buy side of the trade. Using my options flow software, I was able to see that there were seven trades yesterday for that strike price. (With a minimum premium of #100k for each trade and an expiration date of 5/19/2023). Two of those PUT trades were on the buy side. And the remaining five from yesterday were on the sell side.
I don't understand how you trade this. So if the number is high like 524 do I trade it? I am looking at tsla Calls 2x oi is 793% for May 5, 23 (same day expire) calls with a whale score of 524 (not highlighted any color) at 160 strikes. yet the puts at 160 strike are being highlighted green and are only -152 with 2x oi of 452%. Why would it highlight green the one but not the other? Is this saying to buy the puts over the calls?
I don't understand how you trade this. So if the number is high like 524 do I trade it? I am looking at tsla Calls 2x oi is 793% for May 5, 23 (same day expire) calls with a whale score of 524 (not highlighted any color) at 160 strikes. yet the puts at 160 strike are being highlighted green and are only -152 with 2x oi of 452%. Why would it highlight green the one but not the other? Is this saying to buy the puts over the calls?
Don't blindy trade this (or really any) individual signal. This tool was made to highlight potential opportunities and start you on your path to doing your own due diligence and risk assessment. Like @rip78 was talking about, check the time and sales to see if the volume traded was bullish, bearish, or part of a spread. From there engage in whatever personal risk assessment or DD you personally prefer to do. This tool is not a complete trading system, it's actually quite incomplete and inaccurate, but it could be useful. I am working on a similar intraday tool to try and rectify some of those inaccuracies and focus in on identifying large block/sweep trades and when they occurred. It will be an improvement but still not a complete trading system.
Just came across this thread, love the columns for the options chain, especially the vol2xOI. i just have questions about the whalescore. it was mentioned the further away we are from a score of zero, the more unusual the activity of the strike is. How do you guys take this into account when making your thesis and choosing what strikes you are going to play?
i know there are different colors for the whale score so are you guys playing only these colored strikes?
Regarding the .TSLA230519P172.5 that I mentioned in post #28 of this thread. It should be noted that just because that PUT had a very high Unusual Options Metric number, one should not assume that all of those puts were on the buy side of the trade. Using my options flow software, I was able to see that there were seven trades yesterday for that strike price. (With a minimum premium of #100k for each trade and an expiration date of 5/19/2023). Two of those PUT trades were on the sell side. And the remaining five from yesterday were on the sell side.
The whalescore combines the metrics of volume to OI ratio. The IVol adjusted leverage of how many dollars worth of the underlying you are buying per dollar spent on the contract (more leverage is, in theory, a more "aggressive" play). And the ratio of money spent on the option contract to the whole of the underlying that day, this helps to normalize for asset liquidity. A million dollar block of SPY options vs a million dollar block of small cap options has a very different impact. Read the first post where every variable is explained for a more thorough explanation. The overall "purpose" of WhaleScore is to normalize all these factors so you have one metric you can compare all optionable assets with.
useThinkScript is the #1 community of stock market investors using indicators and other tools to power their trading strategies. Traders of all skill levels use our forums to learn about scripting and indicators, help each other, and discover new ways to gain an edge in the markets.
How do I get started?
We get it. Our forum can be intimidating, if not overwhelming. With thousands of topics, tens of thousands of posts, our community has created an incredibly deep knowledge base for stock traders. No one can ever exhaust every resource provided on our site.
If you are new, or just looking for guidance, here are some helpful links to get you started.
VIP members get exclusive access to these proven and tested premium indicators: Buy the Dip, Advanced Market Moves 2.0, Take Profit, and Volatility Trading Range. In addition, VIP members get access to over 50 VIP-only custom indicators, add-ons, and strategies, private VIP-only forums, private Discord channel to discuss trades and strategies in real-time, customer support, trade alerts, and much more. Learn all about VIP membership here.
How can I access the premium indicators?
To access the premium indicators, which are plug and play ready, sign up for VIP membership here.