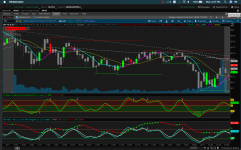
UCSGears Top and Bottom Candle Identifier for Thinkorswim

netarchitech

Well-known member
tnb.png


My first TradingView port...Looking forward to thoughts, feedback, backtests, etc...

Code:
# filename: _TnB_Candle_Identifier_
# source: https://www.tradingview.com/script/wkUMNJQm-UCS-Top-Bottom-Candle/

# Original idea and execution:
# Short Term Top and Bottom Candle Identifier
# Code by UCSgears

# initial port by netarchitech
# 2019.11.04

declare lower;

input percentKlength = 5;
input percentDlength = 3;

# Range Calculation
def ll = lowest (low, percentKlength);
def hh = highest (high, percentKlength);
def diff = hh - ll;
def rdiff = close - (hh+ll)/2;

# Nested Moving Average for smoother curves
def avgrel = expaverage(expaverage(rdiff,percentDlength),percentDlength);
def avgdiff = expaverage(expaverage(diff,percentDlength),percentDlength);

# Momentum
def mom = ((close - close[percentDlength])/close[percentDlength])*1000;

# SMI (Stochastic Momentum Index) calculations
plot SMI = if avgdiff != 0 then (avgrel/(avgdiff/2)*100) else 0;
SMI.SetDefaultColor(Color.GREEN);
SMI.SetLineWeight(2);

plot SMIsignal = expaverage(SMI,percentDlength);
SMIsignal.SetDefaultColor(Color.RED);
SMIsignal.SetLineWeight(2);

#UI enhancements
plot ZeroLine = 0;
Zeroline.SetDefaultColor(GetColor(4));

def over_bought = 40;
plot overbought = over_bought;
overbought.SetDefaultColor(GetColor(4));
overbought.HideTitle();

def over_sold = -40;
plot oversold = over_sold;
oversold.SetDefaultColor(GetColor(4));
oversold.HideTitle();

AddCloud(if SMI >= 40 then SMI else Double.NaN, over_bought, Color.RED, Color.RED);
AddCloud(if SMI <= -40 then SMI else Double.NaN, over_sold, Color.GREEN, Color.GREEN);

AddCloud(Zeroline, over_bought, Color.DARK_RED, Color.DARK_RED);
AddCloud(over_sold, Zeroline, Color.DARK_GREEN, Color.DARK_GREEN);

# Strategy Signals

#def long = if SMI < 35 and mom > 0 and mom[1] < 0 then Color.GREEN else Double.NaN;
def long = SMI < 35 and mom > 0 and mom[1] < 0;

#def short = if SMI > 35 and mom < 0 and mom[1] > 0 then Color.RED else Double.NaN;
def short = SMI > 35 and mom < 0 and mom[1] > 0;

AssignPriceColor(if long
                 then Color.GREEN
                 else if short
                      then Color.RED
                      else Color.GRAY);


input showBreakoutSignals = yes;

# plot the Breakout Signals
plot UpSignal = if SMI crosses above OverSold then OverSold else Double.NaN;
UpSignal.SetHiding(!showBreakoutSignals);
UpSignal.SetDefaultColor(Color.UPTICK);
UpSignal.SetPaintingStrategy(PaintingStrategy.ARROW_UP);
UpSignal.HideTitle();

plot DownSignal = if SMI crosses below OverBought then OverBought else Double.NaN;
DownSignal.SetHiding(!showBreakoutSignals);
DownSignal.SetDefaultColor(Color.DOWNTICK);
DownSignal.SetPaintingStrategy(PaintingStrategy.ARROW_DOWN);
DownSignal.HideTitle();

Good Luck and Good Trading :)
 
Last edited:

Join useThinkScript to post your question to a community of 21,000+ developers and traders.

@netarchitech This is the same as the Stochastic Momentum Index with the DSS line that you did for me previously...I like the SMI/DSS study a lot actually. I think this version has some cool features for example...I like the ZERO line and I like the RED for the OB and GREEN for the OS conditions in the study...What confuses me are the candle colors...What are they suppose to represent? The GREEN on the candlesticks does not always signify a move up and the RED does not always signify a move down?

htDe4i2.png


On a side note...are you able to add certain things from the USCGears to the SMI/DSS such as the ZERO Line and the RED and GREEN that's above the and below the ZERO Line? Perhaps even you can add on the DSS line if you really like the candle change in that study...

Is there potentially another way to identify the RED or GREEN candles in the USCGears? Maybe with a RED or GREEN UP/DOWN arrow instead? Reason being is that if someone is already using a SuperTrend study they will not be able to use this study in confluence.

SMI/DSS Code:

Code:
# Stochastic_Momentum_Index
# original author: TDAmeritrade
# enhancements: netarchitech
# 10.20.2019


declare lower;

input over_bought = 40.0;
input over_sold = -40.0;
input percentDLength = 3;
input percentKLength = 5;
input showBreakoutSignals = {default "No", "On SMI", "On AvgSMI", "On SMI & AvgSMI"};

def min_low = lowest(low, percentKLength);
def max_high = highest(high, percentKLength);
def rel_diff = close - (max_high + min_low)/2;
def diff = max_high - min_low;

def avgrel = expaverage(expaverage(rel_diff, percentDLength), percentDLength);
def avgdiff = expaverage(expaverage(diff, percentDLength), percentDLength);

plot SMI = if avgdiff != 0 then avgrel / (avgdiff / 2) * 100 else 0;
smi.setDefaultColor(getColor(1));
smi.setLineWeight(2);

plot AvgSMI = expaverage(smi, percentDLength);
avgsmi.setDefaultColor(getcolor(5));
avgsmi.setLineWeight(2);

plot overbought = over_bought;
overbought.setDefaultColor(getcolor(4));

plot oversold = over_sold;
oversold.setDefaultColor(getcolor(4));

# Slow Line
input N2_Period = 21;
input R2_Period = 5;

def Ln2 = Lowest(low, N2_Period);
def Hn2 = Highest(high, N2_Period);
def Y2 = ((close - Ln2)/(Hn2 - Ln2)) * 100;
def X2 = ExpAverage(Y2, R2_period);


def Lxn = Lowest(x2, n2_period);
def Hxn = Highest(x2, n2_period);
def DSS = ((X2 - Lxn)/(Hxn - Lxn)) * 100;


def DSSb = ExpAverage(Dss, R2_period);
#DSSb.setdefaultColor(Color.GREEN);

plot DSSsignal = DSSb[1];
DSSsignal.AssignValueColor(if DSSb>DSSsignal then Color.Green else Color.Red);
DSSsignal.SetLineWeight(3);

def upSMI = SMI crosses above OverSold;
def upAvgSMI = AvgSMI crosses above OverSold;
def downSMI = SMI crosses below OverBought;
def downAvgSMI = AvgSMI crosses below OverBought;

plot UpSignal;
plot DownSignal;
switch (showBreakoutSignals) {
case "No":
    UpSignal = Double.NaN;
    DownSignal = Double.NaN;
case "On SMI":
    UpSignal = if upSMI then OverSold else Double.NaN;
    DownSignal = if downSMI then OverBought else Double.NaN;
case "On AvgSMI":
    UpSignal = if upAvgSMI then OverSold else Double.NaN;
    DownSignal = if downAvgSMI then OverBought else Double.NaN;
case "On SMI & AvgSMI":
    UpSignal = if upSMI or upAvgSMI then OverSold else Double.NaN;
    DownSignal = if downSMI or downAvgSMI then OverBought else Double.NaN;
}

UpSignal.setHiding(showBreakoutSignals == showBreakoutSignals."No");
DownSignal.setHiding(showBreakoutSignals == showBreakoutSignals."No");

OverBought.SetDefaultColor(GetColor(4));
OverSold.SetDefaultColor(GetColor(4));
UpSignal.SetDefaultColor(Color.UPTICK);
UpSignal.SetPaintingStrategy(PaintingStrategy.ARROW_UP);
UpSignal.SetLineWeight(3);
DownSignal.SetDefaultColor(Color.DOWNTICK);
DownSignal.SetPaintingStrategy(PaintingStrategy.ARROW_DOWN);
DownSignal.SetLineWeight(3);
 

Attachments

  • htDe4i2.png
    htDe4i2.png
    556.2 KB · Views: 153
This is the same as the Stochastic Momentum Index with the DSS line that you did for me previously...I like the SMI/DSS study a lot actually. I think this version has some cool features for example...I like the ZERO line and I like the RED for the OB and GREEN for the OS conditions in the study...What confuses me are the candle colors...What are they suppose to represent? The GREEN on the candlesticks does not always signify a move up and the RED does not always signify a move down?

@HighBredCloud Wow! I did not realize I was working on a derivative...Sorry about that...Not to make excuses, but I'm buried a little deep right now in code...I have to work on organizing a little more and pulling the loose ends together...

As always, thanks for the suggestions...I'll start working on the latest enhancements to the SMI/DSS now...

...are you able to add certain things from the USCGears to the SMI/DSS such as the ZERO Line and the RED and GREEN that's above the and below the ZERO Line? Perhaps even you can add on the DSS line if you really like the candle change in that study...

Yes...I'll add those...not a problem :)

Is there potentially another way to identify the RED or GREEN candles in the USCGears? Maybe with a RED or GREEN UP/DOWN arrow instead? Reason being is that if someone is already using a SuperTrend study they will not be able to use this study in confluence.

Well, I think it's a little easier to color a candle, but you bring up an excellent point regarding the users and confluence...let me see what I can do...
 
@HighBredCloud Wow! I did not realize I was working on a derivative...Sorry about that...Not to make excuses, but I'm buried a little deep right now in code...I have to work on organizing a little more and pulling the loose ends together...

As always, thanks for the suggestions...I'll start working on the latest enhancements to the SMI/DSS now...


Yes...I'll add those...not a problem :)


Well, I think it's a little easier to color a candle, but you bring up an excellent point regarding the users and confluence...let me see what I can do...
@netarchitech HAHA...its funny how you picked that same indicator as I did. That must mean that its a good indicator to implement...Great minds think alike I guess. I really don't blame you for not remembering. I catch myself naming studies with similar names even tho they are way different then take weeks to find what I did with them and or rediscovering them by accident all over again.
 
@HighBredCloud Yeah...it is funny :) Still working on all the loose ends here...When things really get going it can be hard to keep up sometimes...With that said, I have really enjoyed the opportunity to work with you...In fact, I have totally retooled my funny money layout to incorporate both PR_MAC and SMI_DSS...Thanks to your analytical prowress :cool: Needless to say but I am really looking forward to the opening bell tomorrow...

You mentioned SHOP...I've been pursuing something similar when it comes to big movers...SOXL ...the nice thing is that it is a 3X leveraged ETF :) Now that I'm armed with these new tools that you've vetted I feel more confident to take on more size and hopefully more GREEN! We shall see what we shall see when the rubber hits the road tomorrow...
@netarchitech Same here...Nothing but very good and pleasant experience working with you as well. I didn't have much luck when trading 3x leveraged ETFs...I lost a lot of money few months back on NUGT...I bought a lot of shares and it went against me even tho EVERYTHING on my charts matched up...This really forced me to take a step back and re-evaluate my trading style and what I trade.

When it comes to ETF's I was trading them on tick charts for a more precise entries and exits. Anything that had volume over 5 million I used a 610Tk as my anchor chart...I would use the 144Tk as the pull back and I would enter and exit on a 34 or 55Tk...It is virtually impossible to trade ETF's on minute charts such as a 5 minute and not experience ANY type of pain sitting in the reds sometimes until the trend changed...This was the case with NUGT...it almost had a mind of its own and was way beyond logical reasoning when it was NOT trading in a trending market.

This might be VERY different with SOXL...I never traded it but that being over $200 makes me think that its quite spready kind of like DGAZ...I have traded TVIX tho and again...when you catch a trend you're good...but I would NEVER trade TVIX with my idle hands. My biggest problem as a trader is patiently awaiting a set up to form and learning to sit on my hands until then. I keep getting into trouble trying force a trade and make something happen by taking on micro trades that often go against me. I am trying to leave my scalping days behind and move onto more of a trend is my friend take what you can type of a trader.

I don't know your style of trading so I can't say what works for you will work for me...BUT seeing how we are liking the same indicators seems that we may not be too far off. I really think that with the enhancements you made to the indicators AND if you implement a multi timeframe strategy for your trading that will be the key to success. Hope you stay GREEN tomorrow!
 
I didn't have much luck when trading 3x leveraged ETFs...

@HighBredCloud I totally understand this...there's something about the 3x Commodity ETFs...NUGT, UGAZ, UWT, for example...that lead to ruination...they seem to be on a perpetual race to zero and they just reverse split and start the process all over again...I'm sorry to hear you had the experience you did...

On the upside:
This really forced me to take a step back and re-evaluate my trading style and what I trade.

Transformation through hardship can be difficult, to say the least, but, once you're through it, you're much better off :)

...SOXL...I never traded it but that being over $200 makes me think that its quite spready kind of like DGAZ...

Yeah, there is the spread to contend with...and $10+ moves get me battling with the greed within...and the challenge keeps drawing me back...

My biggest problem as a trader is patiently awaiting a set up to form and learning to sit on my hands until then. I keep getting into trouble trying force a trade and make something happen by taking on micro trades that often go against me. I am trying to leave my scalping days behind and move onto more of a trend is my friend take what you can type of a trader.

You're singin' to the Choir again, @HighBredCloud :) I know EXACTLY what you're talking about...Getting to know yourself is the best thing you can do in trading AND in life...

Hope you stay GREEN tomorrow!

Right back at ya, @HighBredCloud! ...You know how fond us Irish are of GREEN :cool:
 
Would it be possible to create a painter based on the code I posted for the that's similar to the volatility box? I've tried to get the basic candle painting code to line up with the bottom/top arrows that appear amazingly accurate but it does change the candle colors or it changes all of them
 
Would it be possible to create a painter based on the code I posted for the that's similar to the volatility box?
@Huffmac90 Unfortunately you didn't mention what script you're referring to? If you could post a link when you have a chance, I could take a look and see if it's a possibility...at least that is with my novice thinkscripter abilities :) In the meantime, I'll take a look at the Volatility Box...
 
@Huffmac90 Unfortunately you didn't mention what script you're referring to? If you could post a link when you have a chance, I could take a look and see if it's a possibility...at least that is with my novice thinkscripter abilities :) In the meantime, I'll take a look at the Volatility Box...

It's this one! I posted it over in the VBOX forum. If the painter would just work it would be amazing! However, be cautioned that it should not be used on it's own and you should always use it will a lower indicator set.
https://onedrive.live.com/redir?res...lus th|41f44a85-ec27-4d87-8bed-8d572de0a190/)
 
Can some make this TNB Candle Identifier script multi frame, its a great indicator but I would like to use the 5 minute on the 1 minute time frame. Can this be made into MTF it would be awesome.
 

What studies are you using? Can you just share your setup?

I'm looking at average SMI and it tells me nothing outside of momentum expansion and contraction. I do like the SMI bands for divergence. And I will plop lines on to show divergence. And that seems to be a better indicator
 
Last edited:

Similar threads

Not the exact question you're looking for?

Start a new thread and receive assistance from our community.

87k+ Posts
340 Online
Create Post

Similar threads

Similar threads

The Market Trading Game Changer

Join 2,500+ subscribers inside the useThinkScript VIP Membership Club
  • Exclusive indicators
  • Proven strategies & setups
  • Private Discord community
  • ‘Buy The Dip’ signal alerts
  • Exclusive members-only content
  • Add-ons and resources
  • 1 full year of unlimited support

Frequently Asked Questions

What is useThinkScript?

useThinkScript is the #1 community of stock market investors using indicators and other tools to power their trading strategies. Traders of all skill levels use our forums to learn about scripting and indicators, help each other, and discover new ways to gain an edge in the markets.

How do I get started?

We get it. Our forum can be intimidating, if not overwhelming. With thousands of topics, tens of thousands of posts, our community has created an incredibly deep knowledge base for stock traders. No one can ever exhaust every resource provided on our site.

If you are new, or just looking for guidance, here are some helpful links to get you started.

What are the benefits of VIP Membership?
VIP members get exclusive access to these proven and tested premium indicators: Buy the Dip, Advanced Market Moves 2.0, Take Profit, and Volatility Trading Range. In addition, VIP members get access to over 50 VIP-only custom indicators, add-ons, and strategies, private VIP-only forums, private Discord channel to discuss trades and strategies in real-time, customer support, trade alerts, and much more. Learn all about VIP membership here.
How can I access the premium indicators?
To access the premium indicators, which are plug and play ready, sign up for VIP membership here.
Back
Top