
Author Message:
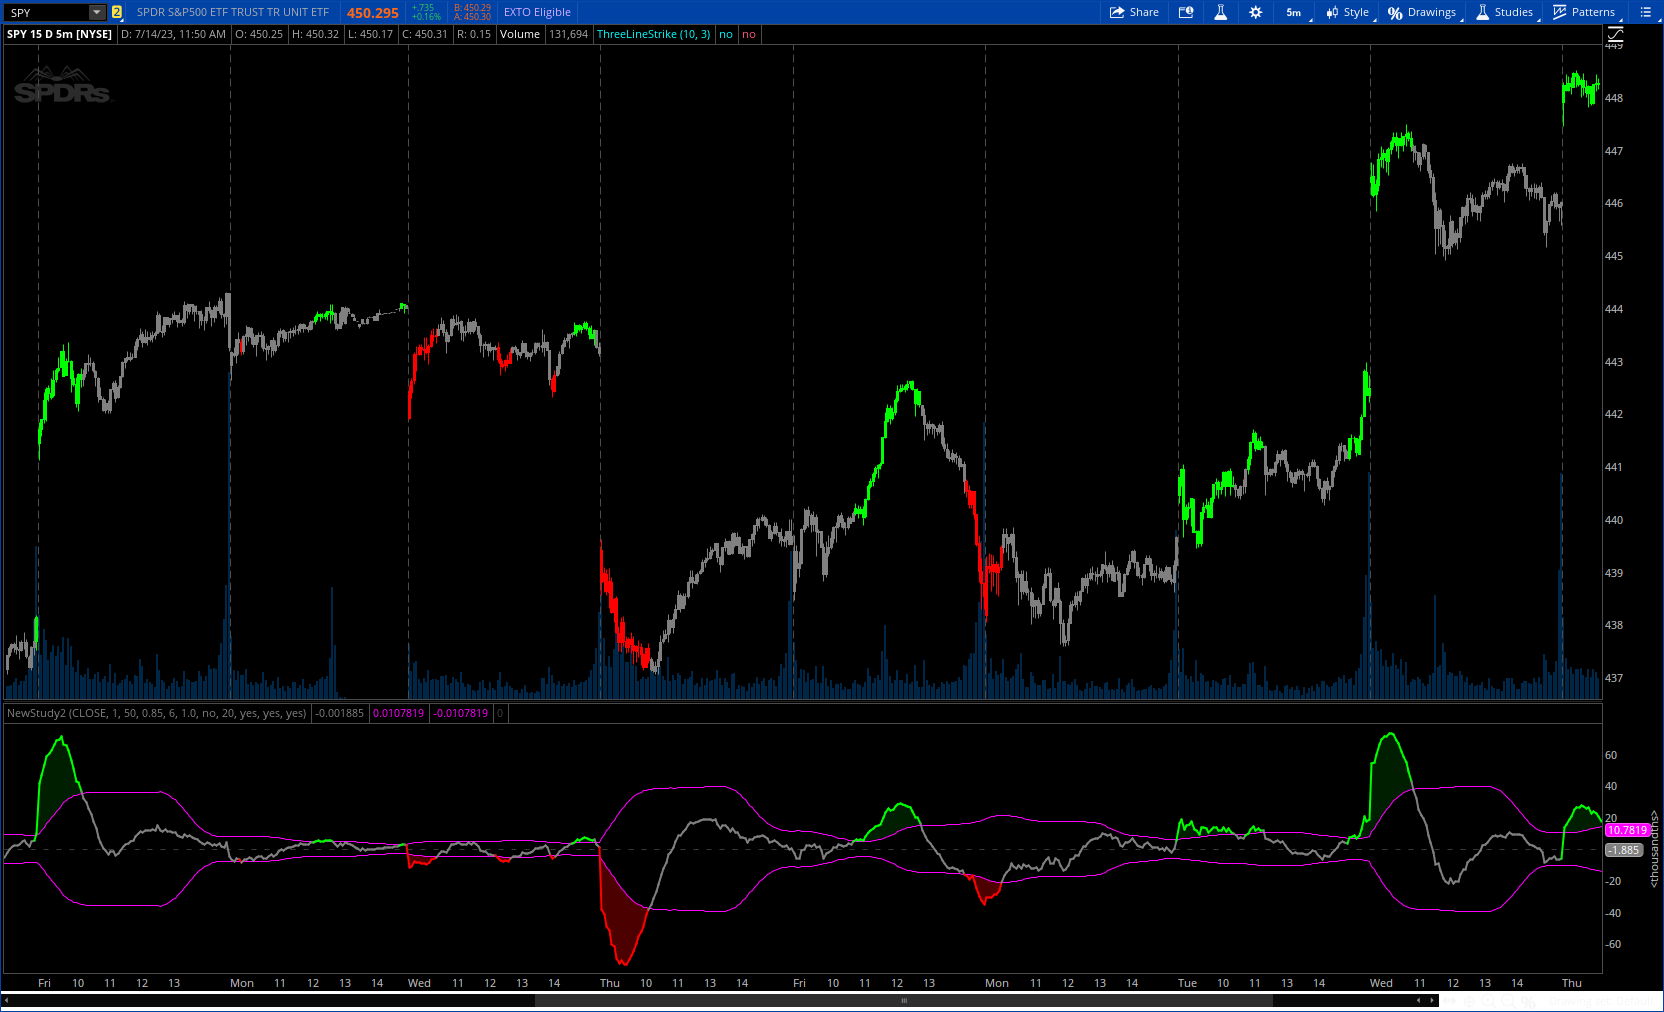
The provided code is a custom indicator called "Trendilo" in TradingView. It helps traders identify trends in price data. The indicator calculates the percentage change of the chosen price source and applies smoothing to it. Then, it calculates the Arnaud Legoux Moving Average (ALMA) of the smoothed percentage change. The ALMA is compared to a root mean square (RMS) band, which represents the expected range of the ALMA values. Based on this comparison, the indicator determines whether the trend is up, down, or sideways. The indicator line is plotted in a color corresponding to the trend direction. The indicator also provides the option to fill the area between the indicator line and the RMS band. Additionally, users can choose to color the bars of the chart based on the trend direction. Overall, the "Trendilo" indicator helps traders visually identify trends and potential reversals in the price data.
CODE:
CSS:
#https://www.tradingview.com/v/h5kMWewu/
#//@version=5
#indicator('Trendilo', overlay=false)
# Converted by Sam4Cok@Samer800    - 07/2023
declare lower;

input src = close;                  # 'Source'
input Smoothing = 1;                # 'Smoothing'
input Lookback = 50;                # 'Lookback'
input almaOffset = 0.85;            # 'ALMA Offset'
input almaSigma = 6;                # 'ALMA Sigma'
input BandMultiplier = 1.0;         # 'Band Multiplier'
input useCustomBandLength = no;     # 'Custom Band Length ? (Else same as Lookback)')
input CustomBandLength = 20;        # 'Custom Band Length'
input highlightTrendLine = yes;
input showCloud = yes;
input barColor = yes;               # 'Bar Color'

def na = Double.NaN;
def last = isNaN(close);
#pine_alma(series, windowsize, offset, sigma) =>
script ALMA {
    input series = close;
    input windowsize = 9;
    input Offset = 0.85;
    input Sigma = 6;
    def m = Offset * (windowsize - 1);
    def s = windowsize / Sigma;
    def norm  = fold z = 0 to windowsize with CW do
         CW + Exp(-(Sqr(z - m)) / (2 * Sqr(s)));
    def sum  = fold y = 0 to windowsize with WS do
         WS + Exp(-(Sqr(y - m)) / (2 * Sqr(s))) * GetValue(series, windowsize - 1 - y);
    plot ALMA = sum  / norm ;
}
def change = src - src[Smoothing];
def pch = change / src * 100;
def avpch = alma(pch, Lookback, almaOffset, almaSigma);
def blength = if useCustomBandLength then CustomBandLength else Lookback;
def rms = BandMultiplier * Sqrt(Sum(avpch * avpch, blength) / blength);
def cdir = if avpch > rms then 1 else if avpch < -rms then -1 else 0;

#-- plot
plot fplot = avpch;
plot posrms = rms;
plot negrms = -rms;

fplot.SetLineWeight(2);
fplot.AssignValueColor(if !highlightTrendLine then Color.CYAN else
                       if cdir>0 then Color.GREEN else
                       if cdir<0 then Color.RED else Color.GRAY);
posrms.SetDefaultColor(Color.MAGENTA);
negrms.SetDefaultColor(Color.MAGENTA);

AddCloud(if showCloud and cdir > 0 then fplot else na, posrms, Color.DARK_GREEN);
AddCloud(if showCloud and cdir < 0 then fplot else na, negrms, Color.DARK_RED);

AssignPriceColor(if !barColor then Color.CURRENT else
                       if cdir>0 then Color.GREEN else
                       if cdir<0 then Color.RED else Color.GRAY);
plot zero = if last then na else 0;
zero.SetDefaultColor(Color.DARK_GRAY);
zero.SetStyle(Curve.SHORT_DASH);
#-- END OF CODE