Repaints Trend Magic Indicator For ThinkOrSwim

Repaints

tenacity11

Active member
2019 Donor
Plus
MTF Trend Magic is a technical tool that combines the Commodity Channel Index (CCI) and the Average True Range (ATR) that identifies market trends.

The Trend Magic indicator is an ATR-based trend line that uses CCI to control its upward and downward movement.
Trend magic is a repainting version of the Supertrend indicator.
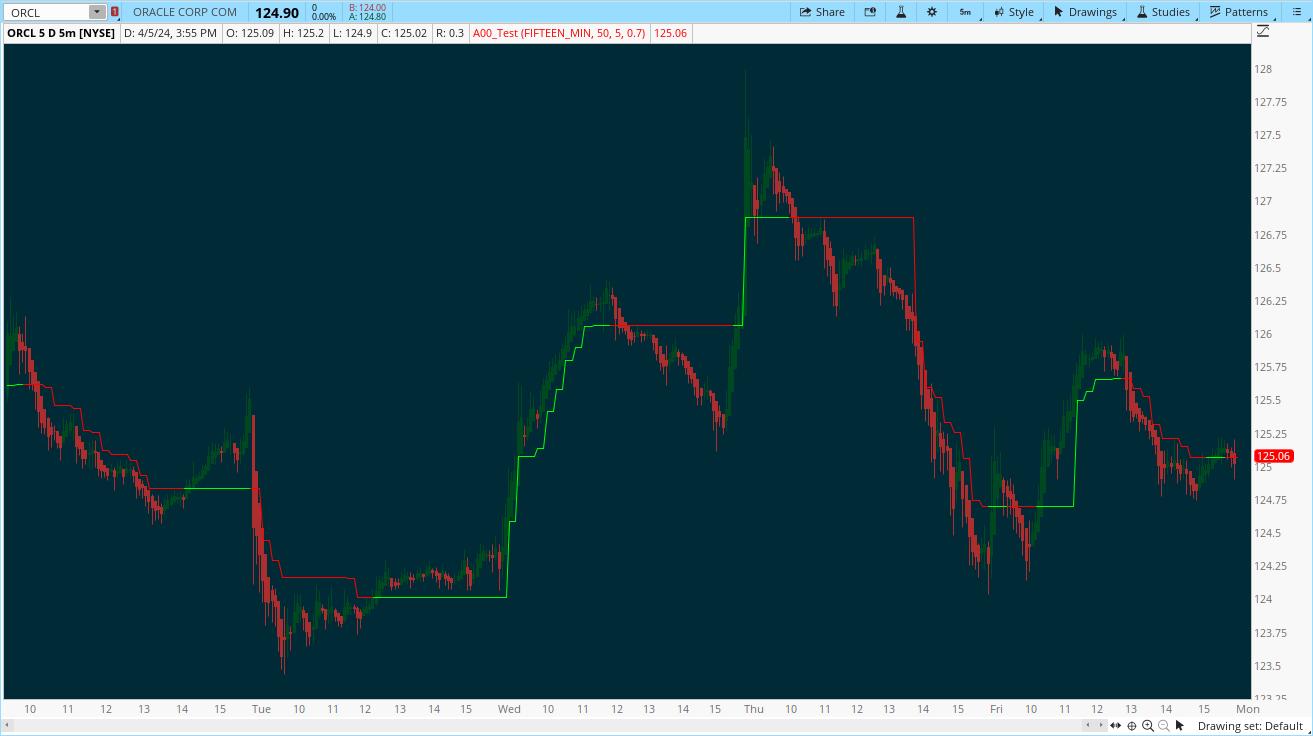
n2Vb9mX.png


Can anyone convert this to TOS for me.
 
Last edited by a moderator:
Here is the code:

Code:
# MTF Trend Magic
# horseride 7/3/2019

input agg = AggregationPeriod.FIFTEEN_MIN;
def c = close(period = agg);
def h = high(period = agg);
def l = low(period = agg);
def pricedata = hl2(period = agg);

DefineGlobalColor("TrendUp", CreateColor(0, 254, 30));
DefineGlobalColor("TrendDown", CreateColor(255, 3, 2));


input lengthCCI = 50;
input lengthATR = 5;
input AtrFactor = 0.7;

def ATRcci = Average(TrueRange(h, c, l), lengthATR) * AtrFactor;
def price = c + l + h;
def linDev = LinDev(price, lengthCCI);
def CCI = if linDev == 0
          then 0
          else (price - Average(price, lengthCCI)) / linDev / 0.015;
def MT1 = if CCI > 0
          then Max(MT1[1], pricedata - ATRcci)
          else Min(MT1[1], pricedata + ATRcci);
plot data = MT1;
data.AssignValueColor(if c < MT1 then Color.RED else Color.GREEN);
 
Last edited by a moderator:
Once again thanks so much. Looks good and I made one for the daily chart. I greatly appreciate the time you've taken to help me.
 
Welcome Tenacity and San. Hope it helps with your trading. If you develop a great strategy will appreciate your sharing it back.
 
@tenacity11 and BenTen team, Just i want to share my thought... I am very comfort using all these indicator in Offline i mean After the market time end , but during the market hours 9.30EST- 4PM EST, I am really scared, even if i stick with the strategy/ Instruction/Rule I experience lot of fail trade.. I don't know how to come out these situation.. BUT still i am trying to finding which strategy may fit for me during market hours.

I would like to say one thing.. This forum its give me a hope that i will definitely find a good strategy in one day.... !!!! Because in this forum i see lot of open heart people and helping tendency people... ...
 
@San You're definitely not alone. It's good that you're going through these indicators and backtesting them. But that does not mean you can't paper trade them during trading hours. I would suggest using the ThinkorSwim paper trade account and practice so you get confident with the strategy that you picked (you can even paper trade by jogging down the share price or contract price as if you're actually buying them). If it doesn't turn out like you expected, then you know to move on then and not lose a single dime.

And also be patient when paper trading. Nothing will yield you 100% winning rate. Just because the first trade didn't work out doesn't the mean indicator or strategy isn't working. Give it some time. The good thing about paper trading is that you're flexible with what you test (have fun with all the strategies and indicators that you think may fit your needs). I hope that helps.
 
Code:
#Trend Magic Indicator

#Revised with Auto Aggregation and Global Colors

#Originally posted by horserider


def agg = getAggregationPeriod();

def c = close(period = agg);

def h = high(period = agg);

def l = low(period = agg);

def pricedata = hl2(period = agg);

DefineGlobalColor("TrendUp", CreateColor(0, 254, 30));

DefineGlobalColor("TrendDown", CreateColor(255, 3, 2));

input lengthCCI = 50;

input lengthATR = 5;

input AtrFactor = 0.7;

def ATRcci = Average(TrueRange(h, c, l), lengthATR) * AtrFactor;

def price = c + l + h;

def linDev = LinDev(price, lengthCCI);

def CCI = if linDev == 0

then 0

else (price - Average(price, lengthCCI)) / linDev / 0.015;

def MT1 = if CCI > 0

then Max(MT1[1], pricedata - ATRcci)

else Min(MT1[1], pricedata + ATRcci);

plot data = MT1;

data.AssignValueColor(if c < MT1 then GlobalColor("TrendDown") else GlobalColor("TrendUp"));
 
@Lukhy11 Thanks. Makes it simple for those that do not wish to worry about changing aggregation if they change chart time.
The advantage of being able to change aggregation is you can see the study at 10 min aggregation on a 5 minute chart. Or whatever combination that will still allow it to chart. I am now testing using a 5 minute chart with two of the studies, one at 5 minute agg and one at 15 min agg. Take a look and see if it shows you anything.
 
Hi All @tenacity11 just wondering is the magic trend indicator working and can you share the code like the indicator in the picture you posted. I would appreciate it Thanks!
 
Here's the code. I'm still following but so far it looks good.

Code:
#Trend Magic Indicator
#Revised with Auto Aggregation and Global Colors
#Originally posted by horserider

def agg = getAggregationPeriod();
def c = close(period = agg);
def h = high(period = agg);
def l = low(period = agg);
def pricedata = hl2(period = agg);
DefineGlobalColor("TrendUp", CreateColor(0, 254, 30));
DefineGlobalColor("TrendDown", CreateColor(255, 3, 2));
input lengthCCI = 50;
input lengthATR = 5;
input AtrFactor = 0.7;
def ATRcci = Average(TrueRange(h, c, l), lengthATR) * AtrFactor;
def price = c + l + h;
def linDev = LinDev(price, lengthCCI);
def CCI = if linDev == 0
then 0
else (price - Average(price, lengthCCI)) / linDev / 0.015;
def MT1 = if CCI > 0
then Max(MT1[1], pricedata - ATRcci)
else Min(MT1[1], pricedata + ATRcci);
plot data = MT1;
data.AssignValueColor(if c < MT1 then GlobalColor("TrendDown") else GlobalColor("TrendUp"));
 
Shouldn't this script be able to function on Tick charts as well with the "getAggregationPeriod" function? I can't get this bad boy to plot on the desktop platform. It plots perfectly on the Mobile App tick charts.
 
Last edited:
I have been trying this is on daily chart. The lines are too close to the price where it creates many false signals. Is default settings work or any change in ATR or CCI or ATR Factor more reliable ?
 
I have been trying this is on daily chart. The lines are too close to the price where it creates many false signals. Is default settings work or any change in ATR or CCI or ATR Factor more reliable ?

Just use one instance of the Trend Magic on the DAILY chart...Use these settings 20 4 0.7
 
Getting better.. but still some false signals
The signal will generate once the price action on the candles crosses above or below the Trend Magic...unless it pulls back then how is it a false signal on the DAILY chart? Its not different than any other indicator once it meets the criteria...I would suggest into checking if this indicator does any better on a daily chart...but from my experience both of these should hit fast...the RSI might be faster...it all depends...

https://usethinkscript.com/threads/moving-average-crossover-rsi-indicator-for-thinkorswim.185/
 
  • Like
Reactions: RBO
@horserider In the code on the CCI part, shouldn't the price be h+l+c divided by 3 instead of just h+l+c? It looks a little unusual not to take the average of those in CCI. CCI usually uses the closing price and hlc3 but this code uses h+l+c, is that how it should be?
 
@SparkyFlary ToS CCI

def price = close + low + high;
def linDev = lindev(price, length);
plot CCI = if linDev == 0 then 0 else (price - Average(price, length)) / linDev / 0.015;

That is how ToS has it, what I went by. Is that how it should be? Do not know. I have seen the formula you mention but have not seen it used in any ToS codes even custom ones. If you have evidence of it being incorrect, please present it.
 

Join useThinkScript to post your question to a community of 21,000+ developers and traders.

Similar threads

Not the exact question you're looking for?

Start a new thread and receive assistance from our community.

87k+ Posts
293 Online
Create Post

Similar threads

Similar threads

The Market Trading Game Changer

Join 2,500+ subscribers inside the useThinkScript VIP Membership Club
  • Exclusive indicators
  • Proven strategies & setups
  • Private Discord community
  • ‘Buy The Dip’ signal alerts
  • Exclusive members-only content
  • Add-ons and resources
  • 1 full year of unlimited support

Frequently Asked Questions

What is useThinkScript?

useThinkScript is the #1 community of stock market investors using indicators and other tools to power their trading strategies. Traders of all skill levels use our forums to learn about scripting and indicators, help each other, and discover new ways to gain an edge in the markets.

How do I get started?

We get it. Our forum can be intimidating, if not overwhelming. With thousands of topics, tens of thousands of posts, our community has created an incredibly deep knowledge base for stock traders. No one can ever exhaust every resource provided on our site.

If you are new, or just looking for guidance, here are some helpful links to get you started.

What are the benefits of VIP Membership?
VIP members get exclusive access to these proven and tested premium indicators: Buy the Dip, Advanced Market Moves 2.0, Take Profit, and Volatility Trading Range. In addition, VIP members get access to over 50 VIP-only custom indicators, add-ons, and strategies, private VIP-only forums, private Discord channel to discuss trades and strategies in real-time, customer support, trade alerts, and much more. Learn all about VIP membership here.
How can I access the premium indicators?
To access the premium indicators, which are plug and play ready, sign up for VIP membership here.
Back
Top