
Author Message:
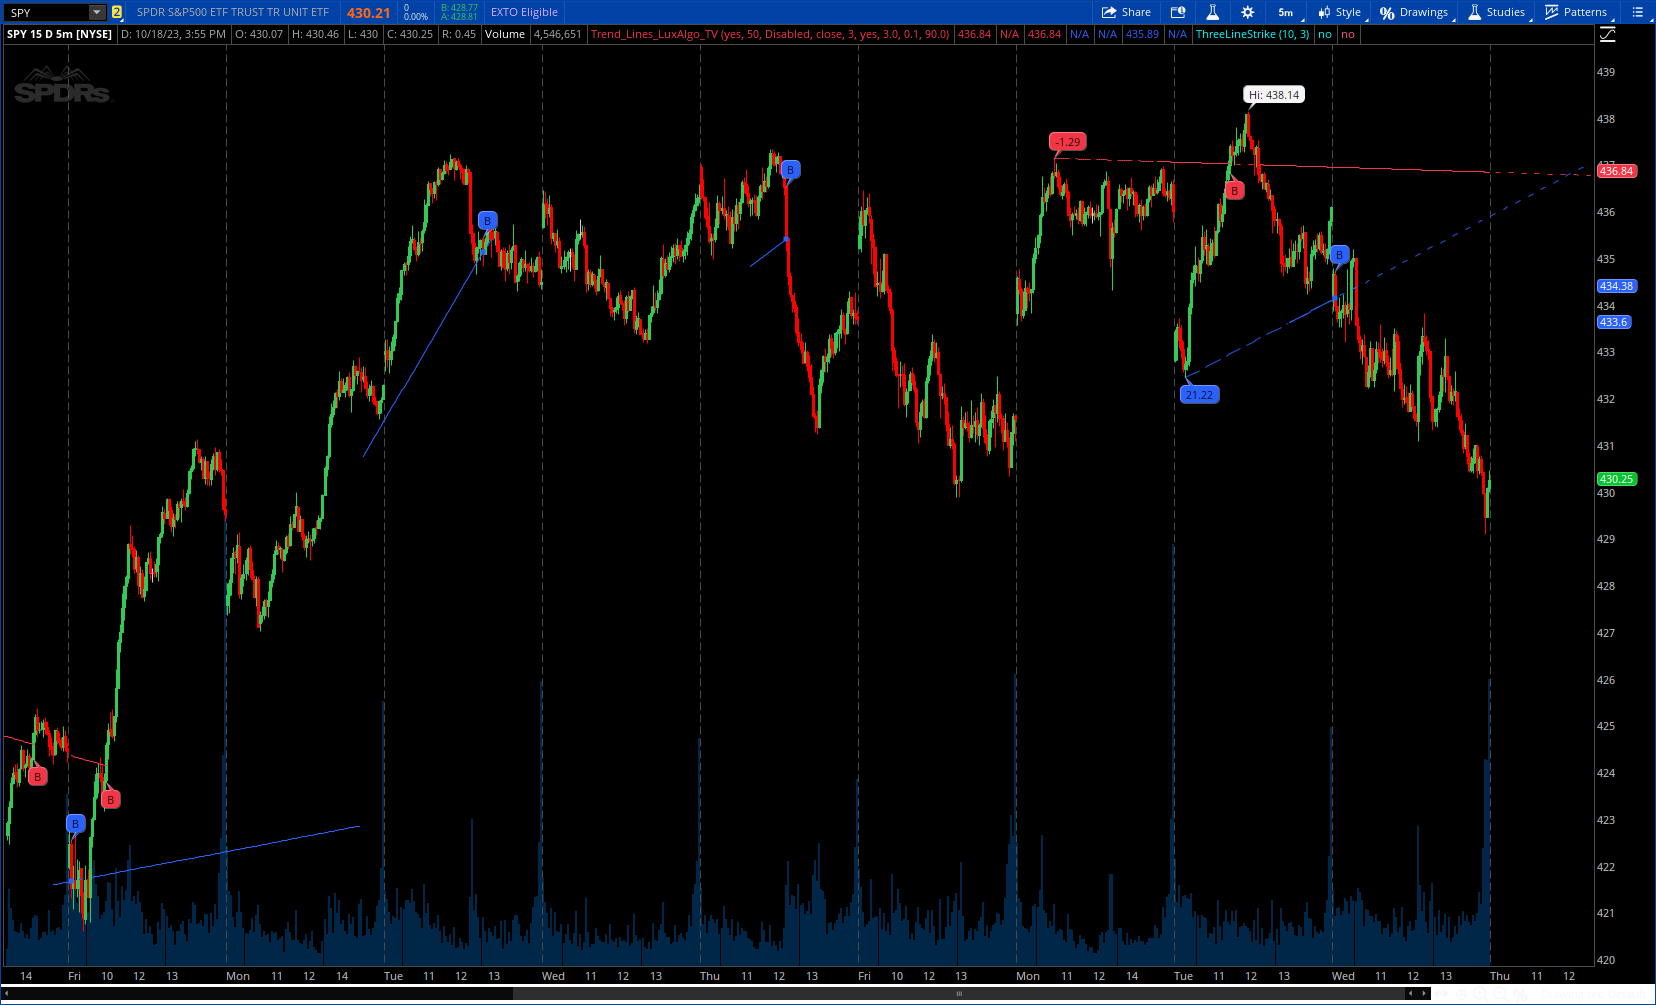
"Trend Lines" indicator detects and highlights relevant trendlines on the user chart while keeping it free of as much clutter as possible.
The indicator is thought for real-time usage and includes several filters as well as the ability to estimate trendline angles.
More Details: https://www.tradingview.com/v/vE8YNVgM/
CODE:
CSS:
# https://www.tradingview.com/v/vE8YNVgM/
#/ This work is licensed under a Attribution-NonCommercial-ShareAlike 4.0 International (CC BY-NC-SA 4.0) https:
#// © LuxAlgo
#indicator("Trend Lines [LuxAlgo]", shorttitle= "LuxAlgo - Trend Lines", max_lines_count = 500, max
# converted by Sam4Cok@Samer800    - 10 / 2023 - Not Exact results
#//Settings

input extendLastLines = yes;
input lookback = 50;# "Swings"
input CheckBreaksBetween = {default "Disabled", "Point A - Point B", "Point A - Current bar"};# 'Check breaks
input sourceForBreaks = {default "close", "High/Low"}; # 'source (breaks)'
input MinimalBreakBars  = 3;            # 'Minimal bars'
input showAngles  = yes;                # 'show Angles'
input RatioXYAxis  = 3.0;               # 'Ratio X-Y axis'
input TrendlinesMinAngle = 0.1;         # 'Only Trendlines between:'
input TrendlinesMaxAngle = 90.0;        # "Angles"

def na = Double.NaN;
def last = isNaN(close);
def NN = CheckBreaksBetween == CheckBreaksBetween."Disabled";
def AB = CheckBreaksBetween == CheckBreaksBetween."Point A - Point B";
def AC = CheckBreaksBetween == CheckBreaksBetween."Point A - Current bar";

DefineGlobalColor("upCss", CreateColor(41, 98, 255));
DefineGlobalColor("dnCss", CreateColor(242, 54, 69));

#/Function
script calculate_slope {
    input x1 = 1;
    input x2 = 1;
    input y1 = 1;
    input y2 = 1;
    input Yaxis = 1;
    input height = 1;
    def pi = Double.Pi;
    def diffX = x2 - x1;
    def diffY = y2 - y1;
    def diffY_to_Yaxis   =  Yaxis  / diffY;
    def normalised_slope = (height / diffY_to_Yaxis) / diffX;
    def slope            = diffY  / diffX;
    def angle = ATan(normalised_slope) * 180 / pi;
    plot slp = if IsNaN(slope) then 0 else slope;
    plot ang = if IsNaN(angle) then 0 else Round(angle, 2);
}
script FindPivots {
    input dat = close; # default data or study being evaluated
    input HL  = 0;    # default high or low pivot designation, -1 low, +1 high
    input lbL  = 5;    # default Pivot Lookback Left
    input lbR  = 1;    # default Pivot Lookback Right
    ##############
    def _nan;    # used for non-number returns
    def _BN;     # the current barnumber
    def _VStop;  # confirms that the lookforward period continues the pivot trend
    def _V;      # the Value at the actual pivot point
    def _pivotRange;
    ##############
    _BN  = BarNumber();
    _nan = Double.NaN;
    _pivotRange = lbL + lbL;
    _VStop = if !IsNaN(dat[_pivotRange]) and lbR > 0 and lbL > 0 then
                fold a = 1 to lbR + 1 with b=1 while b do
                    if HL > 0 then dat > GetValue(dat, -a) else dat < GetValue(dat, -a) else _nan;
    if (HL > 0) {
        _V = if _BN > lbL and dat == Highest(dat, lbL + 1) and _VStop
            then dat else _nan;
    } else {
        _V = if _BN > lbL and dat == Lowest(dat, lbL + 1) and _VStop
            then dat else _nan;
    }
    plot result = if !IsNaN(_V) and _VStop then _V else _nan;
}

#//Calculations
def n     = AbsValue(BarNumber());
def ph    = findpivots(high, 1, lookback, lookback);
def pl    = findpivots(low, -1, lookback, lookback);
def nanPh = !isNaN(ph[lookback]);
def nanPl = !isNaN(pl[lookback]);
def bars  = 500;
def height = bars / RatioXYAxis;
def Xaxis = min(max(1, n), bars);
def hh = fold i1=0 to Xaxis with p1 = high do
         max(p1, GetValue(high, i1));
def ll = fold j1=0 to Xaxis with q1 = low do
         min(q1, GetValue(low, j1));
def Yaxis = hh - ll;

#/Execution --Bull - red
def labelH;
def slopeH;
def angleH;
def srcH;
def brokenH;
def LineH;
def phslope;
def upper;
def srcBl_ = if sourceForBreaks == sourceForBreaks."close" then close else high;
def srcBl = srcBl_;
def phy   = if nanPh then ph[lookback] else phy[1];
def phy1  = if phy-phy[1] then phy[1] else phy1[1];
def phx   = if nanPh then n - lookback else phx[1];
def phx1  = if phx-phx[1] then phx[1] else phx1[1];
def loopH  = n - phx1;
def loopPh = if loopH > 1000 then 1000 else loopH;
def slpH = calculate_slope(phx1, n - lookback, phy1, ph[lookback], Yaxis, height).slp;
def angH = calculate_slope(phx1, n - lookback, phy1, ph[lookback], Yaxis, height).ang;

if nanPh {
    if ph[lookback] < phy1 {
        slopeH = slpH;
        angleH = angH;
        LineH  = phy1 + slopeH * lookback;
        srcH   = srcBl[lookback];
        if AbsValue(angleH) > TrendlinesMinAngle and AbsValue(angleH) < TrendlinesMaxAngle {
            brokenH = if !NN then
             fold i = (if AB then lookback else 0) to loopPh with p=1 while p do
                      GetValue(srcH, i) > GetValue(LineH,n - i) else no;
            phslope = if !brokenH then slopeH else phslope[1];
            upper   = if !brokenH then ph[lookback] + slopeH * lookback else upper[1];
            labelH  = if !brokenH then angleH else na;
        } else {
            brokenH = no;
            phslope = phslope[1];
            upper   = upper[1];
            labelH  = na;
        }
    } else {
        brokenH = brokenH[1];
        phslope = phslope[1];
        upper   = upper[1];
        labelH  = na;
        slopeH  = slopeH[1];
        angleH  = angleH[1];
        LineH   = LineH[1];
        srcH    = srcH[1];
    }
} else {
    brokenH = brokenH[1];
    phslope = phslope[1];
    upper   = upper[1] + phslope;
    labelH  = na;
    slopeH  = slopeH[1];
    angleH  = angleH[1];
    LineH   = LineH[1] + phslope;
    srcH    = srcH[1];
}
def diffH = if NN then (phslope - phslope[1]) else (slopeH - slopeH[1]);
def upVal = if NN then upper else lineH;
def plotH = if nanPh and diffH then na else
            if srcBl[1] > upVal[1] then na else upVal;
def bs_H  = if isNaN(plotH) then 0 else bs_H[1] + 1;
def bullBreak = bs_H > MinimalBreakBars and srcBl > upVal and srcBl[1] <= upVal[1];

plot DnTrendline = if plotH > hh or plotH < ll then na else
                   if plotH then plotH else na;
DnTrendline.SetDefaultColor(GlobalColor("dnCss"));

def ph_1 = if !isNaN(ph) then ph else ph_1[1];
def lh   = if ph_1 < ph_1[1] then ph_1 else lh[1];
def startH = if lh - lh[1] then n else startH[1];
def upExtendBar = if diffH then n else upExtendBar[1];
def hstartH = highestAll(startH);
def hupExtendBar = highestAll(upExtendBar);
def upExtndCond  = if n == hstartH then high else
                   if n == hupExtendBar then upVal else na;
def highLab = if !isNaN(labelH) then labelH else highLab[1];

plot upExtndLine = if upExtndCond then upExtndCond else na;
upExtndLine.EnableApproximation();
upExtndLine.SetDefaultColor(GlobalColor("dnCss"));
upExtndLine.SetStyle(Curve.MEDIUM_DASH);

plot extndUp = if extendLastLines and n > hupExtendBar then upVal else na;
extndUp.SetDefaultColor(GlobalColor("dnCss"));
extndUp.SetStyle(Curve.SHORT_DASH);

AddChartBubble(bullBreak, low, "B", GlobalColor("dnCss"), no);
AddChartBubble(showAngles and n == hstartH, high, highLab[-lookback], GlobalColor("dnCss"));

#/Execution --Bear - blue
def labelL;
def slopeL;
def angleL;
def srcL;
def brokenL;
def LineL;
def plslope;
def lower;
def srcBr_ = if sourceForBreaks == sourceForBreaks."close" then close else low;
def srcBr = srcBr_;
def ply   = if nanPl then pl[lookback] else ply[1];
def ply1  = if ply-ply[1] then ply[1] else ply1[1];
def plx   = if nanPl then n - lookback else plx[1];
def plx1  = if plx-plx[1] then plx[1] else plx1[1];
def loopL  = n - plx1;
def loopPl = if loopL > 1000 then 1000 else loopL;
def slpL = calculate_slope(plx1, n- lookback, ply1, pl[lookback], Yaxis, height).slp;
def angL = calculate_slope(plx1, n- lookback, ply1, pl[lookback], Yaxis, height).ang;

if nanPl {
    if pl[lookback] > ply1 {
        slopeL = slpL;
        angleL = angL;
        LineL  = ply1 + slopeL * lookback;
        srcL   = srcBr[lookback];
        if (angleL) > TrendlinesMinAngle and (angleL) < TrendlinesMaxAngle {
            brokenL = if !NN then
             fold j = (if AB then lookback else 0) to loopPl with q=1 while q do
                       GetValue(srcL, j) < GetValue(LineL,n - j) else no;
            plslope = if !brokenL then slopeL else plslope[1];
            lower   = if !brokenL then pl[lookback] + slopeL * lookback else lower[1];
            labelL  = if !brokenL then angleL else na;
        } else {
            brokenL = no;#brokenL[1];
            plslope = plslope[1];
            lower   = lower[1];
            labelL  = na;
        }
    } else {
        brokenL = brokenL[1];
        plslope = plslope[1];
        lower   = lower[1];
        labelL  = na;
        slopeL  = slopeL[1];
        angleL  = angleL[1];
        LineL   = LineL[1];
        srcL    = srcL[1];
    }
} else {
    brokenL = brokenL[1];
    plslope = plslope[1];
    lower   = lower[1] + plslope;
    labelL  = na;
    slopeL  = slopeL[1];
    angleL  = angleL[1];
    LineL   = LineL[1] + plslope;
    srcL    = srcL[1];
}
def diffL = if NN then (plslope - plslope[1]) else (slopeL - slopeL[1]);
def dnVal = if NN then lower else lineL;
def plotL = if nanPl and diffL then na else
            if srcBr[1] < dnVal[1] then na else dnVal;
def bs_L  = if isNaN(plotL) then 0 else bs_L[1] + 1;
def BearBreak = bs_L > MinimalBreakBars and srcBr < dnVal and srcBr[1] >= dnVal[1];

plot UpTrendline = if plotL > hh or plotL < ll then na else
                   if plotL then plotL else na;
UpTrendline.SetDefaultColor(GlobalColor("upCss"));

def pl_1 = if !isNaN(pl) then pl else pl_1[1];
def hl   = if pl_1 > pl_1[1] then pl_1 else hl[1];
def startL = if hl-hl[1] then n else startL[1];
def dnExtendBar = if diffL then n else dnExtendBar[1];
def hstartL =  highestAll(startL);
def hdnExtendBar = highestAll(dnExtendBar);
def dnExtndCond  = if n == hstartL then low else
                   if n == hdnExtendBar then dnVal else na;
def lowLab = if !isNaN(labelL) then labelL else lowLab[1];

plot dnExtndLine = if dnExtndCond then dnExtndCond else na;
dnExtndLine.EnableApproximation();
dnExtndLine.SetDefaultColor(GlobalColor("upCss"));
dnExtndLine.SetStyle(Curve.MEDIUM_DASH);

plot extndDn = if extendLastLines and n > hdnExtendBar then dnVal else na;
extndDn.SetDefaultColor(GlobalColor("upCss"));
extndDn.SetStyle(Curve.SHORT_DASH);

plot sBreak = if BearBreak then plotL else na;
sBreak.SetPaintingStrategy(PaintingStrategy.SQUARES);
sBreak.SetLineWeight(2);
sBreak.SetDefaultColor(GlobalColor("upCss"));

AddChartBubble(BearBreak, high, "B", GlobalColor("upCss"));
AddChartBubble(showAngles and n == hstartL, low, lowLab[-lookback], GlobalColor("upCss"), no);

#-- ENF of CODE