
I came across these indicators by accident the other day. The guy who made them goes by Richard The Red on Twitter & frequently updates his scripts. I've seen others post somewhat similar indicators on this forum, but his are also somewhat different & definitely unique. Go look for yourself. Here is the link to his open source scripts that he shares for free:
https://docs.google.com/document/d/1WwH1oKD3bzSCD9n0JPamvUS9pKW1UHm9XuVSQc6eU8o/edit?pli=1
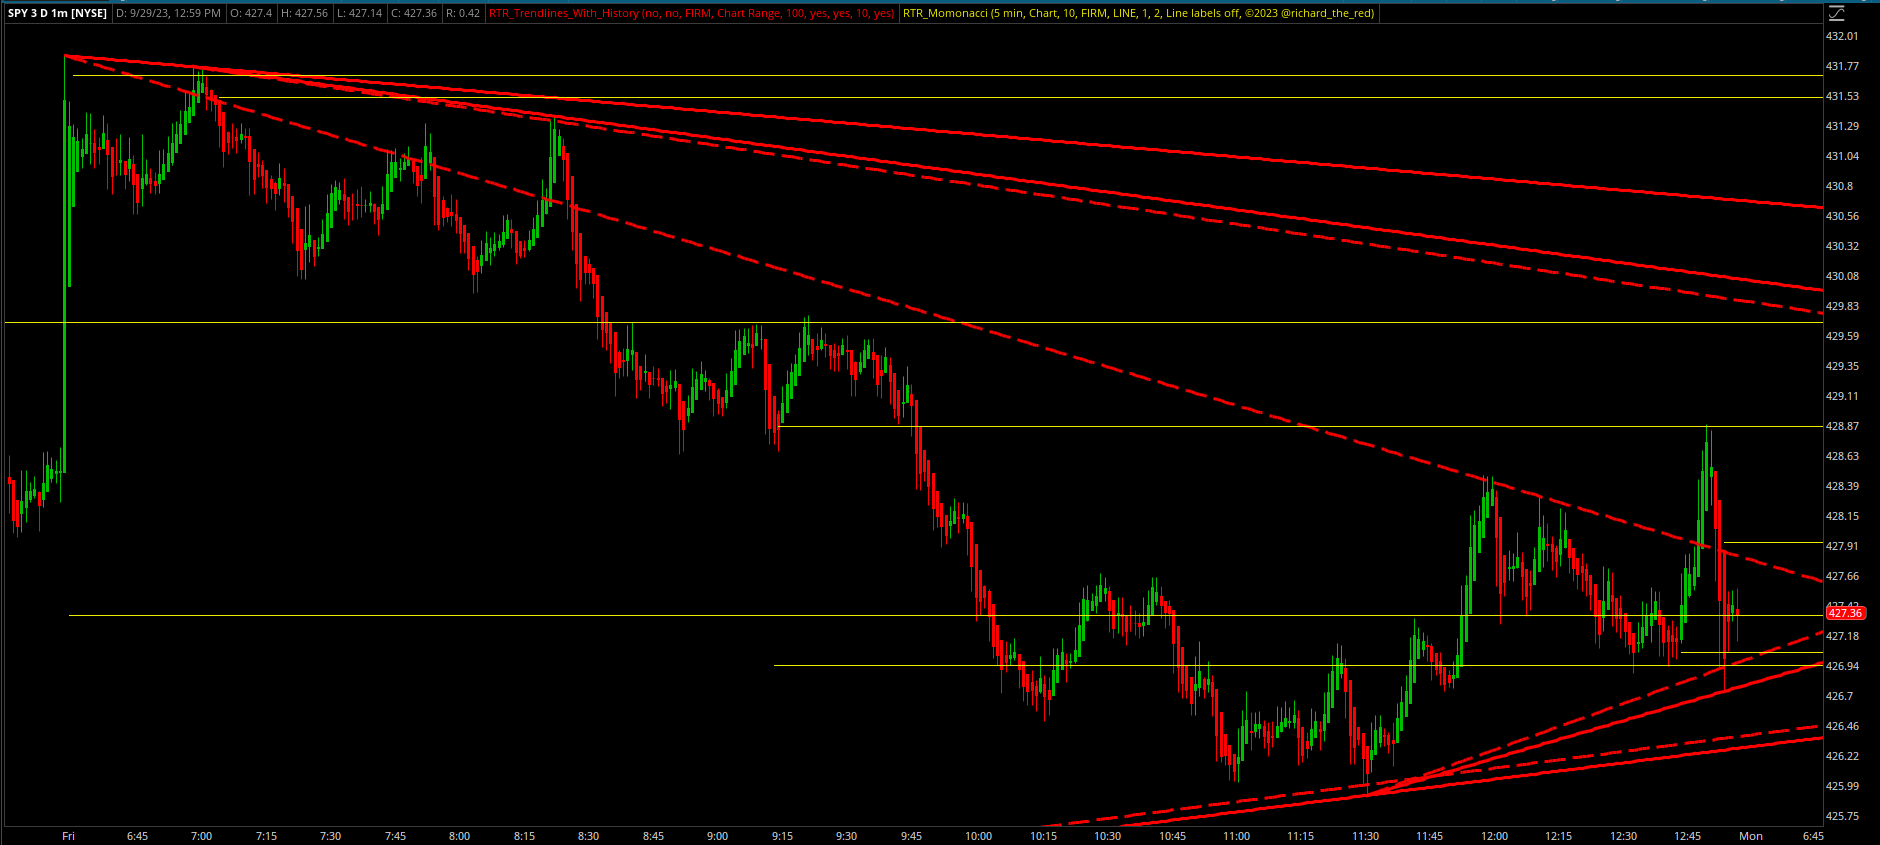
I mostly trade 0DTE options for SPY, so I can't really speak for using the indicators on timeframes above 1 or 5 minutes. As of now, I have only used the Auto Trend Lines indicator (red) & Momonacci (God Mode Levels, yellow) as shown in the image. Some of his other indicators include auto fibs, candle overlay, psych levels, range, fractals, supply/demand & a couple more. I'm not in a position to answer any questions, just posting my findings. Richard provides the descriptions, Youtube examples, & the ToS share links in the Google doc. Last thing I will say is if you end up using the Auto Trend Lines, you will notice my image displays fewer lines. It's because I selected only a couple in the settings & not all as there were too many lines and made the chart too crowded for me.
https://docs.google.com/document/d/1WwH1oKD3bzSCD9n0JPamvUS9pKW1UHm9XuVSQc6eU8o/edit?pli=1
I mostly trade 0DTE options for SPY, so I can't really speak for using the indicators on timeframes above 1 or 5 minutes. As of now, I have only used the Auto Trend Lines indicator (red) & Momonacci (God Mode Levels, yellow) as shown in the image. Some of his other indicators include auto fibs, candle overlay, psych levels, range, fractals, supply/demand & a couple more. I'm not in a position to answer any questions, just posting my findings. Richard provides the descriptions, Youtube examples, & the ToS share links in the Google doc. Last thing I will say is if you end up using the Auto Trend Lines, you will notice my image displays fewer lines. It's because I selected only a couple in the settings & not all as there were too many lines and made the chart too crowded for me.
# richard_the_red_trendlines
#hint: Draw automatic trendlines from peak to peak and/or low to low so you can see when trend breaks happen. optionally show just upper or lower tls; show the points used; use body instead of wick; use alerts; change the line styles; and set the range to use for lookback distance
declare once_per_bar; # reduces computation time
def show_highs = yes; #hint show_highs: Show upper trendlines from peak to peak
def show_lows = yes; #hint show_lows: Show lower trendlines from trough to trough
def show_points = no; #hint show_points: show which bars are used to calculate the lines with a dot
input use_body_instead_of_wick = no; #hint use_body_instead_of_wick: Some people just want to watch the world burn
def show_first_bar_trend = no; #hint show_first_bar_trend: This is a neat feature that sometimes works amazingly and others is just chart clutter. It draws a line from the highest high or lowest low and the next bar; often if this trend is respected a little it gets respected a lot, and sometimes a ridiculous number of bars later.
def use_last_bar = no; #hint use_last_bar: Whether to ignore the current bar or not
input use_alert = no; #hint use_alert: Do a sound when the trendlines break
input line_style = Curve.FIRM; #hint line_style: Set all the line styles at once instead of plot-by-plot
input use_range = {default "Chart Range", "Days", "Bars"}; #hint use_range: Use the current chart range, a set number of days, or a set number of bars
input range = 100; #hint range: If you picked "Days" or "Bars" for use_range above, this is the value it will use for those
input show_historical_igniter_trendlines = yes; #hint show_historical_igniter_trendlines: show previously broken trendlines to huge candles
#input igniter_size = 8; #hint igniter_size: the number of previous candles to judge against
def historical_line_igniter_style = curve.SHORT_DASH; #hint historical_line_igniter_style: Set all the historical line styles at once instead of plot-by-plot
input show_historical_peak_trendlines = yes; #hint show_historical_peak_trendlines: show previously broken (but still useful) trendlines to the most recent peak
input historical_peak_range = 10; #hint historical_peak_range: how many candles before and after this peak must be greater than
def historical_line_peak_style = curve.MEDIUM_DASH; #hint historical_line_peak_style: Set all the historical line styles at once instead of plot-by-plot
input show_historical_long_trendlines = yes; #hint show_historical_long_trendlines: show previously broken (but still useful) trendlines that are the longest
def historical_line_long_style = curve.LONG_DASH; #hint historical_line_long_style: Set all the historical line styles at once instead of plot-by-plot
def debug = no;
#def use_absolute_scale = no; # Lower scales are always more accurate so why do this at all? Maybe someday I'll find a use for it.
#def absolute_scale = aggregationPeriod.DAY;
#def scale = if use_absolute_scale then absolute_scale else getaggregationPeriod();
#def ao = if use_absolute_scale then open(period=absolute_scale) else open;
#def al = if use_absolute_scale then low(period=absolute_scale) else low;
#def ah = if use_absolute_scale then high(period=absolute_scale) else high;
#def ac = if use_absolute_scale then close(period=absolute_scale) else close;
def ao = open;
def al = low;
def ah = high;
def ac = close;
def h = If (use_body_instead_of_wick, Max(ao, ac), ah);
def l = If (use_body_instead_of_wick, Min(ao, ac), al);
def c = ac;
def o = ao;
def nan = Double.NaN;
def bn = BarNumber();
def islast = IsNaN(close[-1]) && !IsNaN(close);
def lastbn = HighestAll(If(islast, bn, nan));
def lastbnoffset = -lastbn + bn;
def lastbncheck = bn < lastbn + If (use_last_bar, 1, 0);
def ignore_last_bar = If (use_last_bar, yes, bn < lastbn);
def chart_scale = GetAggregationPeriod() / 1000 / 60; # minutes
def body = bodyheight();
def isGreen = c > o;
def isIgnition = relativeVolumeStDev() > 1;
#def isIgnition = body > average(body, igniter_size);
#def isIgnition = body > stdev(body, igniter_size);
def frombar;
def days = Min(lastbn, range * 16 * (60 / chart_scale));
switch (use_range) {
case "Days":
frombar = days;
case "Bars":
frombar = range;
default:
frombar = lastbn;
}
DefineGlobalColor("color", CreateColor(125,117,85));
DefineGlobalColor("line_color", CreateColor(125,117,85));
DefineGlobalColor("dot_color", CreateColor(255,255,255));
DefineGlobalColor("historical_igniter_color", CreateColor(125,117,85));
DefineGlobalColor("historical_peak_color", CreateColor(125,117,85));
DefineGlobalColor("historical_long_color", CreateColor(125,117,85));
#DefineGlobalColor("historical_igniter_color", CreateColor(255,255,0));
#DefineGlobalColor("historical_peak_color", CreateColor(0,255,0));
#DefineGlobalColor("historical_long_color", CreateColor(254,255,255));
script slope {
input bar1 = 0;
input price1 = 0;
input bar2 = 0;
input price2 = 0;
plot slope = (price2 - price1) / (bar2 - bar1);
}
script trendline {
input bar1 = 0;
input price1 = 0;
input bar2 = 0;
input price2 = 0;
def bn = BarNumber();
plot tl = If(bn >= bar1, price2 + (bn - bar2) * slope(bar1, price1, bar2, price2), Double.NaN);
}
def h1c = If (bn > lastbn - frombar, If (IsNaN(h1c[1]) or h1c[1] <= 0 or h > h1c[1], h, h1c[1]), h1c[1]);
def h1 = GetValue(h1c, lastbnoffset);
def h1bn = HighestAll(If(h1 == h, bn, nan));
plot h1p = If (bn == h1bn && show_points, h1, nan); h1p.hideTitle(); h1p.hideBubble();
h1p.SetStyle(Curve.POINTS);
h1p.SetDefaultColor(GlobalColor("color")); h1p.assignValueColor(GlobalColor("color"));
h1p.SetLineWeight(3);
plot th0 = if show_first_bar_trend then trendline(h1bn, h1, h1bn + 1, HighestAll(If (bn[1] == h1bn, h, nan))) else nan;
th0.SetDefaultColor(GlobalColor("color")); th0.assignValueColor(GlobalColor("color"));
th0.SetStyle(line_style);
th0.SetLineWeight(3);
def h2s = If (ignore_last_bar && bn > h1bn, slope(h1bn, h1, bn, h), nan);
def h2 = HighestAll(If (lastbncheck && bn > h1bn && h2s == HighestAll(h2s), h, nan)); # highest slope
def h2bn = HighestAll(If(h2 == h, bn, nan));
plot h2p = If (bn == h2bn && show_points, h2, nan); h2p.hideTitle(); h2p.hideBubble();
h2p.SetStyle(Curve.POINTS);
h2p.SetDefaultColor(GlobalColor("color")); h2p.assignValueColor(GlobalColor("color"));
h2p.SetLineWeight(3);
def tlh1 = trendline(h1bn, h1, h2bn, h2);
plot th1 = if show_highs then tlh1 else nan;
th1.SetDefaultColor(GlobalColor("color")); th1.assignValueColor(GlobalColor("color"));
th1.SetStyle(line_style); th1.hideTitle(); th1.hideBubble();
th1.SetLineWeight(3);
addchartbubble(debug && bn == h2bn, th1, h2s, GlobalColor("color"));
def isbetweenh1 = bn > h1bn && bn < h2bn;
def islocalpeak = h == highest(h, historical_peak_range) && h > highest(h[-historical_peak_range], historical_peak_range);
# find longest TL in this range
def h2s_1 = if !isbetweenh1 then -100 else if h2s > h2s_1[1] then h2s else h2s_1[1]; # get highest slope up to now
def isShallowesth2s = h2s_1 == h2s;
def tlh1_count = if isbetweenh1 && !isShallowesth2s then tlh1_count[1] + 1 else 0; # get the longest TL
def tlh1_bn = highestall(if isbetweenh1 && isShallowesth2s then bn else nan);
def tlh1_h = highestall(if bn == tlh1_bn then h else nan);
def tlh1_1 = trendline(h1bn, h1, tlh1_bn, tlh1_h);
plot th1_1 = if show_highs && show_historical_long_trendlines then tlh1_1 else nan;
th1_1.SetDefaultColor(GlobalColor("historical_long_color")); th1_1.assignValueColor(GlobalColor("historical_long_color"));
th1_1.SetStyle(historical_line_long_style); th1_1.hideTitle(); th1_1.hideBubble();
th1_1.SetLineWeight(3);
# find ignition candles
def igh1_body = highestall(if isbetweenh1 && isIgnition && isGreen && isShallowesth2s then body else nan);
def igh1_bn = highestall(if igh1_body == body then bn else nan);
def igh1_h = highestall(if bn == igh1_bn then h else nan);
def igh1_tl = trendline(h1bn, h1, igh1_bn, igh1_h);
plot igh1_tlp = if show_highs && show_historical_igniter_trendlines then igh1_tl else nan;
igh1_tlp.SetDefaultColor(GlobalColor("historical_igniter_color")); igh1_tlp.assignValueColor(GlobalColor("historical_igniter_color"));
igh1_tlp.SetStyle(historical_line_igniter_style); igh1_tlp.hideTitle(); igh1_tlp.hideBubble();
igh1_tlp.SetLineWeight(3);
# find most recent spike
def tlh1_peak = if isbetweenh1 && islocalpeak && isShallowesth2s then h else nan;
def tlh1_peak_bn = highestall(if !isnan(tlh1_peak) && isbetweenh1 then bn else nan);
def tlh1_peak_h = highestall(if bn == tlh1_peak_bn then h else nan);
def tlh1_peak_tl = trendline(h1bn, h1, tlh1_peak_bn, tlh1_peak_h);
plot th1_peak = if show_highs && show_historical_peak_trendlines then tlh1_peak_tl else nan;
th1_peak.SetDefaultColor(GlobalColor("historical_peak_color")); th1_peak.assignValueColor(GlobalColor("historical_peak_color"));
th1_peak.SetStyle(historical_line_peak_style); th1_peak.hideTitle(); th1_peak.hideBubble();
th1_peak.SetLineWeight(3);
def h3s = If (ignore_last_bar && bn > h2bn, slope(h2bn, h2, bn, h), nan);
def h3 = HighestAll(If (lastbncheck && bn > h2bn && h3s == HighestAll(h3s), h, nan));
def h3bn = HighestAll(If(h3 == h, bn, nan));
plot h3p = If (bn == h3bn && show_points, h3, nan); h3p.hideTitle(); h3p.hideBubble();
h3p.SetStyle(Curve.POINTS);
h3p.SetDefaultColor(GlobalColor("color")); h3p.assignValueColor(GlobalColor("color"));
h3p.SetLineWeight(1);
def tlh2 = trendline(h2bn, h2, h3bn, h3);
plot th2 = if show_highs then tlh2 else nan;
th2.SetDefaultColor(GlobalColor("color")); th2.assignValueColor(GlobalColor("color"));
th2.SetStyle(line_style); th2.hideTitle(); th2.hideBubble();
th2.SetLineWeight(3);
addchartbubble(debug && bn == h3bn, th2, slope(h2bn, h2, bn, h), GlobalColor("color"));
def isbetweenh2 = bn > h2bn && bn < h3bn;
# find longest TL in this range
def h3s_1 = if !isbetweenh2 then -100 else if h3s > h3s_1[1] then h3s else h3s_1[1]; # get highest slope up to now
def isShallowesth3s = h3s_1 == h3s;
def tlh2_count = if isbetweenh2 && h3s_1 == h3s_1[1] then tlh2_count[1] + 1 else 0; # get the longest TL
def tlh2_bn = highestall(if isbetweenh2 && isShallowesth3s then bn else nan);
def tlh2_h = highestall(if bn == tlh2_bn then h else nan);
def tlh2_1 = trendline(h2bn, h2, tlh2_bn, tlh2_h);
plot th2_1 = if show_highs && show_historical_long_trendlines then tlh2_1 else nan;
th2_1.SetDefaultColor(GlobalColor("historical_long_color")); th2_1.assignValueColor(GlobalColor("historical_long_color"));
th2_1.SetStyle(historical_line_long_style); th2_1.hideTitle(); th2_1.hideBubble();
th2_1.SetLineWeight(3);
# find ignition candles
def igh2_body = highestall(if isbetweenh2 && isIgnition && isGreen && isShallowesth3s then body else nan);
def igh2_bn = highestall(if igh2_body == body then bn else nan);
def igh2_h = highestall(if bn == igh2_bn then h else nan);
def igh2_tl = trendline(h2bn, h2, igh2_bn, igh2_h);
plot igh2_tlp = if show_highs && show_historical_igniter_trendlines then igh2_tl else nan;
igh2_tlp.SetDefaultColor(GlobalColor("historical_igniter_color")); igh2_tlp.assignValueColor(GlobalColor("historical_igniter_color"));
igh2_tlp.SetStyle(historical_line_igniter_style); igh2_tlp.hideTitle(); igh2_tlp.hideBubble();
igh2_tlp.SetLineWeight(3);
# find most recent spike
def tlh2_peak = if isbetweenh2 && islocalpeak && isShallowesth3s then h else nan;
def tlh2_peak_bn = highestall(if !isnan(tlh2_peak) && isbetweenh2 then bn else nan);
def tlh2_peak_h = highestall(if bn == tlh2_peak_bn then h else nan);
def tlh2_peak_tl = trendline(h2bn, h2, tlh2_peak_bn, tlh2_peak_h);
plot th2_peak = if show_highs && show_historical_peak_trendlines then tlh2_peak_tl else nan;
th2_peak.SetDefaultColor(GlobalColor("historical_peak_color")); th2_peak.assignValueColor(GlobalColor("historical_peak_color"));
th2_peak.SetStyle(historical_line_peak_style); th2_peak.hideTitle(); th2_peak.hideBubble();
th2_peak.SetLineWeight(3);
def h4s = If (ignore_last_bar && bn > h3bn, slope(h3bn, h3, bn, h), nan);
def h4 = HighestAll(If (lastbncheck && bn > h3bn && h4s == HighestAll(h4s), h, nan));
def h4bn = HighestAll(If(h4 == h, bn, nan));
plot h4p = If (bn == h4bn && show_points, h4, nan); h4p.hideTitle(); h4p.hideBubble();
h4p.SetStyle(Curve.POINTS);
h4p.SetDefaultColor(GlobalColor("color")); h4p.assignValueColor(GlobalColor("color"));
h4p.SetLineWeight(1);
def tlh3 = trendline(h3bn, h3, h4bn, h4);
plot th3 = if show_highs then tlh3 else nan;
th3.SetDefaultColor(GlobalColor("color")); th3.assignValueColor(GlobalColor("color"));
th3.SetStyle(line_style); th3.hideTitle(); th3.hideBubble();
addchartbubble(debug && bn == h4bn, th3, slope(h3bn, h3, bn, h), GlobalColor("color"));
def isbetweenh3 = bn > h3bn && bn < h4bn;
# find longest TL in this range
def h4s_1 = if !isbetweenh3 then -100 else if h4s > h4s_1[1] then h4s else h4s_1[1]; # get highest slope up to now
def isShallowesth4s = h4s_1 == h4s;
def tlh3_count = if isbetweenh3 && h4s_1 == h4s_1[1] then tlh3_count[1] + 1 else 0; # get the longest TL
def tlh3_bn = highestall(if isbetweenh3 && isShallowesth4s then bn else nan);
def tlh3_h = highestall(if bn == tlh3_bn then h else nan);
def tlh3_1 = trendline(h3bn, h3, tlh3_bn, tlh3_h);
plot th3_1 = if show_highs && show_historical_long_trendlines then tlh3_1 else nan;
th3_1.SetDefaultColor(GlobalColor("historical_long_color")); th3_1.assignValueColor(GlobalColor("historical_long_color"));
th3_1.SetStyle(historical_line_long_style); th3_1.hideTitle(); th3_1.hideBubble();
th3_1.SetLineWeight(1);
# find ignition candles
def igh3_body = highestall(if isbetweenh3 && isIgnition && isGreen && isShallowesth4s then body else nan);
def igh3_bn = highestall(if igh3_body == body then bn else nan);
def igh3_h = highestall(if bn == igh3_bn then h else nan);
def igh3_tl = trendline(h3bn, h3, igh3_bn, igh3_h);
plot igh3_tlp = if show_highs && show_historical_igniter_trendlines then igh3_tl else nan;
igh3_tlp.SetDefaultColor(GlobalColor("historical_igniter_color")); igh3_tlp.assignValueColor(GlobalColor("historical_igniter_color"));
igh3_tlp.SetStyle(historical_line_igniter_style); igh3_tlp.hideTitle(); igh3_tlp.hideBubble();
igh3_tlp.SetLineWeight(1);
# find most recent spike
def tlh3_peak = if isbetweenh3 && islocalpeak && isShallowesth4s then h else nan;
def tlh3_peak_bn = highestall(if !isnan(tlh3_peak) && isbetweenh3 then bn else nan);
def tlh3_peak_h = highestall(if bn == tlh3_peak_bn then h else nan);
def tlh3_peak_tl = trendline(h3bn, h3, tlh3_peak_bn, tlh3_peak_h);
plot th3_peak = if show_highs && show_historical_peak_trendlines then tlh3_peak_tl else nan;
th3_peak.SetDefaultColor(GlobalColor("historical_peak_color")); th3_peak.assignValueColor(GlobalColor("historical_peak_color"));
th3_peak.SetStyle(historical_line_peak_style); th3_peak.hideTitle(); th3_peak.hideBubble();
th3_peak.SetLineWeight(1);
def h5s = If (ignore_last_bar && bn > h4bn, slope(h4bn, h4, bn, h), nan);
def h5 = HighestAll(If (lastbncheck && bn > h4bn && h5s == HighestAll(h5s), h, nan));
def h5bn = HighestAll(If(h5 == h, bn, nan));
plot h5p = If (bn == h5bn && show_points, h5, nan); h5p.hideTitle(); h5p.hideBubble();
h5p.SetStyle(Curve.POINTS);
h5p.SetDefaultColor(GlobalColor("color")); h5p.assignValueColor(GlobalColor("color"));
h5p.SetLineWeight(1);
def tlh4 = trendline(h4bn, h4, h5bn, h5);
plot th4 = if show_highs then tlh4 else nan;
th4.SetDefaultColor(GlobalColor("color")); th4.assignValueColor(GlobalColor("color"));
th4.SetStyle(line_style); th4.hideTitle(); th4.hideBubble();
addchartbubble(debug && bn == h5bn, th4, slope(h4bn, h4, bn, h), GlobalColor("color"));
def isbetweenh4 = bn > h4bn && bn < h5bn;
# find longest TL in this range
def h5s_1 = if !isbetweenh4 then -100 else if h5s > h5s_1[1] then h5s else h5s_1[1]; # get highest slope up to now
def isShallowesth5s = h5s_1 == h5s;
def tlh4_count = if isbetweenh4 && h5s_1 == h5s_1[1] then tlh4_count[1] + 1 else 0; # get the longest TL
def tlh4_bn = highestall(if isbetweenh4 && isShallowesth5s then bn else nan);
def tlh4_h = highestall(if bn == tlh4_bn then h else nan);
def tlh4_1 = trendline(h4bn, h4, tlh4_bn, tlh4_h);
plot th4_1 = if show_highs && show_historical_long_trendlines then tlh4_1 else nan;
th4_1.SetDefaultColor(GlobalColor("historical_long_color")); th4_1.assignValueColor(GlobalColor("historical_long_color"));
th4_1.SetStyle(historical_line_long_style); th4_1.hideTitle(); th4_1.hideBubble();
th4_1.SetLineWeight(1);
# find ignition candles
def igh4_body = highestall(if isbetweenh4 && isIgnition && isGreen && isShallowesth5s then body else nan);
def igh4_bn = highestall(if igh4_body == body then bn else nan);
def igh4_h = highestall(if bn == igh4_bn then h else nan);
def igh4_tl = trendline(h4bn, h4, igh4_bn, igh4_h);
plot igh4_tlp = if show_highs && show_historical_igniter_trendlines then igh4_tl else nan;
igh4_tlp.SetDefaultColor(GlobalColor("historical_igniter_color")); igh4_tlp.assignValueColor(GlobalColor("historical_igniter_color"));
igh4_tlp.SetStyle(historical_line_igniter_style); igh4_tlp.hideTitle(); igh4_tlp.hideBubble();
igh4_tlp.SetLineWeight(1);
# find most recent spike
def tlh4_peak = if isbetweenh4 && islocalpeak && isShallowesth5s then h else nan;
def tlh4_peak_bn = highestall(if !isnan(tlh4_peak) && isbetweenh4 then bn else nan);
def tlh4_peak_h = highestall(if bn == tlh4_peak_bn then h else nan);
def tlh4_peak_tl = trendline(h4bn, h4, tlh4_peak_bn, tlh4_peak_h);
plot th4_peak = if show_highs && show_historical_peak_trendlines then tlh4_peak_tl else nan;
th4_peak.SetDefaultColor(GlobalColor("historical_peak_color")); th4_peak.assignValueColor(GlobalColor("historical_peak_color"));
th4_peak.SetStyle(historical_line_peak_style); th4_peak.hideTitle(); th4_peak.hideBubble();
th4_peak.SetLineWeight(1);
def h6s = If (ignore_last_bar && bn > h5bn, slope(h5bn, h5, bn, h), nan);
def h6 = HighestAll(If (lastbncheck && bn > h5bn && h6s == HighestAll(h6s), h, nan));
def h6bn = HighestAll(If(h6 == h, bn, nan));
plot h6p = If (bn == h6bn && show_points, h6, nan); h6p.hideTitle(); h6p.hideBubble();
h6p.SetStyle(Curve.POINTS);
h6p.SetDefaultColor(GlobalColor("color")); h6p.assignValueColor(GlobalColor("color"));
h6p.SetLineWeight(1);
def tlh5 = trendline(h5bn, h5, h6bn, h6);
plot th5 = if show_highs then tlh5 else nan;
th5.SetDefaultColor(GlobalColor("color")); th5.assignValueColor(GlobalColor("color"));
th5.SetStyle(line_style); th5.hideTitle(); th5.hideBubble();
addchartbubble(debug && bn == h6bn, th5, slope(h5bn, h5, bn, h), GlobalColor("color"));
def isbetweenh5 = bn > h5bn && bn < h6bn;
# find longest TL in this range
def h6s_1 = if !isbetweenh5 then -100 else if h6s > h6s_1[1] then h6s else h6s_1[1]; # get highest slope up to now
def isShallowesth6s = h6s_1 == h6s;
def tlh5_count = if isbetweenh5 && h6s_1 == h6s_1[1] then tlh5_count[1] + 1 else 0; # get the longest TL
def tlh5_bn = highestall(if isbetweenh5 && isShallowesth6s then bn else nan);
def tlh5_h = highestall(if bn == tlh5_bn then h else nan);
def tlh5_1 = trendline(h5bn, h5, tlh5_bn, tlh5_h);
plot th5_1 = if show_highs && show_historical_long_trendlines then tlh5_1 else nan;
th5_1.SetDefaultColor(GlobalColor("historical_long_color")); th5_1.assignValueColor(GlobalColor("historical_long_color"));
th5_1.SetStyle(historical_line_long_style); th5_1.hideTitle(); th5_1.hideBubble();
th5_1.SetLineWeight(1);
# find ignition candles
def igh5_body = highestall(if isbetweenh5 && isIgnition && isGreen && isShallowesth6s then body else nan);
def igh5_bn = highestall(if igh5_body == body then bn else nan);
def igh5_h = highestall(if bn == igh5_bn then h else nan);
def igh5_tl = trendline(h5bn, h5, igh5_bn, igh5_h);
plot igh5_tlp = if show_highs && show_historical_igniter_trendlines then igh5_tl else nan;
igh5_tlp.SetDefaultColor(GlobalColor("historical_igniter_color")); igh5_tlp.assignValueColor(GlobalColor("historical_igniter_color"));
igh5_tlp.SetStyle(historical_line_igniter_style); igh5_tlp.hideTitle(); igh5_tlp.hideBubble();
igh5_tlp.SetLineWeight(1);
# find most recent spike
def tlh5_peak = if isbetweenh5 && islocalpeak && isShallowesth6s then h else nan;
def tlh5_peak_bn = highestall(if !isnan(tlh5_peak) && isbetweenh5 then bn else nan);
def tlh5_peak_h = highestall(if bn == tlh5_peak_bn then h else nan);
def tlh5_peak_tl = trendline(h5bn, h5, tlh5_peak_bn, tlh5_peak_h);
plot th5_peak = if show_highs && show_historical_peak_trendlines then tlh5_peak_tl else nan;
th5_peak.SetDefaultColor(GlobalColor("historical_peak_color")); th5_peak.assignValueColor(GlobalColor("historical_peak_color"));
th5_peak.SetStyle(historical_line_peak_style); th5_peak.hideTitle(); th5_peak.hideBubble();
th5_peak.SetLineWeight(1);
def h7s = If (ignore_last_bar && bn > h6bn, slope(h6bn, h6, bn, h), nan);
def h7 = HighestAll(If (lastbncheck && bn > h6bn && h7s == HighestAll(h7s), h, nan));
def h7bn = HighestAll(If(h7 == h, bn, nan));
plot h7p = If (bn == h7bn && show_points, h7, nan); h7p.hideTitle(); h7p.hideBubble();
h7p.SetStyle(Curve.POINTS);
h7p.SetDefaultColor(GlobalColor("color")); h7p.assignValueColor(GlobalColor("color"));
h7p.SetLineWeight(1);
def tlh6 = trendline(h6bn, h6, h7bn, h7);
plot th6 = if show_highs then tlh6 else nan;
th6.SetDefaultColor(GlobalColor("color")); th6.assignValueColor(GlobalColor("color"));
th6.SetStyle(line_style); th6.hideTitle(); th6.hideBubble();
addchartbubble(debug && bn == h7bn, th6, slope(h6bn, h6, bn, h), GlobalColor("color"));
def isbetweenh6 = bn > h6bn && bn < h7bn;
# find longest TL in this range
def h7s_1 = if !isbetweenh6 then -100 else if h7s > h7s_1[1] then h7s else h7s_1[1]; # get highest slope up to now
def isShallowesth7s = h7s_1 == h7s;
def tlh6_count = if isbetweenh6 && h7s_1 == h7s_1[1] then tlh6_count[1] + 1 else 0; # get the longest TL
def tlh6_bn = highestall(if isbetweenh6 && isShallowesth7s then bn else nan);
def tlh6_h = highestall(if bn == tlh6_bn then h else nan);
def tlh6_1 = trendline(h6bn, h6, tlh6_bn, tlh6_h);
plot th6_1 = if show_highs && show_historical_long_trendlines then tlh6_1 else nan;
th6_1.SetDefaultColor(GlobalColor("historical_long_color")); th6_1.assignValueColor(GlobalColor("historical_long_color"));
th6_1.SetStyle(historical_line_long_style); th6_1.hideTitle(); th6_1.hideBubble();
th6_1.SetLineWeight(1);
# find ignition candles
def igh6_body = highestall(if isbetweenh6 && isIgnition && isGreen && isShallowesth7s then body else nan);
def igh6_bn = highestall(if igh6_body == body then bn else nan);
def igh6_h = highestall(if bn == igh6_bn then h else nan);
def igh6_tl = trendline(h6bn, h6, igh6_bn, igh6_h);
plot igh6_tlp = if show_highs && show_historical_igniter_trendlines then igh6_tl else nan;
igh6_tlp.SetDefaultColor(GlobalColor("historical_igniter_color")); igh6_tlp.assignValueColor(GlobalColor("historical_igniter_color"));
igh6_tlp.SetStyle(historical_line_igniter_style); igh6_tlp.hideTitle(); igh6_tlp.hideBubble();
igh6_tlp.SetLineWeight(1);
# find most recent spike
def tlh6_peak = if isbetweenh6 && islocalpeak && isShallowesth7s then h else nan;
def tlh6_peak_bn = highestall(if !isnan(tlh6_peak) && isbetweenh6 then bn else nan);
def tlh6_peak_h = highestall(if bn == tlh6_peak_bn then h else nan);
def tlh6_peak_tl = trendline(h6bn, h6, tlh6_peak_bn, tlh6_peak_h);
plot th6_peak = if show_highs && show_historical_peak_trendlines then tlh6_peak_tl else nan;
th6_peak.SetDefaultColor(GlobalColor("historical_peak_color")); th6_peak.assignValueColor(GlobalColor("historical_peak_color"));
th6_peak.SetStyle(historical_line_peak_style); th6_peak.hideTitle(); th6_peak.hideBubble();
th6_peak.SetLineWeight(1);
def h8s = If (ignore_last_bar && bn > h7bn, slope(h7bn, h7, bn, h), nan);
def h8 = HighestAll(If (lastbncheck && bn > h7bn && h8s == HighestAll(h8s), h, nan));
def h8bn = HighestAll(If(h8 == h, bn, nan));
plot h8p = If (bn == h8bn && show_points, h8, nan); h8p.hideTitle(); h8p.hideBubble();
h8p.SetStyle(Curve.POINTS);
h8p.SetDefaultColor(GlobalColor("color")); h8p.assignValueColor(GlobalColor("color"));
h8p.SetLineWeight(1);
def tlh7 = trendline(h7bn, h7, h8bn, h8);
plot th7 = if show_highs then tlh7 else nan;
th7.SetDefaultColor(GlobalColor("color")); th7.assignValueColor(GlobalColor("color"));
th7.SetStyle(line_style); th7.hideTitle(); th7.hideBubble();
addchartbubble(debug && bn == h8bn, th7, slope(h7bn, h7, bn, h), GlobalColor("color"));
def isbetweenh7 = bn > h7bn && bn < h8bn;
# find longest TL in this range
def h8s_1 = if !isbetweenh7 then -100 else if h8s > h8s_1[1] then h8s else h8s_1[1]; # get highest slope up to now
def isShallowesth8s = h8s_1 == h8s;
def tlh7_count = if isbetweenh7 && h8s_1 == h8s_1[1] then tlh7_count[1] + 1 else 0; # get the longest TL
def tlh7_bn = highestall(if isbetweenh7 && isShallowesth8s then bn else nan);
def tlh7_h = highestall(if bn == tlh7_bn then h else nan);
def tlh7_1 = trendline(h7bn, h7, tlh7_bn, tlh7_h);
plot th7_1 = if show_highs && show_historical_long_trendlines then tlh7_1 else nan;
th7_1.SetDefaultColor(GlobalColor("historical_long_color")); th7_1.assignValueColor(GlobalColor("historical_long_color"));
th7_1.SetStyle(historical_line_long_style); th7_1.hideTitle(); th7_1.hideBubble();
th7_1.SetLineWeight(1);
# find ignition candles
def igh7_body = highestall(if isbetweenh7 && isIgnition && isGreen && isShallowesth8s then body else nan);
def igh7_bn = highestall(if igh7_body == body then bn else nan);
def igh7_h = highestall(if bn == igh7_bn then h else nan);
def igh7_tl = trendline(h7bn, h7, igh7_bn, igh7_h);
plot igh7_tlp = if show_highs && show_historical_igniter_trendlines then igh7_tl else nan;
igh7_tlp.SetDefaultColor(GlobalColor("historical_igniter_color")); igh7_tlp.assignValueColor(GlobalColor("historical_igniter_color"));
igh7_tlp.SetStyle(historical_line_igniter_style); igh7_tlp.hideTitle(); igh7_tlp.hideBubble();
igh7_tlp.SetLineWeight(1);
# find most recent spike
def tlh7_peak = if isbetweenh7 && islocalpeak && isShallowesth8s then h else nan;
def tlh7_peak_bn = highestall(if !isnan(tlh7_peak) && isbetweenh7 then bn else nan);
def tlh7_peak_h = highestall(if bn == tlh7_peak_bn then h else nan);
def tlh7_peak_tl = trendline(h7bn, h7, tlh7_peak_bn, tlh7_peak_h);
plot th7_peak = if show_highs && show_historical_peak_trendlines then tlh7_peak_tl else nan;
th7_peak.SetDefaultColor(GlobalColor("historical_peak_color")); th7_peak.assignValueColor(GlobalColor("historical_peak_color"));
th7_peak.SetStyle(historical_line_peak_style); th7_peak.hideTitle(); th7_peak.hideBubble();
th7_peak.SetLineWeight(1);
def h9s = If (ignore_last_bar && bn > h8bn, slope(h8bn, h8, bn, h), nan);
def h9 = HighestAll(If (lastbncheck && bn > h8bn && h9s == HighestAll(h9s), h, nan));
def h9bn = HighestAll(If(h9 == h, bn, nan));
plot h9p = If (bn == h9bn && show_points, h9, nan); h9p.hideTitle(); h9p.hideBubble();
h9p.SetStyle(Curve.POINTS);
h9p.SetDefaultColor(GlobalColor("color")); h9p.assignValueColor(GlobalColor("color"));
h9p.SetLineWeight(1);
def tlh8 = trendline(h8bn, h8, h9bn, h9);
plot th8 = if show_highs then tlh8 else nan;
th8.SetDefaultColor(GlobalColor("color")); th8.assignValueColor(GlobalColor("color"));
th8.SetStyle(line_style); th8.hideTitle(); th8.hideBubble();
addchartbubble(debug && bn == h9bn, th8, slope(h8bn, h8, bn, h), GlobalColor("color"));
def isbetweenh8 = bn > h8bn && bn < h9bn;
# find longest TL in this range
def h9s_1 = if !isbetweenh8 then -100 else if h9s > h9s_1[1] then h9s else h9s_1[1]; # get highest slope up to now
def isShallowesth9s = h9s_1 == h9s;
def tlh8_count = if isbetweenh8 && h9s_1 == h9s_1[1] then tlh8_count[1] + 1 else 0; # get the longest TL
def tlh8_bn = highestall(if isbetweenh8 && isShallowesth9s then bn else nan);
def tlh8_h = highestall(if bn == tlh8_bn then h else nan);
def tlh8_1 = trendline(h8bn, h8, tlh8_bn, tlh8_h);
plot th8_1 = if show_highs && show_historical_long_trendlines then tlh8_1 else nan;
th8_1.SetDefaultColor(GlobalColor("historical_long_color")); th8_1.assignValueColor(GlobalColor("historical_long_color"));
th8_1.SetStyle(historical_line_long_style); th8_1.hideTitle(); th8_1.hideBubble();
th8_1.SetLineWeight(1);
# find ignition candles
def igh8_body = highestall(if isbetweenh8 && isIgnition && isGreen && isShallowesth9s then body else nan);
def igh8_bn = highestall(if igh8_body == body then bn else nan);
def igh8_h = highestall(if bn == igh8_bn then h else nan);
def igh8_tl = trendline(h8bn, h8, igh8_bn, igh8_h);
plot igh8_tlp = if show_highs && show_historical_igniter_trendlines then igh8_tl else nan;
igh8_tlp.SetDefaultColor(GlobalColor("historical_igniter_color")); igh8_tlp.assignValueColor(GlobalColor("historical_igniter_color"));
igh8_tlp.SetStyle(historical_line_igniter_style); igh8_tlp.hideTitle(); igh8_tlp.hideBubble();
igh8_tlp.SetLineWeight(1);
# find most recent spike
def tlh8_peak = if isbetweenh8 && islocalpeak && isShallowesth9s then h else nan;
def tlh8_peak_bn = highestall(if !isnan(tlh8_peak) && isbetweenh8 then bn else nan);
def tlh8_peak_h = highestall(if bn == tlh8_peak_bn then h else nan);
def tlh8_peak_tl = trendline(h8bn, h8, tlh8_peak_bn, tlh8_peak_h);
plot th8_peak = if show_highs && show_historical_peak_trendlines then tlh8_peak_tl else nan;
th8_peak.SetDefaultColor(GlobalColor("historical_peak_color")); th8_peak.assignValueColor(GlobalColor("historical_peak_color"));
th8_peak.SetStyle(historical_line_peak_style); th8_peak.hideTitle(); th8_peak.hideBubble();
th8_peak.SetLineWeight(1);
def h10s = If (ignore_last_bar && bn > h9bn, slope(h9bn, h9, bn, h), nan);
def h10 = HighestAll(If (lastbncheck && bn > h9bn && h10s == HighestAll(h10s), h, nan));
def h10bn = HighestAll(If(h10 == h, bn, nan));
plot h10p = If (bn == h10bn && show_points, h10, nan); h10p.hideTitle(); h10p.hideBubble();
h10p.SetStyle(Curve.POINTS);
h10p.SetDefaultColor(GlobalColor("color")); h10p.assignValueColor(GlobalColor("color"));
h10p.SetLineWeight(1);
def tlh9 = trendline(h9bn, h9, h10bn, h10);
plot th9 = if show_highs then tlh9 else nan;
th9.SetDefaultColor(GlobalColor("color")); th9.assignValueColor(GlobalColor("color"));
th9.SetStyle(line_style); th9.hideTitle(); th9.hideBubble();
addchartbubble(debug && bn == h10bn, th9, slope(h9bn, h9, bn, h), GlobalColor("color"));
def isbetweenh9 = bn > h9bn && bn < h10bn;
# find longest TL in this range
def h10s_1 = if !isbetweenh9 then -100 else if h10s > h10s_1[1] then h10s else h10s_1[1]; # get highest slope up to now
def isShallowesth10s = h10s_1 == h10s;
def tlh9_count = if isbetweenh9 && h10s_1 == h10s_1[1] then tlh9_count[1] + 1 else 0; # get the longest TL
def tlh9_bn = highestall(if isbetweenh9 && isShallowesth10s then bn else nan);
def tlh9_h = highestall(if bn == tlh9_bn then h else nan);
def tlh9_1 = trendline(h9bn, h9, tlh9_bn, tlh9_h);
plot th9_1 = if show_highs && show_historical_long_trendlines then tlh9_1 else nan;
th9_1.SetDefaultColor(GlobalColor("historical_long_color")); th9_1.assignValueColor(GlobalColor("historical_long_color"));
th9_1.SetStyle(historical_line_long_style); th9_1.hideTitle(); th9_1.hideBubble();
th9_1.SetLineWeight(1);
# find ignition candles
def igh9_body = highestall(if isbetweenh9 && isIgnition && isGreen && isShallowesth10s then body else nan);
def igh9_bn = highestall(if igh9_body == body then bn else nan);
def igh9_h = highestall(if bn == igh9_bn then h else nan);
def igh9_tl = trendline(h9bn, h9, igh9_bn, igh9_h);
plot igh9_tlp = if show_highs && show_historical_igniter_trendlines then igh9_tl else nan;
igh9_tlp.SetDefaultColor(GlobalColor("historical_igniter_color")); igh9_tlp.assignValueColor(GlobalColor("historical_igniter_color"));
igh9_tlp.SetStyle(historical_line_igniter_style); igh9_tlp.hideTitle(); igh9_tlp.hideBubble();
igh9_tlp.SetLineWeight(1);
# find most recent spike
def tlh9_peak = if isbetweenh9 && islocalpeak && isShallowesth10s then h else nan;
def tlh9_peak_bn = highestall(if !isnan(tlh9_peak) && isbetweenh9 then bn else nan);
def tlh9_peak_h = highestall(if bn == tlh9_peak_bn then h else nan);
def tlh9_peak_tl = trendline(h9bn, h9, tlh9_peak_bn, tlh9_peak_h);
plot th9_peak = if show_highs && show_historical_peak_trendlines then tlh9_peak_tl else nan;
th9_peak.SetDefaultColor(GlobalColor("historical_peak_color")); th9_peak.assignValueColor(GlobalColor("historical_peak_color"));
th9_peak.SetStyle(historical_line_peak_style); th9_peak.hideTitle(); th9_peak.hideBubble();
th9_peak.SetLineWeight(1);
def h11s = If (ignore_last_bar && bn > h10bn, slope(h10bn, h10, bn, h), nan);
def h11 = HighestAll(If (lastbncheck && bn > h10bn && h11s == HighestAll(h11s), h, nan));
def h11bn = HighestAll(If(h11 == h, bn, nan));
plot h11p = If (bn == h11bn && show_points, h11, nan); h11p.hideTitle(); h11p.hideBubble();
h11p.SetStyle(Curve.POINTS);
h11p.SetDefaultColor(GlobalColor("color")); h11p.assignValueColor(GlobalColor("color"));
h11p.SetLineWeight(1);
def tlh10 = trendline(h10bn, h10, h11bn, h11);
plot th10 = if show_highs then tlh10 else nan;
th10.SetDefaultColor(GlobalColor("color")); th10.assignValueColor(GlobalColor("color"));
th10.SetStyle(line_style); th10.hideTitle(); th10.hideBubble();
addchartbubble(debug && bn == h11bn, th10, slope(h10bn, h10, bn, h), GlobalColor("color"));
def isbetweenh10 = bn > h10bn && bn < h11bn;
# find longest TL in this range
def h11s_1 = if !isbetweenh10 then -100 else if h11s > h11s_1[1] then h11s else h11s_1[1]; # get highest slope up to now
def isShallowesth11s = h11s_1 == h11s;
def tlh10_count = if isbetweenh10 && h11s_1 == h11s_1[1] then tlh10_count[1] + 1 else 0; # get the longest TL
def tlh10_bn = highestall(if isbetweenh10 && isShallowesth11s then bn else nan);
def tlh10_h = highestall(if bn == tlh10_bn then h else nan);
def tlh10_1 = trendline(h10bn, h10, tlh10_bn, tlh10_h);
plot th10_1 = if show_highs && show_historical_long_trendlines then tlh10_1 else nan;
th10_1.SetDefaultColor(GlobalColor("historical_long_color")); th10_1.assignValueColor(GlobalColor("historical_long_color"));
th10_1.SetStyle(historical_line_long_style); th10_1.hideTitle(); th10_1.hideBubble();
th10_1.SetLineWeight(1);
# find ignition candles
def igh10_body = highestall(if isbetweenh10 && isIgnition && isGreen && isShallowesth11s then body else nan);
def igh10_bn = highestall(if igh10_body == body then bn else nan);
def igh10_h = highestall(if bn == igh10_bn then h else nan);
def igh10_tl = trendline(h10bn, h10, igh10_bn, igh10_h);
plot igh10_tlp = if show_highs && show_historical_igniter_trendlines then igh10_tl else nan;
igh10_tlp.SetDefaultColor(GlobalColor("historical_igniter_color")); igh10_tlp.assignValueColor(GlobalColor("historical_igniter_color"));
igh10_tlp.SetStyle(historical_line_igniter_style); igh10_tlp.hideTitle(); igh10_tlp.hideBubble();
igh10_tlp.SetLineWeight(1);
# find most recent spike
def tlh10_peak = if isbetweenh10 && islocalpeak && isShallowesth11s then h else nan;
def tlh10_peak_bn = highestall(if !isnan(tlh10_peak) && isbetweenh10 then bn else nan);
def tlh10_peak_h = highestall(if bn == tlh10_peak_bn then h else nan);
def tlh10_peak_tl = trendline(h10bn, h10, tlh10_peak_bn, tlh10_peak_h);
plot th10_peak = if show_highs && show_historical_peak_trendlines then tlh10_peak_tl else nan;
th10_peak.SetDefaultColor(GlobalColor("historical_peak_color")); th10_peak.assignValueColor(GlobalColor("historical_peak_color"));
th10_peak.SetStyle(historical_line_peak_style); th10_peak.hideTitle(); th10_peak.hideBubble();
th10_peak.SetLineWeight(1);
def h12s = If (ignore_last_bar && bn > h11bn, slope(h11bn, h11, bn, h), nan);
def h12 = HighestAll(If (lastbncheck && bn > h11bn && h12s == HighestAll(h12s), h, nan));
def h12bn = HighestAll(If(h12 == h, bn, nan));
plot h12p = If (bn == h12bn && show_points, h12, nan); h12p.hideTitle(); h12p.hideBubble();
h12p.SetStyle(Curve.POINTS);
h12p.SetDefaultColor(GlobalColor("color")); h12p.assignValueColor(GlobalColor("color"));
h12p.SetLineWeight(1);
def tlh11 = trendline(h11bn, h11, h12bn, h12);
plot th11 = if show_highs then tlh11 else nan;
th11.SetDefaultColor(GlobalColor("color")); th11.assignValueColor(GlobalColor("color"));
th11.SetStyle(line_style); th11.hideTitle(); th11.hideBubble();
addchartbubble(debug && bn == h12bn, th11, slope(h11bn, h11, bn, h), GlobalColor("color"));
def isbetweenh11 = bn > h11bn && bn < h12bn;
# find longest TL in this range
def h12s_1 = if !isbetweenh11 then -100 else if h12s > h12s_1[1] then h12s else h12s_1[1]; # get highest slope up to now
def isShallowesth12s = h12s_1 == h12s;
def tlh11_count = if isbetweenh11 && h12s_1 == h12s_1[1] then tlh11_count[1] + 1 else 0; # get the longest TL
def tlh11_bn = highestall(if isbetweenh11 && isShallowesth12s then bn else nan);
def tlh11_h = highestall(if bn == tlh11_bn then h else nan);
def tlh11_1 = trendline(h11bn, h11, tlh11_bn, tlh11_h);
plot th11_1 = if show_highs && show_historical_long_trendlines then tlh11_1 else nan;
th11_1.SetDefaultColor(GlobalColor("historical_long_color")); th11_1.assignValueColor(GlobalColor("historical_long_color"));
th11_1.SetStyle(historical_line_long_style); th11_1.hideTitle(); th11_1.hideBubble();
th11_1.SetLineWeight(1);
# find ignition candles
def igh11_body = highestall(if isbetweenh11 && isIgnition && isGreen && isShallowesth12s then body else nan);
def igh11_bn = highestall(if igh11_body == body then bn else nan);
def igh11_h = highestall(if bn == igh11_bn then h else nan);
def igh11_tl = trendline(h11bn, h11, igh11_bn, igh11_h);
plot igh11_tlp = if show_highs && show_historical_igniter_trendlines then igh11_tl else nan;
igh11_tlp.SetDefaultColor(GlobalColor("historical_igniter_color")); igh11_tlp.assignValueColor(GlobalColor("historical_igniter_color"));
igh11_tlp.SetStyle(historical_line_igniter_style); igh11_tlp.hideTitle(); igh11_tlp.hideBubble();
igh11_tlp.SetLineWeight(1);
# find most recent spike
def tlh11_peak = if isbetweenh11 && islocalpeak && isShallowesth12s then h else nan;
def tlh11_peak_bn = highestall(if !isnan(tlh11_peak) && isbetweenh11 then bn else nan);
def tlh11_peak_h = highestall(if bn == tlh11_peak_bn then h else nan);
def tlh11_peak_tl = trendline(h11bn, h11, tlh11_peak_bn, tlh11_peak_h);
plot th11_peak = if show_highs && show_historical_peak_trendlines then tlh11_peak_tl else nan;
th11_peak.SetDefaultColor(GlobalColor("historical_peak_color")); th11_peak.assignValueColor(GlobalColor("historical_peak_color"));
th11_peak.SetStyle(historical_line_peak_style); th11_peak.hideTitle(); th11_peak.hideBubble();
th11_peak.SetLineWeight(1);
def h13s = If (ignore_last_bar && bn > h12bn, slope(h12bn, h12, bn, h), nan);
def h13 = HighestAll(If (lastbncheck && bn > h12bn && h13s == HighestAll(h13s), h, nan));
def h13bn = HighestAll(If(h13 == h, bn, nan));
plot h13p = If (bn == h13bn && show_points, h13, nan); h13p.hideTitle(); h13p.hideBubble();
h13p.SetStyle(Curve.POINTS);
h13p.SetDefaultColor(GlobalColor("color")); h13p.assignValueColor(GlobalColor("color"));
h13p.SetLineWeight(1);
def tlh12 = trendline(h12bn, h12, h13bn, h13);
plot th12 = if show_highs then tlh12 else nan;
th12.SetDefaultColor(GlobalColor("color")); th12.assignValueColor(GlobalColor("color"));
th12.SetStyle(line_style); th12.hideTitle(); th12.hideBubble();
addchartbubble(debug && bn == h13bn, th12, slope(h12bn, h12, bn, h), GlobalColor("color"));
def isbetweenh12 = bn > h12bn && bn < h13bn;
# find longest TL in this range
def h13s_1 = if !isbetweenh12 then -100 else if h13s > h13s_1[1] then h13s else h13s_1[1]; # get highest slope up to now
def isShallowesth13s = h13s_1 == h13s;
def tlh12_count = if isbetweenh12 && h13s_1 == h13s_1[1] then tlh12_count[1] + 1 else 0; # get the longest TL
def tlh12_bn = highestall(if isbetweenh12 && isShallowesth13s then bn else nan);
def tlh12_h = highestall(if bn == tlh12_bn then h else nan);
def tlh12_1 = trendline(h12bn, h12, tlh12_bn, tlh12_h);
plot th12_1 = if show_highs && show_historical_long_trendlines then tlh12_1 else nan;
th12_1.SetDefaultColor(GlobalColor("historical_long_color")); th12_1.assignValueColor(GlobalColor("historical_long_color"));
th12_1.SetStyle(historical_line_long_style); th12_1.hideTitle(); th12_1.hideBubble();
th12_1.SetLineWeight(1);
# find ignition candles
def igh12_body = highestall(if isbetweenh12 && isIgnition && isGreen && isShallowesth13s then body else nan);
def igh12_bn = highestall(if igh12_body == body then bn else nan);
def igh12_h = highestall(if bn == igh12_bn then h else nan);
def igh12_tl = trendline(h12bn, h12, igh12_bn, igh12_h);
plot igh12_tlp = if show_highs && show_historical_igniter_trendlines then igh12_tl else nan;
igh12_tlp.SetDefaultColor(GlobalColor("historical_igniter_color")); igh12_tlp.assignValueColor(GlobalColor("historical_igniter_color"));
igh12_tlp.SetStyle(historical_line_igniter_style); igh12_tlp.hideTitle(); igh12_tlp.hideBubble();
igh12_tlp.SetLineWeight(1);
# find most recent spike
def tlh12_peak = if isbetweenh12 && islocalpeak && isShallowesth13s then h else nan;
def tlh12_peak_bn = highestall(if !isnan(tlh12_peak) && isbetweenh12 then bn else nan);
def tlh12_peak_h = highestall(if bn == tlh12_peak_bn then h else nan);
def tlh12_peak_tl = trendline(h12bn, h12, tlh12_peak_bn, tlh12_peak_h);
plot th12_peak = if show_highs && show_historical_peak_trendlines then tlh12_peak_tl else nan;
th12_peak.SetDefaultColor(GlobalColor("historical_peak_color")); th12_peak.assignValueColor(GlobalColor("historical_peak_color"));
th12_peak.SetStyle(historical_line_peak_style); th12_peak.hideTitle(); th12_peak.hideBubble();
th12_peak.SetLineWeight(1);
def h14s = If (ignore_last_bar && bn > h13bn, slope(h13bn, h13, bn, h), nan);
def h14 = HighestAll(If (lastbncheck && bn > h13bn && h14s == HighestAll(h14s), h, nan));
def h14bn = HighestAll(If(h14 == h, bn, nan));
plot h14p = If (bn == h14bn && show_points, h14, nan); h14p.hideTitle(); h14p.hideBubble();
h14p.SetStyle(Curve.POINTS);
h14p.SetDefaultColor(GlobalColor("color")); h14p.assignValueColor(GlobalColor("color"));
h14p.SetLineWeight(1);
def tlh13 = trendline(h13bn, h13, h14bn, h14);
plot th13 = if show_highs then tlh13 else nan;
th13.SetDefaultColor(GlobalColor("color")); th13.assignValueColor(GlobalColor("color"));
th13.SetStyle(line_style); th13.hideTitle(); th13.hideBubble();
addchartbubble(debug && bn == h14bn, th13, slope(h13bn, h13, bn, h), GlobalColor("color"));
def isbetweenh13 = bn > h13bn && bn < h14bn;
# find longest TL in this range
def h14s_1 = if !isbetweenh13 then -100 else if h14s > h14s_1[1] then h14s else h14s_1[1]; # get highest slope up to now
def isShallowesth14s = h14s_1 == h14s;
def tlh13_count = if isbetweenh13 && h14s_1 == h14s_1[1] then tlh13_count[1] + 1 else 0; # get the longest TL
def tlh13_bn = highestall(if isbetweenh13 && isShallowesth14s then bn else nan);
def tlh13_h = highestall(if bn == tlh13_bn then h else nan);
def tlh13_1 = trendline(h13bn, h13, tlh13_bn, tlh13_h);
plot th13_1 = if show_highs && show_historical_long_trendlines then tlh13_1 else nan;
th13_1.SetDefaultColor(GlobalColor("historical_long_color")); th13_1.assignValueColor(GlobalColor("historical_long_color"));
th13_1.SetStyle(historical_line_long_style); th13_1.hideTitle(); th13_1.hideBubble();
th13_1.SetLineWeight(1);
# find ignition candles
def igh13_body = highestall(if isbetweenh13 && isIgnition && isGreen && isShallowesth14s then body else nan);
def igh13_bn = highestall(if igh13_body == body then bn else nan);
def igh13_h = highestall(if bn == igh13_bn then h else nan);
def igh13_tl = trendline(h13bn, h13, igh13_bn, igh13_h);
plot igh13_tlp = if show_highs && show_historical_igniter_trendlines then igh13_tl else nan;
igh13_tlp.SetDefaultColor(GlobalColor("historical_igniter_color")); igh13_tlp.assignValueColor(GlobalColor("historical_igniter_color"));
igh13_tlp.SetStyle(historical_line_igniter_style); igh13_tlp.hideTitle(); igh13_tlp.hideBubble();
igh13_tlp.SetLineWeight(1);
# find most recent spike
def tlh13_peak = if isbetweenh13 && islocalpeak && isShallowesth14s then h else nan;
def tlh13_peak_bn = highestall(if !isnan(tlh13_peak) && isbetweenh13 then bn else nan);
def tlh13_peak_h = highestall(if bn == tlh13_peak_bn then h else nan);
def tlh13_peak_tl = trendline(h13bn, h13, tlh13_peak_bn, tlh13_peak_h);
plot th13_peak = if show_highs && show_historical_peak_trendlines then tlh13_peak_tl else nan;
th13_peak.SetDefaultColor(GlobalColor("historical_peak_color")); th13_peak.assignValueColor(GlobalColor("historical_peak_color"));
th13_peak.SetStyle(historical_line_peak_style); th13_peak.hideTitle(); th13_peak.hideBubble();
th13_peak.SetLineWeight(1);
def h15s = If (ignore_last_bar && bn > h14bn, slope(h14bn, h14, bn, h), nan);
def h15 = HighestAll(If (lastbncheck && bn > h14bn && h15s == HighestAll(h15s), h, nan));
def h15bn = HighestAll(If(h15 == h, bn, nan));
plot h15p = If (bn == h15bn && show_points, h15, nan); h15p.hideTitle(); h15p.hideBubble();
h15p.SetStyle(Curve.POINTS);
h15p.SetDefaultColor(GlobalColor("color")); h15p.assignValueColor(GlobalColor("color"));
h15p.SetLineWeight(1);
def tlh14 = trendline(h14bn, h14, h15bn, h15);
plot th14 = if show_highs then tlh14 else nan;
th14.SetDefaultColor(GlobalColor("color")); th14.assignValueColor(GlobalColor("color"));
th14.SetStyle(line_style); th14.hideTitle(); th14.hideBubble();
addchartbubble(debug && bn == h15bn, th14, slope(h14bn, h14, bn, h), GlobalColor("color"));
def isbetweenh14 = bn > h14bn && bn < h15bn;
# find longest TL in this range
def h15s_1 = if !isbetweenh14 then -100 else if h15s > h15s_1[1] then h15s else h15s_1[1]; # get highest slope up to now
def isShallowesth15s = h15s_1 == h15s;
def tlh14_count = if isbetweenh14 && h15s_1 == h15s_1[1] then tlh14_count[1] + 1 else 0; # get the longest TL
def tlh14_bn = highestall(if isbetweenh14 && isShallowesth15s then bn else nan);
def tlh14_h = highestall(if bn == tlh14_bn then h else nan);
def tlh14_1 = trendline(h14bn, h14, tlh14_bn, tlh14_h);
plot th14_1 = if show_highs && show_historical_long_trendlines then tlh14_1 else nan;
th14_1.SetDefaultColor(GlobalColor("historical_long_color")); th14_1.assignValueColor(GlobalColor("historical_long_color"));
th14_1.SetStyle(historical_line_long_style); th14_1.hideTitle(); th14_1.hideBubble();
th14_1.SetLineWeight(1);
# find ignition candles
def igh14_body = highestall(if isbetweenh14 && isIgnition && isGreen && isShallowesth15s then body else nan);
def igh14_bn = highestall(if igh14_body == body then bn else nan);
def igh14_h = highestall(if bn == igh14_bn then h else nan);
def igh14_tl = trendline(h14bn, h14, igh14_bn, igh14_h);
plot igh14_tlp = if show_highs && show_historical_igniter_trendlines then igh14_tl else nan;
igh14_tlp.SetDefaultColor(GlobalColor("historical_igniter_color")); igh14_tlp.assignValueColor(GlobalColor("historical_igniter_color"));
igh14_tlp.SetStyle(historical_line_igniter_style); igh14_tlp.hideTitle(); igh14_tlp.hideBubble();
igh14_tlp.SetLineWeight(1);
# find most recent spike
def tlh14_peak = if isbetweenh14 && islocalpeak && isShallowesth15s then h else nan;
def tlh14_peak_bn = highestall(if !isnan(tlh14_peak) && isbetweenh14 then bn else nan);
def tlh14_peak_h = highestall(if bn == tlh14_peak_bn then h else nan);
def tlh14_peak_tl = trendline(h14bn, h14, tlh14_peak_bn, tlh14_peak_h);
plot th14_peak = if show_highs && show_historical_peak_trendlines then tlh14_peak_tl else nan;
th14_peak.SetDefaultColor(GlobalColor("historical_peak_color")); th14_peak.assignValueColor(GlobalColor("historical_peak_color"));
th14_peak.SetStyle(historical_line_peak_style); th14_peak.hideTitle(); th14_peak.hideBubble();
th14_peak.SetLineWeight(1);
def l1c = If (bn > lastbn - frombar, If (IsNaN(l1c[1]) or l1c[1] <= 0 or l < l1c[1], l, l1c[1]), l1c[1]);
def l1 = GetValue(l1c, lastbnoffset);
def l1bn = HighestAll(If(l1 == l, bn, nan));
plot l1p = If (bn == l1bn && show_points, l1, nan); l1p.hideTitle(); l1p.hideBubble();
l1p.SetStyle(Curve.POINTS);
l1p.SetDefaultColor(GlobalColor("color")); l1p.assignValueColor(GlobalColor("color"));
l1p.SetLineWeight(1);
plot tl0 = if show_first_bar_trend then trendline(l1bn, l1, l1bn + 1, HighestAll(If (bn[1] == l1bn, l, nan))) else nan;
tl0.SetDefaultColor(GlobalColor("color")); tl0.assignValueColor(GlobalColor("color"));
tl0.SetStyle(line_style);
tl0.SetLineWeight(3);
def l2s = If (ignore_last_bar && bn > l1bn, slope(l1bn, l1, bn, l), nan);
def l2 = LowestAll(If (lastbncheck && bn > l1bn && l2s == LowestAll(l2s), l, nan));
def l2bn = HighestAll(If(l2 == l, bn, nan));
plot l2p = If (bn == l2bn && show_points, l2, nan); l2p.hideTitle(); l2p.hideBubble();
l2p.SetStyle(Curve.POINTS);
l2p.SetDefaultColor(GlobalColor("color")); l2p.assignValueColor(GlobalColor("color"));
l2p.SetLineWeight(3);
def tll1 = trendline(l1bn, l1, l2bn, l2);
plot tl1 = if show_lows then tll1 else nan;
tl1.SetDefaultColor(GlobalColor("color")); tl1.assignValueColor(GlobalColor("color"));
tl1.SetStyle(line_style); tl1.hideTitle(); tl1.hideBubble();
tl1.SetLineWeight(3);
addchartbubble(debug && bn == l2bn, tl1, slope(l1bn, l1, bn, l), GlobalColor("color"), no);
def isbetweenl1 = bn > l1bn && bn < l2bn;
def islocaltrough = l == lowest(l, historical_peak_range) && l < lowest(l[-historical_peak_range], historical_peak_range);
# find longest TL in this range
def l2s_1 = if !isbetweenl1 then 100 else if l2s < l2s_1[1] then l2s else l2s_1[1]; # get highest slope up to now
def isShallowestl2s = l2s_1 == l2s;
def tll1_count = if isbetweenl1 && l2s_1 == l2s_1[1] then tll1_count[1] + 1 else 0; # get the longest TL
def tll1_bn = highestall(if isbetweenl1 && isShallowestl2s then bn else nan);
def tll1_l = highestall(if bn == tll1_bn then l else nan);
def tll1_1 = trendline(l1bn, l1, tll1_bn, tll1_l);
plot tl1_1 = if show_lows && show_historical_long_trendlines then tll1_1 else nan;
tl1_1.SetDefaultColor(GlobalColor("historical_long_color")); tl1_1.assignValueColor(GlobalColor("historical_long_color"));
tl1_1.SetStyle(historical_line_long_style); tl1_1.hideTitle(); tl1_1.hideBubble();
tl1_1.SetLineWeight(3);
# find ignition candles
def igl1_body = highestall(if isbetweenl1 && isIgnition && !isGreen && isShallowestl2s then body else nan);
def igl1_bn = highestall(if igl1_body == body then bn else nan);
def igl1_l = highestall(if bn == igl1_bn then l else nan);
def igl1_tl = trendline(l1bn, l1, igl1_bn, igl1_l);
plot igl1_tlp = if show_lows && show_historical_igniter_trendlines then igl1_tl else nan;
igl1_tlp.SetDefaultColor(GlobalColor("historical_igniter_color")); igl1_tlp.assignValueColor(GlobalColor("historical_igniter_color"));
igl1_tlp.SetStyle(historical_line_igniter_style); igh1_tlp.hideTitle(); igl1_tlp.hideBubble();
igl1_tlp.SetLineWeight(3);
# find most recent spike
def tll1_trough = if isbetweenl1 && islocaltrough && isShallowestl2s then l else nan;
def tll1_trough_bn = highestall(if !isnan(tll1_trough) && isbetweenl1 then bn else nan);
def tll1_trough_l = highestall(if bn == tll1_trough_bn then l else nan);
def tll1_trough_tl = trendline(l1bn, l1, tll1_trough_bn, tll1_trough_l);
plot tl1_trough = if show_highs && show_historical_peak_trendlines then tll1_trough_tl else nan;
tl1_trough.SetDefaultColor(GlobalColor("historical_peak_color")); tl1_trough.assignValueColor(GlobalColor("historical_peak_color"));
tl1_trough.SetStyle(historical_line_peak_style); tl1_trough.hideTitle(); tl1_trough.hideBubble();
tl1_trough.SetLineWeight(3);
def l3s = If (ignore_last_bar && bn > l2bn, slope(l2bn, l2, bn, l), nan);
def l3 = LowestAll(If (lastbncheck && bn > l2bn && l3s == LowestAll(l3s), l, nan));
def l3bn = HighestAll(If(l3 == l, bn, nan));
plot l3p = If (bn == l3bn && show_points, l3, nan); l3p.hideTitle(); l3p.hideBubble();
l3p.SetStyle(Curve.POINTS);
l3p.SetDefaultColor(GlobalColor("color")); l3p.assignValueColor(GlobalColor("color"));
l3p.SetLineWeight(3);
def tll2 = trendline(l2bn, l2, l3bn, l3);
plot tl2 = if show_lows then tll2 else nan;
tl2.SetDefaultColor(GlobalColor("color")); tl2.assignValueColor(GlobalColor("color"));
tl2.SetStyle(line_style); tl2.hideTitle(); tl2.hideBubble();
tl2.SetLineWeight(3);
addchartbubble(debug && bn == l3bn, tl2, slope(l2bn, l2, bn, l), GlobalColor("color"), no);
def isbetweenl2 = bn > l2bn && bn < l3bn;
# find longest TL in this range
def l3s_1 = if !isbetweenl2 then 100 else if l3s < l3s_1[1] then l3s else l3s_1[1]; # get highest slope up to now
def isShallowestl3s = l3s_1 == l3s;
def tll2_count = if isbetweenl2 && l3s_1 == l3s_1[1] then tll2_count[1] + 1 else 0; # get the longest TL
def tll2_bn = highestall(if isbetweenl2 && isShallowestl3s then bn else nan);
def tll2_l = highestall(if bn == tll2_bn then l else nan);
def tll2_1 = trendline(l2bn, l2, tll2_bn, tll2_l);
plot tl2_1 = if show_lows && show_historical_long_trendlines then tll2_1 else nan;
tl2_1.SetDefaultColor(GlobalColor("historical_long_color")); tl2_1.assignValueColor(GlobalColor("historical_long_color"));
tl2_1.SetStyle(historical_line_long_style); tl2_1.hideTitle(); tl2_1.hideBubble();
tl2_1.SetLineWeight(3);
# find ignition candles
def igl2_body = highestall(if isbetweenl2 && isIgnition && !isGreen && isShallowestl3s then body else nan);
def igl2_bn = highestall(if igl2_body == body then bn else nan);
def igl2_l = highestall(if bn == igl2_bn then l else nan);
def igl2_tl = trendline(l2bn, l2, igl2_bn, igl2_l);
plot igl2_tlp = if show_lows && show_historical_igniter_trendlines then igl2_tl else nan;
igl2_tlp.SetDefaultColor(GlobalColor("historical_igniter_color")); igl2_tlp.assignValueColor(GlobalColor("historical_igniter_color"));
igl2_tlp.SetStyle(historical_line_igniter_style); igh2_tlp.hideTitle(); igl2_tlp.hideBubble();
igl2_tlp.SetLineWeight(3);
# find most recent spike
def tll2_trough = if isbetweenl2 && islocaltrough && isShallowestl3s then l else nan;
def tll2_trough_bn = highestall(if !isnan(tll2_trough) && isbetweenl2 then bn else nan);
def tll2_trough_l = highestall(if bn == tll2_trough_bn then l else nan);
def tll2_trough_tl = trendline(l2bn, l2, tll2_trough_bn, tll2_trough_l);
plot tl2_trough = if show_highs && show_historical_peak_trendlines then tll2_trough_tl else nan;
tl2_trough.SetDefaultColor(GlobalColor("historical_peak_color")); tl2_trough.assignValueColor(GlobalColor("historical_peak_color"));
tl2_trough.SetStyle(historical_line_peak_style); tl2_trough.hideTitle(); tl2_trough.hideBubble();
tl2_trough.SetLineWeight(3);
def l4s = If (ignore_last_bar && bn > l3bn, slope(l3bn, l3, bn, l), nan);
def l4 = LowestAll(If (lastbncheck && bn > l3bn && l4s == LowestAll(l4s), l, nan));
def l4bn = HighestAll(If(l4 == l, bn, nan));
plot l4p = If (bn == l4bn && show_points, l4, nan); l4p.hideTitle(); l4p.hideBubble();
l4p.SetStyle(Curve.POINTS);
l4p.SetDefaultColor(GlobalColor("color")); l4p.assignValueColor(GlobalColor("color"));
l4p.SetLineWeight(1);
def tll3 = trendline(l3bn, l3, l4bn, l4);
plot tl3 = if show_lows then tll3 else nan;
tl3.SetDefaultColor(GlobalColor("color")); tl3.assignValueColor(GlobalColor("color"));
tl3.SetStyle(line_style); tl3.hideTitle(); tl3.hideBubble();
addchartbubble(debug && bn == l4bn, tl3, slope(l3bn, l3, bn, l), GlobalColor("color"), no);
def isbetweenl3 = bn > l3bn && bn < l4bn;
# find longest TL in this range
def l4s_1 = if !isbetweenl3 then 100 else if l4s < l4s_1[1] then l4s else l4s_1[1]; # get highest slope up to now
def isShallowestl4s = l4s_1 == l4s;
def tll3_count = if isbetweenl3 && l4s_1 == l4s_1[1] then tll3_count[1] + 1 else 0; # get the longest TL
def tll3_bn = highestall(if isbetweenl3 && isShallowestl4s then bn else nan);
def tll3_l = highestall(if bn == tll3_bn then l else nan);
def tll3_1 = trendline(l3bn, l3, tll3_bn, tll3_l);
plot tl3_1 = if show_lows && show_historical_long_trendlines then tll3_1 else nan;
tl3_1.SetDefaultColor(GlobalColor("historical_long_color")); tl3_1.assignValueColor(GlobalColor("historical_long_color"));
tl3_1.SetStyle(historical_line_long_style); tl3_1.hideTitle(); tl3_1.hideBubble();
tl3_1.SetLineWeight(1);
# find ignition candles
def igl3_body = highestall(if isbetweenl3 && isIgnition && !isGreen && isShallowestl4s then body else nan);
def igl3_bn = highestall(if igl3_body == body then bn else nan);
def igl3_l = highestall(if bn == igl3_bn then l else nan);
def igl3_tl = trendline(l3bn, l3, igl3_bn, igl3_l);
plot igl3_tlp = if show_lows && show_historical_igniter_trendlines then igl3_tl else nan;
igl3_tlp.SetDefaultColor(GlobalColor("historical_igniter_color")); igl3_tlp.assignValueColor(GlobalColor("historical_igniter_color"));
igl3_tlp.SetStyle(historical_line_igniter_style); igh3_tlp.hideTitle(); igl3_tlp.hideBubble();
igl3_tlp.SetLineWeight(1);
# find most recent spike
def tll3_trough = if isbetweenl3 && islocaltrough && isShallowestl4s then l else nan;
def tll3_trough_bn = highestall(if !isnan(tll3_trough) && isbetweenl3 then bn else nan);
def tll3_trough_l = highestall(if bn == tll3_trough_bn then l else nan);
def tll3_trough_tl = trendline(l3bn, l3, tll3_trough_bn, tll3_trough_l);
plot tl3_trough = if show_highs && show_historical_peak_trendlines then tll3_trough_tl else nan;
tl3_trough.SetDefaultColor(GlobalColor("historical_peak_color")); tl3_trough.assignValueColor(GlobalColor("historical_peak_color"));
tl3_trough.SetStyle(historical_line_peak_style); tl3_trough.hideTitle(); tl3_trough.hideBubble();
tl3_trough.SetLineWeight(1);
def l5s = If (ignore_last_bar && bn > l4bn, slope(l4bn, l4, bn, l), nan);
def l5 = LowestAll(If (lastbncheck && bn > l4bn && l5s == LowestAll(l5s), l, nan));
def l5bn = HighestAll(If(l5 == l, bn, nan));
plot l5p = If (bn == l5bn && show_points, l5, nan); l5p.hideTitle(); l5p.hideBubble();
l5p.SetStyle(Curve.POINTS);
l5p.SetDefaultColor(GlobalColor("color")); l5p.assignValueColor(GlobalColor("color"));
l5p.SetLineWeight(1);
def tll4 = trendline(l4bn, l4, l5bn, l5);
plot tl4 = if show_lows then tll4 else nan;
tl4.SetDefaultColor(GlobalColor("color")); tl4.assignValueColor(GlobalColor("color"));
tl4.SetStyle(line_style); tl4.hideTitle(); tl4.hideBubble();
addchartbubble(debug && bn == l5bn, tl4, slope(l4bn, l4, bn, l), GlobalColor("color"), no);
def isbetweenl4 = bn > l4bn && bn < l5bn;
# find longest TL in this range
def l5s_1 = if !isbetweenl4 then 100 else if l5s < l5s_1[1] then l5s else l5s_1[1]; # get highest slope up to now
def isShallowestl5s = l5s_1 == l5s;
def tll4_count = if isbetweenl4 && l5s_1 == l5s_1[1] then tll4_count[1] + 1 else 0; # get the longest TL
def tll4_bn = highestall(if isbetweenl4 && isShallowestl5s then bn else nan);
def tll4_l = highestall(if bn == tll4_bn then l else nan);
def tll4_1 = trendline(l4bn, l4, tll4_bn, tll4_l);
plot tl4_1 = if show_lows && show_historical_long_trendlines then tll4_1 else nan;
tl4_1.SetDefaultColor(GlobalColor("historical_long_color")); tl4_1.assignValueColor(GlobalColor("historical_long_color"));
tl4_1.SetStyle(historical_line_long_style); tl4_1.hideTitle(); tl4_1.hideBubble();
tl4_1.SetLineWeight(1);
# find ignition candles
def igl4_body = highestall(if isbetweenl4 && isIgnition && !isGreen && isShallowestl5s then body else nan);
def igl4_bn = highestall(if igl4_body == body then bn else nan);
def igl4_l = highestall(if bn == igl4_bn then l else nan);
def igl4_tl = trendline(l4bn, l4, igl4_bn, igl4_l);
plot igl4_tlp = if show_lows && show_historical_igniter_trendlines then igl4_tl else nan;
igl4_tlp.SetDefaultColor(GlobalColor("historical_igniter_color")); igl4_tlp.assignValueColor(GlobalColor("historical_igniter_color"));
igl4_tlp.SetStyle(historical_line_igniter_style); igh4_tlp.hideTitle(); igl4_tlp.hideBubble();
igl4_tlp.SetLineWeight(1);
# find most recent spike
def tll4_trough = if isbetweenl4 && islocaltrough && isShallowestl5s then l else nan;
def tll4_trough_bn = highestall(if !isnan(tll4_trough) && isbetweenl4 then bn else nan);
def tll4_trough_l = highestall(if bn == tll4_trough_bn then l else nan);
def tll4_trough_tl = trendline(l4bn, l4, tll4_trough_bn, tll4_trough_l);
plot tl4_trough = if show_highs && show_historical_peak_trendlines then tll4_trough_tl else nan;
tl4_trough.SetDefaultColor(GlobalColor("historical_peak_color")); tl4_trough.assignValueColor(GlobalColor("historical_peak_color"));
tl4_trough.SetStyle(historical_line_peak_style); tl4_trough.hideTitle(); tl4_trough.hideBubble();
tl4_trough.SetLineWeight(1);
def l6s = If (ignore_last_bar && bn > l5bn, slope(l5bn, l5, bn, l), nan);
def l6 = LowestAll(If (lastbncheck && bn > l5bn && l6s == LowestAll(l6s), l, nan));
def l6bn = HighestAll(If(l6 == l, bn, nan));
plot l6p = If (bn == l6bn && show_points, l6, nan); l6p.hideTitle(); l6p.hideBubble();
l6p.SetStyle(Curve.POINTS);
l6p.SetDefaultColor(GlobalColor("color")); l6p.assignValueColor(GlobalColor("color"));
l6p.SetLineWeight(1);
def tll5 = trendline(l5bn, l5, l6bn, l6);
plot tl5 = if show_lows then tll5 else nan;
tl5.SetDefaultColor(GlobalColor("color")); tl5.assignValueColor(GlobalColor("color"));
tl5.SetStyle(line_style); tl5.hideTitle(); tl5.hideBubble();
addchartbubble(debug && bn == l6bn, tl5, slope(l5bn, l5, bn, l), GlobalColor("color"), no);
def isbetweenl5 = bn > l5bn && bn < l6bn;
# find longest TL in this range
def l6s_1 = if !isbetweenl5 then 100 else if l6s < l6s_1[1] then l6s else l6s_1[1]; # get highest slope up to now
def isShallowestl6s = l6s_1 == l6s;
def tll5_count = if isbetweenl5 && l6s_1 == l6s_1[1] then tll5_count[1] + 1 else 0; # get the longest TL
def tll5_bn = highestall(if isbetweenl5 && isShallowestl6s then bn else nan);
def tll5_l = highestall(if bn == tll5_bn then l else nan);
def tll5_1 = trendline(l5bn, l5, tll5_bn, tll5_l);
plot tl5_1 = if show_lows && show_historical_long_trendlines then tll5_1 else nan;
tl5_1.SetDefaultColor(GlobalColor("historical_long_color")); tl5_1.assignValueColor(GlobalColor("historical_long_color"));
tl5_1.SetStyle(historical_line_long_style); tl5_1.hideTitle(); tl5_1.hideBubble();
tl5_1.SetLineWeight(1);
# find ignition candles
def igl5_body = highestall(if isbetweenl5 && isIgnition && !isGreen && isShallowestl6s then body else nan);
def igl5_bn = highestall(if igl5_body == body then bn else nan);
def igl5_l = highestall(if bn == igl5_bn then l else nan);
def igl5_tl = trendline(l5bn, l5, igl5_bn, igl5_l);
plot igl5_tlp = if show_lows && show_historical_igniter_trendlines then igl5_tl else nan;
igl5_tlp.SetDefaultColor(GlobalColor("historical_igniter_color")); igl5_tlp.assignValueColor(GlobalColor("historical_igniter_color"));
igl5_tlp.SetStyle(historical_line_igniter_style); igh5_tlp.hideTitle(); igl5_tlp.hideBubble();
igl5_tlp.SetLineWeight(1);
# find most recent spike
def tll5_trough = if isbetweenl5 && islocaltrough && isShallowestl6s then l else nan;
def tll5_trough_bn = highestall(if !isnan(tll5_trough) && isbetweenl5 then bn else nan);
def tll5_trough_l = highestall(if bn == tll5_trough_bn then l else nan);
def tll5_trough_tl = trendline(l5bn, l5, tll5_trough_bn, tll5_trough_l);
plot tl5_trough = if show_highs && show_historical_peak_trendlines then tll5_trough_tl else nan;
tl5_trough.SetDefaultColor(GlobalColor("historical_peak_color")); tl5_trough.assignValueColor(GlobalColor("historical_peak_color"));
tl5_trough.SetStyle(historical_line_peak_style); tl5_trough.hideTitle(); tl5_trough.hideBubble();
tl5_trough.SetLineWeight(1);
def l7s = If (ignore_last_bar && bn > l6bn, slope(l6bn, l6, bn, l), nan);
def l7 = LowestAll(If (lastbncheck && bn > l6bn && l7s == LowestAll(l7s), l, nan));
def l7bn = HighestAll(If(l7 == l, bn, nan));
plot l7p = If (bn == l7bn && show_points, l7, nan); l7p.hideTitle(); l7p.hideBubble();
l7p.SetStyle(Curve.POINTS);
l7p.SetDefaultColor(GlobalColor("color")); l7p.assignValueColor(GlobalColor("color"));
l7p.SetLineWeight(1);
def tll6 = trendline(l6bn, l6, l7bn, l7);
plot tl6 = if show_lows then tll6 else nan;
tl6.SetDefaultColor(GlobalColor("color")); tl6.assignValueColor(GlobalColor("color"));
tl6.SetStyle(line_style); tl6.hideTitle(); tl6.hideBubble();
addchartbubble(debug && bn == l7bn, tl6, slope(l6bn, l6, bn, l), GlobalColor("color"), no);
def isbetweenl6 = bn > l6bn && bn < l7bn;
# find longest TL in this range
def l7s_1 = if !isbetweenl6 then 100 else if l7s < l7s_1[1] then l7s else l7s_1[1]; # get highest slope up to now
def isShallowestl7s = l7s_1 == l7s;
def tll6_count = if isbetweenl6 && l7s_1 == l7s_1[1] then tll6_count[1] + 1 else 0; # get the longest TL
def tll6_bn = highestall(if isbetweenl6 && isShallowestl7s then bn else nan);
def tll6_l = highestall(if bn == tll6_bn then l else nan);
def tll6_1 = trendline(l6bn, l6, tll6_bn, tll6_l);
plot tl6_1 = if show_lows && show_historical_long_trendlines then tll6_1 else nan;
tl6_1.SetDefaultColor(GlobalColor("historical_long_color")); tl6_1.assignValueColor(GlobalColor("historical_long_color"));
tl6_1.SetStyle(historical_line_long_style); tl6_1.hideTitle(); tl6_1.hideBubble();
tl6_1.SetLineWeight(1);
# find ignition candles
def igl6_body = highestall(if isbetweenl6 && isIgnition && !isGreen && isShallowestl7s then body else nan);
def igl6_bn = highestall(if igl6_body == body then bn else nan);
def igl6_l = highestall(if bn == igl6_bn then l else nan);
def igl6_tl = trendline(l6bn, l6, igl6_bn, igl6_l);
plot igl6_tlp = if show_lows && show_historical_igniter_trendlines then igl6_tl else nan;
igl6_tlp.SetDefaultColor(GlobalColor("historical_igniter_color")); igl6_tlp.assignValueColor(GlobalColor("historical_igniter_color"));
igl6_tlp.SetStyle(historical_line_igniter_style); igh6_tlp.hideTitle(); igl6_tlp.hideBubble();
igl6_tlp.SetLineWeight(1);
# find most recent spike
def tll6_trough = if isbetweenl6 && islocaltrough && isShallowestl7s then l else nan;
def tll6_trough_bn = highestall(if !isnan(tll6_trough) && isbetweenl6 then bn else nan);
def tll6_trough_l = highestall(if bn == tll6_trough_bn then l else nan);
def tll6_trough_tl = trendline(l6bn, l6, tll6_trough_bn, tll6_trough_l);
plot tl6_trough = if show_highs && show_historical_peak_trendlines then tll6_trough_tl else nan;
tl6_trough.SetDefaultColor(GlobalColor("historical_peak_color")); tl6_trough.assignValueColor(GlobalColor("historical_peak_color"));
tl6_trough.SetStyle(historical_line_peak_style); tl6_trough.hideTitle(); tl6_trough.hideBubble();
tl6_trough.SetLineWeight(1);
def l8s = If (ignore_last_bar && bn > l7bn, slope(l7bn, l7, bn, l), nan);
def l8 = LowestAll(If (lastbncheck && bn > l7bn && l8s == LowestAll(l8s), l, nan));
def l8bn = HighestAll(If(l8 == l, bn, nan));
plot l8p = If (bn == l8bn && show_points, l8, nan); l8p.hideTitle(); l8p.hideBubble();
l8p.SetStyle(Curve.POINTS);
l8p.SetDefaultColor(GlobalColor("color")); l8p.assignValueColor(GlobalColor("color"));
l8p.SetLineWeight(1);
def tll7 = trendline(l7bn, l7, l8bn, l8);
plot tl7 = if show_lows then tll7 else nan;
tl7.SetDefaultColor(GlobalColor("color")); tl7.assignValueColor(GlobalColor("color"));
tl7.SetStyle(line_style); tl7.hideTitle(); tl7.hideBubble();
addchartbubble(debug && bn == l8bn, tl7, slope(l7bn, l7, bn, l), GlobalColor("color"), no);
def isbetweenl7 = bn > l7bn && bn < l8bn;
# find longest TL in this range
def l8s_1 = if !isbetweenl7 then 100 else if l8s < l8s_1[1] then l8s else l8s_1[1]; # get highest slope up to now
def isShallowestl8s = l8s_1 == l8s;
def tll7_count = if isbetweenl7 && l8s_1 == l8s_1[1] then tll7_count[1] + 1 else 0; # get the longest TL
def tll7_bn = highestall(if isbetweenl7 && isShallowestl8s then bn else nan);
def tll7_l = highestall(if bn == tll7_bn then l else nan);
def tll7_1 = trendline(l7bn, l7, tll7_bn, tll7_l);
plot tl7_1 = if show_lows && show_historical_long_trendlines then tll7_1 else nan;
tl7_1.SetDefaultColor(GlobalColor("historical_long_color")); tl7_1.assignValueColor(GlobalColor("historical_long_color"));
tl7_1.SetStyle(historical_line_long_style); tl7_1.hideTitle(); tl7_1.hideBubble();
tl7_1.SetLineWeight(1);
# find ignition candles
def igl7_body = highestall(if isbetweenl7 && isIgnition && !isGreen && isShallowestl8s then body else nan);
def igl7_bn = highestall(if igl7_body == body then bn else nan);
def igl7_l = highestall(if bn == igl7_bn then l else nan);
def igl7_tl = trendline(l7bn, l7, igl7_bn, igl7_l);
plot igl7_tlp = if show_lows && show_historical_igniter_trendlines then igl7_tl else nan;
igl7_tlp.SetDefaultColor(GlobalColor("historical_igniter_color")); igl7_tlp.assignValueColor(GlobalColor("historical_igniter_color"));
igl7_tlp.SetStyle(historical_line_igniter_style); igh7_tlp.hideTitle(); igl7_tlp.hideBubble();
igl7_tlp.SetLineWeight(1);
# find most recent spike
def tll7_trough = if isbetweenl7 && islocaltrough && isShallowestl8s then l else nan;
def tll7_trough_bn = highestall(if !isnan(tll7_trough) && isbetweenl7 then bn else nan);
def tll7_trough_l = highestall(if bn == tll7_trough_bn then l else nan);
def tll7_trough_tl = trendline(l7bn, l7, tll7_trough_bn, tll7_trough_l);
plot tl7_trough = if show_highs && show_historical_peak_trendlines then tll7_trough_tl else nan;
tl7_trough.SetDefaultColor(GlobalColor("historical_peak_color")); tl7_trough.assignValueColor(GlobalColor("historical_peak_color"));
tl7_trough.SetStyle(historical_line_peak_style); tl7_trough.hideTitle(); tl7_trough.hideBubble();
tl7_trough.SetLineWeight(1);
def l9s = If (ignore_last_bar && bn > l8bn, slope(l8bn, l8, bn, l), nan);
def l9 = LowestAll(If (lastbncheck && bn > l8bn && l9s == LowestAll(l9s), l, nan));
def l9bn = HighestAll(If(l9 == l, bn, nan));
plot l9p = If (bn == l9bn && show_points, l9, nan); l9p.hideTitle(); l9p.hideBubble();
l9p.SetStyle(Curve.POINTS);
l9p.SetDefaultColor(GlobalColor("color")); l9p.assignValueColor(GlobalColor("color"));
l9p.SetLineWeight(1);
def tll8 = trendline(l8bn, l8, l9bn, l9);
plot tl8 = if show_lows then tll8 else nan;
tl8.SetDefaultColor(GlobalColor("color")); tl8.assignValueColor(GlobalColor("color"));
tl8.SetStyle(line_style); tl8.hideTitle(); tl8.hideBubble();
addchartbubble(debug && bn == l9bn, tl8, slope(l8bn, l8, bn, l), GlobalColor("color"), no);
def isbetweenl8 = bn > l8bn && bn < l9bn;
# find longest TL in this range
def l9s_1 = if !isbetweenl8 then 100 else if l9s < l9s_1[1] then l9s else l9s_1[1]; # get highest slope up to now
def isShallowestl9s = l9s_1 == l9s;
def tll8_count = if isbetweenl8 && l9s_1 == l9s_1[1] then tll8_count[1] + 1 else 0; # get the longest TL
def tll8_bn = highestall(if isbetweenl8 && isShallowestl9s then bn else nan);
def tll8_l = highestall(if bn == tll8_bn then l else nan);
def tll8_1 = trendline(l8bn, l8, tll8_bn, tll8_l);
plot tl8_1 = if show_lows && show_historical_long_trendlines then tll8_1 else nan;
tl8_1.SetDefaultColor(GlobalColor("historical_long_color")); tl8_1.assignValueColor(GlobalColor("historical_long_color"));
tl8_1.SetStyle(historical_line_long_style); tl8_1.hideTitle(); tl8_1.hideBubble();
tl8_1.SetLineWeight(1);
# find ignition candles
def igl8_body = highestall(if isbetweenl8 && isIgnition && !isGreen && isShallowestl9s then body else nan);
def igl8_bn = highestall(if igl8_body == body then bn else nan);
def igl8_l = highestall(if bn == igl8_bn then l else nan);
def igl8_tl = trendline(l8bn, l8, igl8_bn, igl8_l);
plot igl8_tlp = if show_lows && show_historical_igniter_trendlines then igl8_tl else nan;
igl8_tlp.SetDefaultColor(GlobalColor("historical_igniter_color")); igl8_tlp.assignValueColor(GlobalColor("historical_igniter_color"));
igl8_tlp.SetStyle(historical_line_igniter_style); igh8_tlp.hideTitle(); igl8_tlp.hideBubble();
igl8_tlp.SetLineWeight(1);
# find most recent spike
def tll8_trough = if isbetweenl8 && islocaltrough && isShallowestl9s then l else nan;
def tll8_trough_bn = highestall(if !isnan(tll8_trough) && isbetweenl8 then bn else nan);
def tll8_trough_l = highestall(if bn == tll8_trough_bn then l else nan);
def tll8_trough_tl = trendline(l8bn, l8, tll8_trough_bn, tll8_trough_l);
plot tl8_trough = if show_highs && show_historical_peak_trendlines then tll8_trough_tl else nan;
tl8_trough.SetDefaultColor(GlobalColor("historical_peak_color")); tl8_trough.assignValueColor(GlobalColor("historical_peak_color"));
tl8_trough.SetStyle(historical_line_peak_style); tl8_trough.hideTitle(); tl8_trough.hideBubble();
tl8_trough.SetLineWeight(1);
def l10s = If (ignore_last_bar && bn > l9bn, slope(l9bn, l9, bn, l), nan);
def l10 = LowestAll(If (lastbncheck && bn > l9bn && l10s == LowestAll(l10s), l, nan));
def l10bn = HighestAll(If(l10 == l, bn, nan));
plot l10p = If (bn == l10bn && show_points, l10, nan); l10p.hideTitle(); l10p.hideBubble();
l10p.SetStyle(Curve.POINTS);
l10p.SetDefaultColor(GlobalColor("color")); l10p.assignValueColor(GlobalColor("color"));
l10p.SetLineWeight(1);
def tll9 = trendline(l9bn, l9, l10bn, l10);
plot tl9 = if show_lows then tll9 else nan;
tl9.SetDefaultColor(GlobalColor("color")); tl9.assignValueColor(GlobalColor("color"));
tl9.SetStyle(line_style); tl9.hideTitle(); tl9.hideBubble();
addchartbubble(debug && bn == l10bn, tl9, slope(l9bn, l9, bn, l), GlobalColor("color"), no);
def isbetweenl9 = bn > l9bn && bn < l10bn;
# find longest TL in this range
def l10s_1 = if !isbetweenl9 then 100 else if l10s < l10s_1[1] then l10s else l10s_1[1]; # get highest slope up to now
def isShallowestl10s = l10s_1 == l10s;
def tll9_count = if isbetweenl9 && l10s_1 == l10s_1[1] then tll9_count[1] + 1 else 0; # get the longest TL
def tll9_bn = highestall(if isbetweenl9 && isShallowestl10s then bn else nan);
def tll9_l = highestall(if bn == tll9_bn then l else nan);
def tll9_1 = trendline(l9bn, l9, tll9_bn, tll9_l);
plot tl9_1 = if show_lows && show_historical_long_trendlines then tll9_1 else nan;
tl9_1.SetDefaultColor(GlobalColor("historical_long_color")); tl9_1.assignValueColor(GlobalColor("historical_long_color"));
tl9_1.SetStyle(historical_line_long_style); tl9_1.hideTitle(); tl9_1.hideBubble();
tl9_1.SetLineWeight(1);
# find ignition candles
def igl9_body = highestall(if isbetweenl9 && isIgnition && !isGreen && isShallowestl10s then body else nan);
def igl9_bn = highestall(if igl9_body == body then bn else nan);
def igl9_l = highestall(if bn == igl9_bn then l else nan);
def igl9_tl = trendline(l9bn, l9, igl9_bn, igl9_l);
plot igl9_tlp = if show_lows && show_historical_igniter_trendlines then igl9_tl else nan;
igl9_tlp.SetDefaultColor(GlobalColor("historical_igniter_color")); igl9_tlp.assignValueColor(GlobalColor("historical_igniter_color"));
igl9_tlp.SetStyle(historical_line_igniter_style); igh9_tlp.hideTitle(); igl9_tlp.hideBubble();
igl9_tlp.SetLineWeight(1);
# find most recent spike
def tll9_trough = if isbetweenl9 && islocaltrough && isShallowestl10s then l else nan;
def tll9_trough_bn = highestall(if !isnan(tll9_trough) && isbetweenl9 then bn else nan);
def tll9_trough_l = highestall(if bn == tll9_trough_bn then l else nan);
def tll9_trough_tl = trendline(l9bn, l9, tll9_trough_bn, tll9_trough_l);
plot tl9_trough = if show_highs && show_historical_peak_trendlines then tll9_trough_tl else nan;
tl9_trough.SetDefaultColor(GlobalColor("historical_peak_color")); tl9_trough.assignValueColor(GlobalColor("historical_peak_color"));
tl9_trough.SetStyle(historical_line_peak_style); tl9_trough.hideTitle(); tl9_trough.hideBubble();
tl9_trough.SetLineWeight(1);
def l11s = If (ignore_last_bar && bn > l10bn, slope(l10bn, l10, bn, l), nan);
def l11 = LowestAll(If (lastbncheck && bn > l10bn && l11s == LowestAll(l11s), l, nan));
def l11bn = HighestAll(If(l11 == l, bn, nan));
plot l11p = If (bn == l11bn && show_points, l11, nan); l11p.hideTitle(); l11p.hideBubble();
l11p.SetStyle(Curve.POINTS);
l11p.SetDefaultColor(GlobalColor("color")); l11p.assignValueColor(GlobalColor("color"));
l11p.SetLineWeight(1);
def tll10 = trendline(l10bn, l10, l11bn, l11);
plot tl10 = if show_lows then tll10 else nan;
tl10.SetDefaultColor(GlobalColor("color")); tl10.assignValueColor(GlobalColor("color"));
tl10.SetStyle(line_style); tl10.hideTitle(); tl10.hideBubble();
addchartbubble(debug && bn == l11bn, tl10, slope(l10bn, l10, bn, l), GlobalColor("color"), no);
def isbetweenl10 = bn > l10bn && bn < l11bn;
# find longest TL in this range
def l11s_1 = if !isbetweenl10 then 100 else if l11s < l11s_1[1] then l11s else l11s_1[1]; # get highest slope up to now
def isShallowestl11s = l11s_1 == l11s;
def tll10_count = if isbetweenl10 && l11s_1 == l11s_1[1] then tll10_count[1] + 1 else 0; # get the longest TL
def tll10_bn = highestall(if isbetweenl10 && isShallowestl11s then bn else nan);
def tll10_l = highestall(if bn == tll10_bn then l else nan);
def tll10_1 = trendline(l10bn, l10, tll10_bn, tll10_l);
plot tl10_1 = if show_lows && show_historical_long_trendlines then tll10_1 else nan;
tl10_1.SetDefaultColor(GlobalColor("historical_long_color")); tl10_1.assignValueColor(GlobalColor("historical_long_color"));
tl10_1.SetStyle(historical_line_long_style); tl10_1.hideTitle(); tl10_1.hideBubble();
tl10_1.SetLineWeight(1);
# find ignition candles
def igl10_body = highestall(if isbetweenl10 && isIgnition && !isGreen && isShallowestl11s then body else nan);
def igl10_bn = highestall(if igl10_body == body then bn else nan);
def igl10_l = highestall(if bn == igl10_bn then l else nan);
def igl10_tl = trendline(l10bn, l10, igl10_bn, igl10_l);
plot igl10_tlp = if show_lows && show_historical_igniter_trendlines then igl10_tl else nan;
igl10_tlp.SetDefaultColor(GlobalColor("historical_igniter_color")); igl10_tlp.assignValueColor(GlobalColor("historical_igniter_color"));
igl10_tlp.SetStyle(historical_line_igniter_style); igh10_tlp.hideTitle(); igl10_tlp.hideBubble();
igl10_tlp.SetLineWeight(1);
# find most recent spike
def tll10_trough = if isbetweenl10 && islocaltrough && isShallowestl11s then l else nan;
def tll10_trough_bn = highestall(if !isnan(tll10_trough) && isbetweenl10 then bn else nan);
def tll10_trough_l = highestall(if bn == tll10_trough_bn then l else nan);
def tll10_trough_tl = trendline(l10bn, l10, tll10_trough_bn, tll10_trough_l);
plot tl10_trough = if show_highs && show_historical_peak_trendlines then tll10_trough_tl else nan;
tl10_trough.SetDefaultColor(GlobalColor("historical_peak_color")); tl10_trough.assignValueColor(GlobalColor("historical_peak_color"));
tl10_trough.SetStyle(historical_line_peak_style); tl10_trough.hideTitle(); tl10_trough.hideBubble();
tl10_trough.SetLineWeight(1);
def l12s = If (ignore_last_bar && bn > l11bn, slope(l11bn, l10, bn, l), nan);
def l12 = LowestAll(If (lastbncheck && bn > l11bn && l12s == LowestAll(l12s), l, nan));
def l12bn = HighestAll(If(l12 == l, bn, nan));
plot l12p = If (bn == l12bn && show_points, l12, nan); l12p.hideTitle(); l12p.hideBubble();
l12p.SetStyle(Curve.POINTS);
l12p.SetDefaultColor(GlobalColor("color")); l12p.assignValueColor(GlobalColor("color"));
l12p.SetLineWeight(1);
def tll11 = trendline(l11bn, l10, l12bn, l12);
plot tl11 = if show_lows then tll10 else nan;
tl11.SetDefaultColor(GlobalColor("color")); tl11.assignValueColor(GlobalColor("color"));
tl11.SetStyle(line_style); tl11.hideTitle(); tl11.hideBubble();
addchartbubble(debug && bn == l12bn, tl10, slope(l11bn, l10, bn, l), GlobalColor("color"), no);
def isbetweenl11 = bn > l11bn && bn < l12bn;
# find longest TL in this range
def l12s_1 = if !isbetweenl11 then 100 else if l12s < l12s_1[1] then l12s else l12s_1[1]; # get highest slope up to now
def isShallowestl12s = l12s_1 == l12s;
def tll11_count = if isbetweenl11 && l12s_1 == l12s_1[1] then tll11_count[1] + 1 else 0; # get the longest TL
def tll11_bn = highestall(if isbetweenl11 && isShallowestl12s then bn else nan);
def tll11_l = highestall(if bn == tll11_bn then l else nan);
def tll11_1 = trendline(l11bn, l11, tll11_bn, tll11_l);
plot tl11_1 = if show_lows && show_historical_long_trendlines then tll11_1 else nan;
tl11_1.SetDefaultColor(GlobalColor("historical_long_color")); tl11_1.assignValueColor(GlobalColor("historical_long_color"));
tl11_1.SetStyle(historical_line_long_style); tl11_1.hideTitle(); tl11_1.hideBubble();
tl11_1.SetLineWeight(1);
# find ignition candles
def igl11_body = highestall(if isbetweenl11 && isIgnition && !isGreen && isShallowestl12s then body else nan);
def igl11_bn = highestall(if igl11_body == body then bn else nan);
def igl11_l = highestall(if bn == igl11_bn then l else nan);
def igl11_tl = trendline(l11bn, l11, igl11_bn, igl11_l);
plot igl11_tlp = if show_lows && show_historical_igniter_trendlines then igl11_tl else nan;
igl11_tlp.SetDefaultColor(GlobalColor("historical_igniter_color")); igl11_tlp.assignValueColor(GlobalColor("historical_igniter_color"));
igl11_tlp.SetStyle(historical_line_igniter_style); igh11_tlp.hideTitle(); igl11_tlp.hideBubble();
igl11_tlp.SetLineWeight(1);
# find most recent spike
def tll11_trough = if isbetweenl11 && islocaltrough && isShallowestl12s then l else nan;
def tll11_trough_bn = highestall(if !isnan(tll11_trough) && isbetweenl11 then bn else nan);
def tll11_trough_l = highestall(if bn == tll11_trough_bn then l else nan);
def tll11_trough_tl = trendline(l11bn, l11, tll11_trough_bn, tll11_trough_l);
plot tl11_trough = if show_highs && show_historical_peak_trendlines then tll11_trough_tl else nan;
tl11_trough.SetDefaultColor(GlobalColor("historical_peak_color")); tl11_trough.assignValueColor(GlobalColor("historical_peak_color"));
tl11_trough.SetStyle(historical_line_peak_style); tl11_trough.hideTitle(); tl11_trough.hideBubble();
tl11_trough.SetLineWeight(1);
def l13s = If (ignore_last_bar && bn > l12bn, slope(l12bn, l12, bn, l), nan);
def l13 = LowestAll(If (lastbncheck && bn > l12bn && l13s == LowestAll(l13s), l, nan));
def l13bn = HighestAll(If(l13 == l, bn, nan));
plot l13p = If (bn == l13bn && show_points, l13, nan); l13p.hideTitle(); l13p.hideBubble();
l13p.SetStyle(Curve.POINTS);
l13p.SetDefaultColor(GlobalColor("color")); l13p.assignValueColor(GlobalColor("color"));
l13p.SetLineWeight(1);
def tll12 = trendline(l12bn, l12, l13bn, l13);
plot tl12 = if show_lows then tll12 else nan;
tl12.SetDefaultColor(GlobalColor("color")); tl12.assignValueColor(GlobalColor("color"));
tl12.SetStyle(line_style); tl12.hideTitle(); tl12.hideBubble();
addchartbubble(debug && bn == l13bn, tl12, slope(l12bn, l12, bn, l), GlobalColor("color"), no);
def isbetweenl12 = bn > l12bn && bn < l13bn;
# find longest TL in this range
def l13s_1 = if !isbetweenl12 then 100 else if l13s < l13s_1[1] then l13s else l13s_1[1]; # get highest slope up to now
def isShallowestl13s = l13s_1 == l13s;
def tll12_count = if isbetweenl12 && l13s_1 == l13s_1[1] then tll12_count[1] + 1 else 0; # get the longest TL
def tll12_bn = highestall(if isbetweenl12 && isShallowestl13s then bn else nan);
def tll12_l = highestall(if bn == tll12_bn then l else nan);
def tll12_1 = trendline(l12bn, l12, tll12_bn, tll12_l);
plot tl12_1 = if show_lows && show_historical_long_trendlines then tll12_1 else nan;
tl12_1.SetDefaultColor(GlobalColor("historical_long_color")); tl12_1.assignValueColor(GlobalColor("historical_long_color"));
tl12_1.SetStyle(historical_line_long_style); tl12_1.hideTitle(); tl12_1.hideBubble();
tl12_1.SetLineWeight(1);
# find ignition candles
def igl12_body = highestall(if isbetweenl12 && isIgnition && !isGreen && isShallowestl13s then body else nan);
def igl12_bn = highestall(if igl12_body == body then bn else nan);
def igl12_l = highestall(if bn == igl12_bn then l else nan);
def igl12_tl = trendline(l12bn, l12, igl12_bn, igl12_l);
plot igl12_tlp = if show_lows && show_historical_igniter_trendlines then igl12_tl else nan;
igl12_tlp.SetDefaultColor(GlobalColor("historical_igniter_color")); igl12_tlp.assignValueColor(GlobalColor("historical_igniter_color"));
igl12_tlp.SetStyle(historical_line_igniter_style); igh12_tlp.hideTitle(); igl12_tlp.hideBubble();
igl12_tlp.SetLineWeight(1);
# find most recent spike
def tll12_trough = if isbetweenl12 && islocaltrough && isShallowestl13s then l else nan;
def tll12_trough_bn = highestall(if !isnan(tll12_trough) && isbetweenl12 then bn else nan);
def tll12_trough_l = highestall(if bn == tll12_trough_bn then l else nan);
def tll12_trough_tl = trendline(l12bn, l12, tll12_trough_bn, tll12_trough_l);
plot tl12_trough = if show_highs && show_historical_peak_trendlines then tll12_trough_tl else nan;
tl12_trough.SetDefaultColor(GlobalColor("historical_peak_color")); tl12_trough.assignValueColor(GlobalColor("historical_peak_color"));
tl12_trough.SetStyle(historical_line_peak_style); tl12_trough.hideTitle(); tl12_trough.hideBubble();
tl12_trough.SetLineWeight(1);
def l14s = If (ignore_last_bar && bn > l13bn, slope(l13bn, l13, bn, l), nan);
def l14 = LowestAll(If (lastbncheck && bn > l13bn && l14s == LowestAll(l14s), l, nan));
def l14bn = HighestAll(If(l14 == l, bn, nan));
plot l14p = If (bn == l14bn && show_points, l14, nan); l14p.hideTitle(); l14p.hideBubble();
l14p.SetStyle(Curve.POINTS);
l14p.SetDefaultColor(GlobalColor("color")); l14p.assignValueColor(GlobalColor("color"));
l14p.SetLineWeight(1);
def tll13 = trendline(l13bn, l13, l14bn, l14);
plot tl13 = if show_lows then tll13 else nan;
tl13.SetDefaultColor(GlobalColor("color")); tl13.assignValueColor(GlobalColor("color"));
tl13.SetStyle(line_style); tl13.hideTitle(); tl13.hideBubble();
addchartbubble(debug && bn == l14bn, tl13, slope(l13bn, l13, bn, l), GlobalColor("color"), no);
def isbetweenl13 = bn > l13bn && bn < l14bn;
# find longest TL in this range
def l14s_1 = if !isbetweenl13 then 100 else if l14s < l14s_1[1] then l14s else l14s_1[1]; # get highest slope up to now
def isShallowestl14s = l14s_1 == l14s;
def tll13_count = if isbetweenl13 && l14s_1 == l14s_1[1] then tll13_count[1] + 1 else 0; # get the longest TL
def tll13_bn = highestall(if isbetweenl13 && isShallowestl14s then bn else nan);
def tll13_l = highestall(if bn == tll13_bn then l else nan);
def tll13_1 = trendline(l13bn, l13, tll13_bn, tll13_l);
plot tl13_1 = if show_lows && show_historical_long_trendlines then tll13_1 else nan;
tl13_1.SetDefaultColor(GlobalColor("historical_long_color")); tl13_1.assignValueColor(GlobalColor("historical_long_color"));
tl13_1.SetStyle(historical_line_long_style); tl13_1.hideTitle(); tl13_1.hideBubble();
tl13_1.SetLineWeight(1);
# find ignition candles
def igl13_body = highestall(if isbetweenl13 && isIgnition && !isGreen && isShallowestl14s then body else nan);
def igl13_bn = highestall(if igl13_body == body then bn else nan);
def igl13_l = highestall(if bn == igl13_bn then l else nan);
def igl13_tl = trendline(l13bn, l13, igl13_bn, igl13_l);
plot igl13_tlp = if show_lows && show_historical_igniter_trendlines then igl13_tl else nan;
igl13_tlp.SetDefaultColor(GlobalColor("historical_igniter_color")); igl13_tlp.assignValueColor(GlobalColor("historical_igniter_color"));
igl13_tlp.SetStyle(historical_line_igniter_style); igh13_tlp.hideTitle(); igl13_tlp.hideBubble();
igl13_tlp.SetLineWeight(1);
# find most recent spike
def tll13_trough = if isbetweenl13 && islocaltrough && isShallowestl14s then l else nan;
def tll13_trough_bn = highestall(if !isnan(tll13_trough) && isbetweenl13 then bn else nan);
def tll13_trough_l = highestall(if bn == tll13_trough_bn then l else nan);
def tll13_trough_tl = trendline(l13bn, l13, tll13_trough_bn, tll13_trough_l);
plot tl13_trough = if show_highs && show_historical_peak_trendlines then tll13_trough_tl else nan;
tl13_trough.SetDefaultColor(GlobalColor("historical_peak_color")); tl13_trough.assignValueColor(GlobalColor("historical_peak_color"));
tl13_trough.SetStyle(historical_line_peak_style); tl13_trough.hideTitle(); tl13_trough.hideBubble();
tl13_trough.SetLineWeight(1);
def l15s = If (ignore_last_bar && bn > l14bn, slope(l14bn, l14, bn, l), nan);
def l15 = LowestAll(If (lastbncheck && bn > l14bn && l15s == LowestAll(l15s), l, nan));
def l15bn = HighestAll(If(l15 == l, bn, nan));
plot l15p = If (bn == l15bn && show_points, l15, nan); l15p.hideTitle(); l15p.hideBubble();
l15p.SetStyle(Curve.POINTS);
l15p.SetDefaultColor(GlobalColor("color")); l15p.assignValueColor(GlobalColor("color"));
l15p.SetLineWeight(1);
def tll14 = trendline(l14bn, l14, l15bn, l15);
plot tl14 = if show_lows then tll14 else nan;
tl14.SetDefaultColor(GlobalColor("color")); tl14.assignValueColor(GlobalColor("color"));
tl14.SetStyle(line_style); tl14.hideTitle(); tl14.hideBubble();
addchartbubble(debug && bn == l15bn, tl14, slope(l14bn, l14, bn, l), GlobalColor("color"), no);
def isbetweenl14 = bn > l14bn && bn < l15bn;
# find longest TL in this range
def l15s_1 = if !isbetweenl14 then 100 else if l15s < l15s_1[1] then l15s else l15s_1[1]; # get highest slope up to now
def isShallowestl15s = l15s_1 == l15s;
def tll14_count = if isbetweenl14 && l15s_1 == l15s_1[1] then tll14_count[1] + 1 else 0; # get the longest TL
def tll14_bn = highestall(if isbetweenl14 && isShallowestl15s then bn else nan);
def tll14_l = highestall(if bn == tll14_bn then l else nan);
def tll14_1 = trendline(l14bn, l14, tll14_bn, tll14_l);
plot tl14_1 = if show_lows && show_historical_long_trendlines then tll14_1 else nan;
tl14_1.SetDefaultColor(GlobalColor("historical_long_color")); tl14_1.assignValueColor(GlobalColor("historical_long_color"));
tl14_1.SetStyle(historical_line_long_style); tl14_1.hideTitle(); tl14_1.hideBubble();
tl14_1.SetLineWeight(1);
# find ignition candles
def igl14_body = highestall(if isbetweenl14 && isIgnition && !isGreen && isShallowestl15s then body else nan);
def igl14_bn = highestall(if igl14_body == body then bn else nan);
def igl14_l = highestall(if bn == igl14_bn then l else nan);
def igl14_tl = trendline(l14bn, l14, igl14_bn, igl14_l);
plot igl14_tlp = if show_lows && show_historical_igniter_trendlines then igl14_tl else nan;
igl14_tlp.SetDefaultColor(GlobalColor("historical_igniter_color")); igl14_tlp.assignValueColor(GlobalColor("historical_igniter_color"));
igl14_tlp.SetStyle(historical_line_igniter_style); igh14_tlp.hideTitle(); igl14_tlp.hideBubble();
igl14_tlp.SetLineWeight(1);
# find most recent spike
def tll14_trough = if isbetweenl14 && islocaltrough && isShallowestl15s then l else nan;
def tll14_trough_bn = highestall(if !isnan(tll14_trough) && isbetweenl14 then bn else nan);
def tll14_trough_l = highestall(if bn == tll14_trough_bn then l else nan);
def tll14_trough_tl = trendline(l14bn, l14, tll14_trough_bn, tll14_trough_l);
plot tl14_trough = if show_highs && show_historical_peak_trendlines then tll14_trough_tl else nan;
tl14_trough.SetDefaultColor(GlobalColor("historical_peak_color")); tl14_trough.assignValueColor(GlobalColor("historical_peak_color"));
tl14_trough.SetStyle(historical_line_peak_style); tl14_trough.hideTitle(); tl14_trough.hideBubble();
tl14_trough.SetLineWeight(1);
Alert(use_alert && show_highs && c > th0 && th1 && c[1] <= th0[1], "upper trendline break (th0)", Alert.BAR, Sound.Ding);
Alert(use_alert && show_highs && c > th1 && th2 && c[1] <= th1[1], "upper trendline break (th1)", Alert.BAR, Sound.Ding);
Alert(use_alert && show_highs && c > th2 && th3 && c[1] <= th2[1], "upper trendline break (th2)", Alert.BAR, Sound.Ding);
Alert(use_alert && show_highs && c > th3 && th4 && c[1] <= th3[1], "upper trendline break (th3)", Alert.BAR, Sound.Ding);
Alert(use_alert && show_highs && c > th4 && th5 && c[1] <= th4[1], "upper trendline break (th4)", Alert.BAR, Sound.Ding);
Alert(use_alert && show_highs && c > th5 && th6 && c[1] <= th5[1], "upper trendline break (th5)", Alert.BAR, Sound.Ding);
Alert(use_alert && show_highs && c > th6 && th7 && c[1] <= th6[1], "upper trendline break (th6)", Alert.BAR, Sound.Ding);
Alert(use_alert && show_highs && c > th7 && th8 && c[1] <= th7[1], "upper trendline break (th7)", Alert.BAR, Sound.Ding);
Alert(use_alert && show_highs && c > th8 && th9 && c[1] <= th8[1], "upper trendline break (th8)", Alert.BAR, Sound.Ding);
Alert(use_alert && show_highs && c > th9 && th10&& c[1] <= th9[1], "upper trendline break (th9)", Alert.BAR, Sound.Ding);
Alert(use_alert && show_highs && c > th10 && th11 && c[1] <= th10[1], "upper trendline break (th10)", Alert.BAR, Sound.Ding);
Alert(use_alert && show_highs && c > th11 && th12 && c[1] <= th11[1], "upper trendline break (th11)", Alert.BAR, Sound.Ding);
Alert(use_alert && show_highs && c > th12 && th13 && c[1] <= th12[1], "upper trendline break (th12)", Alert.BAR, Sound.Ding);
Alert(use_alert && show_highs && c > th13 && th14 && c[1] <= th13[1], "upper trendline break (th13)", Alert.BAR, Sound.Ding);
#Alert(use_alert && show_highs && c > th14 && th15 && c[1] <= th14[1], "upper trendline break (th14)", Alert.BAR, Sound.Ding);
Alert(use_alert && show_lows && c < tl0 && tl1 && c[1] >= tl0[1], "lower trendline break (tl0)", Alert.BAR, Sound.Ding);
Alert(use_alert && show_lows && c < tl1 && tl2 && c[1] >= tl1[1], "lower trendline break (tl1)", Alert.BAR, Sound.Ding);
Alert(use_alert && show_lows && c < tl2 && tl3 && c[1] >= tl2[1], "lower trendline break (tl2)", Alert.BAR, Sound.Ding);
Alert(use_alert && show_lows && c < tl3 && tl4 && c[1] >= tl3[1], "lower trendline break (tl3)", Alert.BAR, Sound.Ding);
Alert(use_alert && show_lows && c < tl4 && tl5 && c[1] >= tl4[1], "lower trendline break (tl4)", Alert.BAR, Sound.Ding);
Alert(use_alert && show_lows && c < tl5 && tl6 && c[1] >= tl5[1], "lower trendline break (tl5)", Alert.BAR, Sound.Ding);
Alert(use_alert && show_lows && c < tl6 && tl7 && c[1] >= tl6[1], "lower trendline break (tl6)", Alert.BAR, Sound.Ding);
Alert(use_alert && show_lows && c < tl7 && tl8 && c[1] >= tl7[1], "lower trendline break (tl7)", Alert.BAR, Sound.Ding);
Alert(use_alert && show_lows && c < tl8 && tl9 && c[1] >= tl8[1], "lower trendline break (tl8)", Alert.BAR, Sound.Ding);
Alert(use_alert && show_lows && c < tl9 && tl10&& c[1] >= tl9[1], "lower trendline break (tl9)", Alert.BAR, Sound.Ding);
Alert(use_alert && show_lows && c < tl10 && tl11 && c[1] >= tl10[1], "lower trendline break (tl10)", Alert.BAR, Sound.Ding);
Alert(use_alert && show_lows && c < tl11 && tl12 && c[1] >= tl11[1], "lower trendline break (tl11)", Alert.BAR, Sound.Ding);
Alert(use_alert && show_lows && c < tl12 && tl13 && c[1] >= tl12[1], "lower trendline break (tl12)", Alert.BAR, Sound.Ding);
Alert(use_alert && show_lows && c < tl13 && tl14 && c[1] >= tl13[1], "lower trendline break (tl13)", Alert.BAR, Sound.Ding);
#Alert(use_alert && show_lows && c < tl14 && c[1] >= tl14[1], "lower trendline break (tl14)", Alert.BAR, Sound.Ding);
# richard_the_red Momonacci
#hint: God mode levels. This is Jimmy Momo Zones on steroids. We start with the same significant candles, but limit our choices to only those that use the smart pivots and logic from my Fibronacci study, which end up being very powerful levels on all scales.<br><br> You can choose a higher period's candles which will give you the best results. I like 2h, 4h, and 1d higher ranges on a 180-day 1h chart. You can scalp lower levels like the 15m and 30m, or use them to fine-tune higher-level entries. I use the 15m and 30m on my 2-day 1m, 6m, and 10m charts.<br><br> You can also limit the range it uses to draw candles, so if you've got a 90d chart you can tell it to only draw the last 30 days of levels. Make sure you give the study enough range to encapsulate the relevant historical price action or you may end up with blank areas on your chart if the last time price was in this area is outside your chart range. <br><br> Also note that your chart range must be larger than any limit range you choose, the data has to be on the chart to draw the lines. <br><br>©2023 @richard_the_red<br><br> This program is free software; you can redistribute it and/or modify it under the terms of the GNU General Public License as published by the Free Software Foundation; either version 2 of the License, or (at your option) any later version. This program is distributed in the hope that it will be useful, but WITHOUT ANY WARRANTY; without even the implied warranty of MERCHANTABILITY or FITNESS FOR A PARTICULAR PURPOSE. See the GNU General Public License for more details. http://www.gnu.org/licenses/gpl.html
# Thanks to James LeFaith for showing me how these significant candles work and frankly, having the only real rational and logical theory of price action I've every encountered.
# TODO: add line labels
# oh no wait I did that. Ready for final release!
declare once_per_bar; # drastically reduce computation time by drawing only once per bar close
# This will reconcile weird periods with standard ones so we don't just get an error
script getProperAP {
input ap = 0;
plot getProperAP =
if ap <= AggregationPeriod.MIN then AggregationPeriod.MIN else
if ap <= AggregationPeriod.TWO_MIN then AggregationPeriod.TWO_MIN else
if ap <= AggregationPeriod.THREE_MIN then AggregationPeriod.THREE_MIN else
if ap <= AggregationPeriod.FOUR_MIN then AggregationPeriod.FOUR_MIN else
if ap <= AggregationPeriod.FIVE_MIN then AggregationPeriod.FIVE_MIN else
if ap <= AggregationPeriod.TEN_MIN then AggregationPeriod.TEN_MIN else
if ap <= AggregationPeriod.FIFTEEN_MIN then AggregationPeriod.FIFTEEN_MIN else
if ap <= AggregationPeriod.TWENTY_MIN then AggregationPeriod.TWENTY_MIN else
if ap <= AggregationPeriod.THIRTY_MIN then AggregationPeriod.THIRTY_MIN else
if ap <= AggregationPeriod.HOUR then AggregationPeriod.HOUR else
if ap <= AggregationPeriod.TWO_HOURS then AggregationPeriod.TWO_HOURS else
if ap <= AggregationPeriod.FOUR_HOURS then AggregationPeriod.FOUR_HOURS else
if ap <= AggregationPeriod.DAY then AggregationPeriod.DAY else
if ap <= AggregationPeriod.TWO_DAYS then AggregationPeriod.TWO_DAYS else
if ap <= AggregationPeriod.THREE_DAYS then AggregationPeriod.THREE_DAYS else
if ap <= AggregationPeriod.FOUR_DAYS then AggregationPeriod.FOUR_DAYS else
if ap <= AggregationPeriod.WEEK then AggregationPeriod.WEEK else
if ap <= AggregationPeriod.MONTH then AggregationPeriod.MONTH else
if ap <= AggregationPeriod.OPT_EXP then AggregationPeriod.OPT_EXP else
if ap <= AggregationPeriod.QUARTER then AggregationPeriod.QUARTER else
AggregationPeriod.YEAR
;
}
input higher_period = {Default "chart period", "1 min", "2 min", "3 min", "4 min", "5 min", "10 min", "15 min", "20 min", "30 min", "1 hour", "2 hours", "4 hours", "1 day", "2 days", "3 days", "4 days", "week", "month", "opt exp", "quarter", "year"}; #hint higher_period: Use the existing chart period, or choose a higher period instead. Note if you choose a lower period than your current chart period, momonacci will choose the next highest valid period and scold you.
def ap = getAggregationPeriod();
def standardizedAP = getProperAP(ap);
def use_higher_period;
def aggregation_period;
def isMunged; # this is whether the user's chart period is non-standard or they pick a higher period lower than the chart period; either way we throw up a label to alert the user
switch (higher_period) {
case "1 min": use_higher_period = if ap > AggregationPeriod.MIN then no else yes; aggregation_period = if !use_higher_period then standardizedAP else AggregationPeriod.MIN; isMunged = if !use_higher_period then yes else no;
case "2 min": use_higher_period = if ap > AggregationPeriod.TWO_MIN then no else yes; aggregation_period = if !use_higher_period then standardizedAP else AggregationPeriod.TWO_MIN; isMunged = if !use_higher_period then yes else no;
case "3 min": use_higher_period = if ap > AggregationPeriod.THREE_MIN then no else yes; aggregation_period = if !use_higher_period then standardizedAP else AggregationPeriod.THREE_MIN; isMunged = if !use_higher_period then yes else no;
case "4 min": use_higher_period = if ap > AggregationPeriod.FOUR_MIN then no else yes; aggregation_period = if !use_higher_period then standardizedAP else AggregationPeriod.FOUR_MIN; isMunged = if !use_higher_period then yes else no;
case "5 min": use_higher_period = if ap > AggregationPeriod.FIVE_MIN then no else yes; aggregation_period = if !use_higher_period then standardizedAP else AggregationPeriod.FIVE_MIN; isMunged = if !use_higher_period then yes else no;
case "10 min": use_higher_period = if ap > AggregationPeriod.TEN_MIN then no else yes; aggregation_period = if !use_higher_period then standardizedAP else AggregationPeriod.TEN_MIN; isMunged = if !use_higher_period then yes else no;
case "15 min": use_higher_period = if ap > AggregationPeriod.FIFTEEN_MIN then no else yes; aggregation_period = if !use_higher_period then standardizedAP else AggregationPeriod.FIFTEEN_MIN; isMunged = if !use_higher_period then yes else no;
case "20 min": use_higher_period = if ap > AggregationPeriod.TWENTY_MIN then no else yes; aggregation_period = if !use_higher_period then standardizedAP else AggregationPeriod.TWENTY_MIN; isMunged = if !use_higher_period then yes else no;
case "30 min": use_higher_period = if ap > AggregationPeriod.THIRTY_MIN then no else yes; aggregation_period = if !use_higher_period then standardizedAP else AggregationPeriod.THIRTY_MIN; isMunged = if !use_higher_period then yes else no;
case "1 hour": use_higher_period = if ap > AggregationPeriod.HOUR then no else yes; aggregation_period = if !use_higher_period then standardizedAP else AggregationPeriod.HOUR; isMunged = if !use_higher_period then yes else no;
case "2 hours": use_higher_period = if ap > AggregationPeriod.TWO_HOURS then no else yes; aggregation_period = if !use_higher_period then standardizedAP else AggregationPeriod.TWO_HOURS; isMunged = if !use_higher_period then yes else no;
case "4 hours": use_higher_period = if ap > AggregationPeriod.FOUR_HOURS then no else yes; aggregation_period = if !use_higher_period then standardizedAP else AggregationPeriod.FOUR_HOURS; isMunged = if !use_higher_period then yes else no;
case "1 day": use_higher_period = if ap > AggregationPeriod.DAY then no else yes; aggregation_period = if !use_higher_period then standardizedAP else AggregationPeriod.DAY; isMunged = if !use_higher_period then yes else no;
case "2 days": use_higher_period = if ap > AggregationPeriod.TWO_DAYS then no else yes; aggregation_period = if !use_higher_period then standardizedAP else AggregationPeriod.TWO_DAYS; isMunged = if !use_higher_period then yes else no;
case "3 days": use_higher_period = if ap > AggregationPeriod.THREE_DAYS then no else yes; aggregation_period = if !use_higher_period then standardizedAP else AggregationPeriod.THREE_DAYS; isMunged = if !use_higher_period then yes else no;
case "4 days": use_higher_period = if ap > AggregationPeriod.FOUR_DAYS then no else yes; aggregation_period = if !use_higher_period then standardizedAP else AggregationPeriod.FOUR_DAYS; isMunged = if !use_higher_period then yes else no;
case "week": use_higher_period = if ap > AggregationPeriod.WEEK then no else yes; aggregation_period = if !use_higher_period then standardizedAP else AggregationPeriod.WEEK; isMunged = if !use_higher_period then yes else no;
case "month": use_higher_period = if ap > AggregationPeriod.MONTH then no else yes; aggregation_period = if !use_higher_period then standardizedAP else AggregationPeriod.MONTH; isMunged = if !use_higher_period then yes else no;
case "opt exp": use_higher_period = if ap > AggregationPeriod.OPT_EXP then no else yes; aggregation_period = if !use_higher_period then standardizedAP else AggregationPeriod.OPT_EXP; isMunged = if !use_higher_period then yes else no;
case "quarter": use_higher_period = if ap > AggregationPeriod.QUARTER then no else yes; aggregation_period = if !use_higher_period then standardizedAP else AggregationPeriod.QUARTER; isMunged = if !use_higher_period then yes else no;
case "year": use_higher_period = if ap > AggregationPeriod.YEAR then no else yes; aggregation_period = if !use_higher_period then standardizedAP else AggregationPeriod.YEAR; isMunged = if !use_higher_period then yes else no;
default: use_higher_period = no; aggregation_period = standardizedAP; isMunged = if ap != standardizedAP then yes else no;
}
addlabel(isMunged, "Invalid Momonacci higher period, using " + (
if aggregation_period <= AggregationPeriod.MIN then "1 min" else
if aggregation_period <= AggregationPeriod.TWO_MIN then "2 min" else
if aggregation_period <= AggregationPeriod.THREE_MIN then "3 min" else
if aggregation_period <= AggregationPeriod.FOUR_MIN then "4 min" else
if aggregation_period <= AggregationPeriod.FIVE_MIN then "5 min" else
if aggregation_period <= AggregationPeriod.TEN_MIN then "10 min" else
if aggregation_period <= AggregationPeriod.FIFTEEN_MIN then "15 min" else
if aggregation_period <= AggregationPeriod.TWENTY_MIN then "20 min" else
if aggregation_period <= AggregationPeriod.THIRTY_MIN then "30 min" else
if aggregation_period <= AggregationPeriod.HOUR then "1 hour" else
if aggregation_period <= AggregationPeriod.TWO_HOURS then "2 hours" else
if aggregation_period <= AggregationPeriod.FOUR_HOURS then "4 hours" else
if aggregation_period <= AggregationPeriod.DAY then "1 day" else
if aggregation_period <= AggregationPeriod.TWO_DAYS then "2 days" else
if aggregation_period <= AggregationPeriod.THREE_DAYS then "3 days" else
if aggregation_period <= AggregationPeriod.FOUR_DAYS then "4 days" else
if aggregation_period <= AggregationPeriod.WEEK then "week" else
if aggregation_period <= AggregationPeriod.MONTH then "month" else
if aggregation_period <= AggregationPeriod.OPT_EXP then "opt exp" else
if aggregation_period <= AggregationPeriod.QUARTER then "quarter" else
"year"
) + " instead", color.red);
input use_range = {Default Chart, Hours, Days, Bars}; #hint use_range: How far back to calculate; if not "Chart" then limit the range to the range below.
input range = 10; #hint range: how many of the above to use, e.g. 10 Days, 10 Hours, 10 Bars.
def pivot_test_length = 5; #hint pivot_test_length: how many candles this needs to be higher than on either side on the chosen aggregation_period to constitute a peak/valley, e.g. '2' on the FOUR_HOURS period means our pivot must clear two four hour candles before and after, so it has to be the highest point in 16 hours. The higher this number the more solid the levels but fewer of them. Testing shows that 5 is a really good choice for day trading (i.e. 4h 5 + 1 = 6).
def standard_deviation_length = 6; #hint standard_deviation_length: how many of the previous candles should be considered in the standard deviation curve
def standard_deviation = 2.0; #hint standard_deviation: how many standard deviations this candle has to exceed to be considered hot
def recent_peak_and_valley_sets = 10; #hint recent_peak_and_valley_sets: Max 10. There can be UP TO this number depending on standard deviations. any more than that and **** is likely to explode the **** up, so don't say I didn't warn you. just kidding, nothing will happen if it's bigger. seriously, try it. just kidding, don't do it. why are you listening to a shitty comment anyway?
def num_lines = recent_peak_and_valley_sets; # just making this variable shorter
def biggest_body_sets = 10; #hint biggest_body_sets: max 10; will draw sets of peaks and valleys of the biggest body pivots
def num_biggest = biggest_body_sets;
# def show_midcandles = no; # important midcandles end up being actual levels and showing these ends up being a lot of extra lines for not a lot of extra value
#input midcandles = {"Show Midcandles", Default "Hide Midcandles"};#hint show_midcandles: each peak/valley set will have a midcandle at the 50% mark which is often helpful but sometimes makes too many lines so it's up to you idc
#def show_midcandles;
#switch (midcandles) {
# case "Hide Midcandles": show_midcandles = no;
# default: show_midcandles = yes;
#}
input line_style = curve.FIRM; #hint line_style: For this to work you need to pick 'LINE' from the dropdown below
input line_type = paintingStrategy.LINE; #hint line_type: Setting this to anything other than 'LINE' will ignore the dropdown above
input line_weight = 1; #hint line_weight: how thicc the lines get
input thiccer_line_weight = 2; #hint thiccer_line_weight: this one is for the thiccer lines of the largest momo candles; the rest are whatever's most recent that fits the standard deviation
input line_labels = {"Show line labels", Default "Line labels off"};
def label_offset = 0;
input credits = {default "©2023 @richard_the_red", "https://bit.ly/tos_scripts", "Thanks to:", "James LeFaith", "Nut Butter Falcon", "An", "Jen", "sfxZeta"}; #hint credits: No man is an island and I want to thank these awesome folks in particular, as well as my incredibly supportive discord crew and those people still left on that cesspool of social media, twitter. But especially James LeFaith without whose guidance this study would not exist.
DefineGlobalColor("valley", CreateColor(132,138,63));
# DefineGlobalColor("midcandle", CreateColor(183,171,123)); # yellow
#DefineGlobalColor("midcandle", CreateColor(99,165,132)); # blue
DefineGlobalColor("peak", CreateColor(189,71,30));
def o = if !use_higher_period then open else open(period = aggregation_period);
def c = if !use_higher_period then close else close(period = aggregation_period);
def nan = Double.NaN;
def bn = barnumber();
def isAfterLastBn = isnan(close);
def lastbn = highestall(if !isAfterLastBn && isnan(close[-1]) then bn else nan);
def show_labels;
def show_bubbles;
switch (line_labels) {
case "Show line labels": show_labels = bn == highestall(bn - label_offset); show_bubbles = no;
#case "Line labels off": show_labels = no;
default: show_labels = no; show_bubbles = yes;
}
def barsperhour = 60 / (ap / 1000 / 60); # ap is 600k for a 10m chart
def barsperhour_higher_period = if !use_higher_period then 1 else (aggregation_period / 1000 / 60 / 60);
def num_candles = Max(1, barsperhour * barsperhour_higher_period);
def peak_range = pivot_test_length * num_candles + 1; # get number of candles in the peak_range. the +1 is to reconcile the higher time period candle like 4h and 1d with the ideal number of candles in the lower ranges because the higher ranges candle width gets screwed up on weekends and shows up as a half-candle on lower periods
def xlated_range;
switch (use_range) {
case "Bars": xlated_range = range;
case "Hours": xlated_range = (barsperhour * range);
case "Days": xlated_range = (barsperhour * range * 24);
default: xlated_range = lastbn;
}
def isInRange = bn >= lastbn - xlated_range;
def isRed = o > c;
def top = compoundvalue(1, if isnan(o) then top[1] else Max(o, c), high);
def bottom = compoundvalue(1, if isnan(o) then bottom[1] else Min(o, c), low);
def bodyheight = top - bottom;
def isHot = bodyheight >= StDev(bodyheight, standard_deviation_length * num_candles) * standard_deviation;
def isPeakLookahead = top >= Highest(top[-peak_range], peak_range);
def isPeakLookbehind = top >= Highest(top, peak_range);
def isValleyLookahead = bottom <= Lowest(bottom[-peak_range], peak_range);
def isValleyLookbehind = bottom <= Lowest(bottom, peak_range);
def isPeak = isInRange && isHot && isRed && isPeakLookahead && isPeakLookbehind;
def isValley = isInRange && isHot && !isRed && isValleyLookahead && isValleyLookbehind;
def peak = compoundvalue(1, if isPeak then top else peak[1], high);
def valley = compoundvalue(1, if isvalley then bottom else valley[1], high);
def valley_body = if isvalley then bodyheight else 0;
def peak_body = if isPeak then bodyheight else 0;
#addchartbubble(isPeak, peak, peak, globalcolor("peak"));
#addchartbubble(isvalley, valley, valley, globalcolor("valley"));
# go get the two biggest bodies in range for each of peak and valley
def biggest_valley_body = if num_biggest < 1 then nan else compoundvalue(1, if isvalley && valley_body > biggest_valley_body[1] then valley_body else biggest_valley_body[1], low);
def btb_bn = if num_biggest < 1 then nan else highestall(if valley_body == biggest_valley_body && !isAfterLastBn then bn else nan);
def t_00 = if num_biggest < 1 then nan else if bn == btb_bn then valley else t_00[1];
def t_00_x = if num_biggest < 1 then nan else if isnan(t_00) then t_00_x[1] else t_00;
plot valley_00 = if t_00_x != 0 && num_biggest >= 1 && bn > btb_bn then t_00_x else nan;
valley_00.setLineWeight(thiccer_line_weight); valley_00.hideTitle(); valley_00.setStyle(line_style); valley_00.setPaintingStrategy(line_type); valley_00.setDefaultColor(globalColor("valley")); valley_00.assignValueColor(globalColor("valley"));
#addchartbubble(num_biggest >= 1 && bn == btb_bn, t_00_x, "btb1: " + biggest_valley_body + "; " + t_00_x, globalColor("valley"));
addchartbubble(show_labels && !isnan(valley_00), valley_00, (if aggregation_period <= AggregationPeriod.MIN then "1 min" else if aggregation_period <= AggregationPeriod.TWO_MIN then "2 min" else if aggregation_period <= AggregationPeriod.THREE_MIN then "3 min" else if aggregation_period <= AggregationPeriod.FOUR_MIN then "4 min" else if aggregation_period <= AggregationPeriod.FIVE_MIN then "5 min" else if aggregation_period <= AggregationPeriod.TEN_MIN then "10 min" else if aggregation_period <= AggregationPeriod.FIFTEEN_MIN then "15 min" else if aggregation_period <= AggregationPeriod.TWENTY_MIN then "20 min" else if aggregation_period <= AggregationPeriod.THIRTY_MIN then "30 min" else if aggregation_period <= AggregationPeriod.HOUR then "1 hour" else if aggregation_period <= AggregationPeriod.TWO_HOURS then "2 hours" else if aggregation_period <= AggregationPeriod.FOUR_HOURS then "4 hours" else if aggregation_period <= AggregationPeriod.DAY then "1 day" else if aggregation_period <= AggregationPeriod.TWO_DAYS then "2 days" else if aggregation_period <= AggregationPeriod.THREE_DAYS then "3 days" else if aggregation_period <= AggregationPeriod.FOUR_DAYS then "4 days" else if aggregation_period <= AggregationPeriod.WEEK then "week" else if aggregation_period <= AggregationPeriod.MONTH then "month" else if aggregation_period <= AggregationPeriod.OPT_EXP then "opt exp" else if aggregation_period <= AggregationPeriod.QUARTER then "quarter" else "year") + " " + AsPrice(valley_00), globalColor("valley"));
def biggest_peak_body = if num_biggest < 1 then nan else compoundvalue(1, if ispeak && peak_body > biggest_peak_body[1] then peak_body else biggest_peak_body[1], high);
def bpb_bn = if num_biggest < 1 then nan else highestall(if peak_body == biggest_peak_body && !isAfterLastBn then bn else nan);
def p_00 = if num_biggest < 1 then nan else if bn == bpb_bn then peak else p_00[1];
def p_00_x = if num_biggest < 1 then nan else if isnan(p_00) then p_00_x[1] else p_00;
plot peak_00 = if p_00_x != 0 && num_biggest >= 1 && bn > bpb_bn then p_00_x else nan;
peak_00.setLineWeight(thiccer_line_weight); peak_00.hideTitle(); peak_00.setStyle(line_style); peak_00.setPaintingStrategy(line_type); peak_00.setDefaultColor(globalColor("peak")); peak_00.assignValueColor(globalColor("peak"));
#addchartbubble(num_biggest >= 1 && bn == bpb_bn, p_00_x, "bpb1: " + biggest_peak_body + "; " + p_00_x, globalColor("peak"));
addchartbubble(show_labels && !isnan(peak_00), peak_00, (if aggregation_period <= AggregationPeriod.MIN then "1 min" else if aggregation_period <= AggregationPeriod.TWO_MIN then "2 min" else if aggregation_period <= AggregationPeriod.THREE_MIN then "3 min" else if aggregation_period <= AggregationPeriod.FOUR_MIN then "4 min" else if aggregation_period <= AggregationPeriod.FIVE_MIN then "5 min" else if aggregation_period <= AggregationPeriod.TEN_MIN then "10 min" else if aggregation_period <= AggregationPeriod.FIFTEEN_MIN then "15 min" else if aggregation_period <= AggregationPeriod.TWENTY_MIN then "20 min" else if aggregation_period <= AggregationPeriod.THIRTY_MIN then "30 min" else if aggregation_period <= AggregationPeriod.HOUR then "1 hour" else if aggregation_period <= AggregationPeriod.TWO_HOURS then "2 hours" else if aggregation_period <= AggregationPeriod.FOUR_HOURS then "4 hours" else if aggregation_period <= AggregationPeriod.DAY then "1 day" else if aggregation_period <= AggregationPeriod.TWO_DAYS then "2 days" else if aggregation_period <= AggregationPeriod.THREE_DAYS then "3 days" else if aggregation_period <= AggregationPeriod.FOUR_DAYS then "4 days" else if aggregation_period <= AggregationPeriod.WEEK then "week" else if aggregation_period <= AggregationPeriod.MONTH then "month" else if aggregation_period <= AggregationPeriod.OPT_EXP then "opt exp" else if aggregation_period <= AggregationPeriod.QUARTER then "quarter" else "year") + " " + AsPrice(peak_00), globalColor("peak"));
# def biggest_mc = if num_biggest < 1 then nan else t_00_x + ((p_00_x - t_00_x) / 2 );
# def bmc_bn = if num_biggest < 1 then nan else highestall(Max(btb_bn, bpb_bn));
# def mc_00 = if num_biggest < 1 then nan else if bn == bmc_bn then biggest_mc else mc_00[1];
# def mc_00_x = if num_biggest < 1 then nan else if isnan(mc_00) then mc_00_x[1] else mc_00;
# plot midcandle_00 = if show_midcandles && show_midcandles && num_biggest >= 1 && bn > bmc_bn then mc_00_x else nan;
# midcandle_00.setLineWeight(thiccer_line_weight); midcandle_00.hideTitle(); midcandle_00.setStyle(line_style); midcandle_00.setPaintingStrategy(line_type); midcandle_00.setDefaultColor(globalColor("midcandle")); midcandle_00.assignValueColor(globalColor("midcandle"));
# #addchartbubble(num_biggest >= 1 && bn == bmc_bn, mc_00_x, "bmc: " + biggest_mc + "; " + mc_00_x, globalColor("midcandle"));
def btb_001 = if num_biggest < 2 then nan else compoundvalue(1, if isvalley && valley_body > btb_001[1] && valley_body < biggest_valley_body then valley_body else btb_001[1], low);
def btb_bn_001 = if isnan(btb_001) then nan else highestall(if valley_body == btb_001 && !isAfterLastBn then bn else nan);
def t_001 = if isnan(btb_001) then nan else if bn == btb_bn_001 then valley else t_001[1];
def t_001_x = if isnan(btb_001) then nan else if isnan(t_001) then t_001_x[1] else t_001;
plot valley_001 = if t_001_x != 0 && num_biggest >= 2 && bn > btb_bn_001 then t_001_x else nan;
valley_001.setLineWeight(thiccer_line_weight); valley_001.hideTitle(); valley_001.setStyle(line_style); valley_001.setPaintingStrategy(line_type); valley_001.setDefaultColor(globalColor("valley")); valley_001.assignValueColor(globalColor("valley"));
#addchartbubble(num_biggest >= 2 && bn == btb_bn_001, t_001_x, "btb2: " + btb_001 + "; " + t_001_x, globalColor("valley"));
addchartbubble(show_labels && !isnan(btb_001), valley_001, (if aggregation_period <= AggregationPeriod.MIN then "1 min" else if aggregation_period <= AggregationPeriod.TWO_MIN then "2 min" else if aggregation_period <= AggregationPeriod.THREE_MIN then "3 min" else if aggregation_period <= AggregationPeriod.FOUR_MIN then "4 min" else if aggregation_period <= AggregationPeriod.FIVE_MIN then "5 min" else if aggregation_period <= AggregationPeriod.TEN_MIN then "10 min" else if aggregation_period <= AggregationPeriod.FIFTEEN_MIN then "15 min" else if aggregation_period <= AggregationPeriod.TWENTY_MIN then "20 min" else if aggregation_period <= AggregationPeriod.THIRTY_MIN then "30 min" else if aggregation_period <= AggregationPeriod.HOUR then "1 hour" else if aggregation_period <= AggregationPeriod.TWO_HOURS then "2 hours" else if aggregation_period <= AggregationPeriod.FOUR_HOURS then "4 hours" else if aggregation_period <= AggregationPeriod.DAY then "1 day" else if aggregation_period <= AggregationPeriod.TWO_DAYS then "2 days" else if aggregation_period <= AggregationPeriod.THREE_DAYS then "3 days" else if aggregation_period <= AggregationPeriod.FOUR_DAYS then "4 days" else if aggregation_period <= AggregationPeriod.WEEK then "week" else if aggregation_period <= AggregationPeriod.MONTH then "month" else if aggregation_period <= AggregationPeriod.OPT_EXP then "opt exp" else if aggregation_period <= AggregationPeriod.QUARTER then "quarter" else "year") + " " + AsPrice(valley_001), globalColor("valley"));
def bpb_001 = if num_biggest < 2 then nan else compoundvalue(1, if ispeak && peak_body > bpb_001[1] && peak_body < biggest_peak_body then peak_body else bpb_001[1], high);
def bpb_bn_001 = if isnan(bpb_001) then nan else highestall(if peak_body == bpb_001 && !isAfterLastBn then bn else nan);
def p_001 = if isnan(bpb_001) then nan else if bn == bpb_bn_001 then peak else p_001[1];
def p_001_x = if isnan(bpb_001) then nan else if isnan(p_001) then p_001_x[1] else p_001;
plot peak_001 = if p_001_x != 0 && num_biggest >= 2 && bn > bpb_bn_001 then p_001_x else nan;
peak_001.setLineWeight(thiccer_line_weight); peak_001.hideTitle(); peak_001.setStyle(line_style); peak_001.setPaintingStrategy(line_type); peak_001.setDefaultColor(globalColor("peak")); peak_001.assignValueColor(globalColor("peak"));
#addchartbubble(num_biggest >= 2 && bn == bpb_bn_001, p_001_x, "bpb2: " + bpb_001 + "; " + p_001_x, globalColor("peak"));
addchartbubble(show_labels && !isnan(peak_001), peak_001, (if aggregation_period <= AggregationPeriod.MIN then "1 min" else if aggregation_period <= AggregationPeriod.TWO_MIN then "2 min" else if aggregation_period <= AggregationPeriod.THREE_MIN then "3 min" else if aggregation_period <= AggregationPeriod.FOUR_MIN then "4 min" else if aggregation_period <= AggregationPeriod.FIVE_MIN then "5 min" else if aggregation_period <= AggregationPeriod.TEN_MIN then "10 min" else if aggregation_period <= AggregationPeriod.FIFTEEN_MIN then "15 min" else if aggregation_period <= AggregationPeriod.TWENTY_MIN then "20 min" else if aggregation_period <= AggregationPeriod.THIRTY_MIN then "30 min" else if aggregation_period <= AggregationPeriod.HOUR then "1 hour" else if aggregation_period <= AggregationPeriod.TWO_HOURS then "2 hours" else if aggregation_period <= AggregationPeriod.FOUR_HOURS then "4 hours" else if aggregation_period <= AggregationPeriod.DAY then "1 day" else if aggregation_period <= AggregationPeriod.TWO_DAYS then "2 days" else if aggregation_period <= AggregationPeriod.THREE_DAYS then "3 days" else if aggregation_period <= AggregationPeriod.FOUR_DAYS then "4 days" else if aggregation_period <= AggregationPeriod.WEEK then "week" else if aggregation_period <= AggregationPeriod.MONTH then "month" else if aggregation_period <= AggregationPeriod.OPT_EXP then "opt exp" else if aggregation_period <= AggregationPeriod.QUARTER then "quarter" else "year") + " " + AsPrice(peak_001), globalColor("peak"));
# def mctb_001 = if num_biggest < 2 then nan else t_001_x + ((p_001_x - t_001_x) / 2 );
# def mctb_bn_001 = if num_biggest < 2 then nan else highestall(Max(btb_bn_001, bpb_bn_001));
# def mc_001 = if num_biggest < 2 then nan else if bn == mctb_bn_001 then mctb_001 else mc_001[1];
# def mc_001_x = if num_biggest < 2 then nan else if isnan(mc_001) then mc_001_x[1] else mc_001;
# plot midcandle_001 = if show_midcandles && num_biggest >= 2 && bn > mctb_bn_001 then mc_001_x else nan;
# midcandle_001.setLineWeight(thiccer_line_weight); midcandle_001.hideTitle(); midcandle_001.setStyle(line_style); midcandle_001.setPaintingStrategy(line_type); midcandle_001.setDefaultColor(globalColor("midcandle")); midcandle_001.assignValueColor(globalColor("midcandle"));
# #addchartbubble(num_biggest >= 2 && bn == mctb_bn_001, mc_001_x, "mctb2: " + mctb_001 + "; " + mc_001_x, globalColor("midcandle"));
def btb_002 = if num_biggest < 3 then nan else compoundvalue(1, if isvalley && valley_body > btb_002[1] && valley_body < btb_001 && valley_body < biggest_valley_body then valley_body else btb_002[1], low);
def btb_bn_002 = if isnan(btb_002) then nan else highestall(if valley_body == btb_002 && !isAfterLastBn then bn else nan);
def t_002 = if isnan(btb_002) then valley else t_002[1];
def t_002_x = if isnan(btb_002) then t_002_x[1] else t_002;
plot valley_002 = if t_002_x != 0 && num_biggest >= 3 && bn > btb_bn_002 then t_002_x else nan;
valley_002.setLineWeight(thiccer_line_weight); valley_002.hideTitle(); valley_002.setStyle(line_style); valley_002.setPaintingStrategy(line_type); valley_002.setDefaultColor(globalColor("valley")); valley_002.assignValueColor(globalColor("valley"));
#addchartbubble(num_biggest >= 3 && bn == btb_bn_002, t_002_x, "btb3: " + btb_002 + "; " + t_002_x, globalColor("valley"));
addchartbubble(show_labels && !isnan(btb_002), valley_002, (if aggregation_period <= AggregationPeriod.MIN then "1 min" else if aggregation_period <= AggregationPeriod.TWO_MIN then "2 min" else if aggregation_period <= AggregationPeriod.THREE_MIN then "3 min" else if aggregation_period <= AggregationPeriod.FOUR_MIN then "4 min" else if aggregation_period <= AggregationPeriod.FIVE_MIN then "5 min" else if aggregation_period <= AggregationPeriod.TEN_MIN then "10 min" else if aggregation_period <= AggregationPeriod.FIFTEEN_MIN then "15 min" else if aggregation_period <= AggregationPeriod.TWENTY_MIN then "20 min" else if aggregation_period <= AggregationPeriod.THIRTY_MIN then "30 min" else if aggregation_period <= AggregationPeriod.HOUR then "1 hour" else if aggregation_period <= AggregationPeriod.TWO_HOURS then "2 hours" else if aggregation_period <= AggregationPeriod.FOUR_HOURS then "4 hours" else if aggregation_period <= AggregationPeriod.DAY then "1 day" else if aggregation_period <= AggregationPeriod.TWO_DAYS then "2 days" else if aggregation_period <= AggregationPeriod.THREE_DAYS then "3 days" else if aggregation_period <= AggregationPeriod.FOUR_DAYS then "4 days" else if aggregation_period <= AggregationPeriod.WEEK then "week" else if aggregation_period <= AggregationPeriod.MONTH then "month" else if aggregation_period <= AggregationPeriod.OPT_EXP then "opt exp" else if aggregation_period <= AggregationPeriod.QUARTER then "quarter" else "year") + " " + AsPrice(valley_002), globalColor("valley"));
def bpb_002 = if num_biggest < 3 then nan else compoundvalue(1, if ispeak && peak_body > bpb_002[1] && peak_body < bpb_001 && peak_body < biggest_peak_body then peak_body else bpb_002[1], high);
def bpb_bn_002 = if isnan(bpb_002) then nan else highestall(if peak_body == bpb_002 && !isAfterLastBn then bn else nan);
def p_002 = if isnan(bpb_002) then nan else if bn == bpb_bn_002 then peak else p_002[1];
def p_002_x = if isnan(bpb_002) then nan else if isnan(p_002) then p_002_x[1] else p_002;
plot peak_002 = if p_002_x != 0 && num_biggest >= 3 && bn > bpb_bn_002 then p_002_x else nan;
peak_002.setLineWeight(thiccer_line_weight); peak_002.hideTitle(); peak_002.setStyle(line_style); peak_002.setPaintingStrategy(line_type); peak_002.setDefaultColor(globalColor("peak")); peak_002.assignValueColor(globalColor("peak"));
#addchartbubble(num_biggest >= 3 && bn == bpb_bn_002, p_002_x, "bpb3: " + bpb_002 + "; " + p_002_x, globalColor("peak"));
addchartbubble(show_labels && !isnan(peak_002), peak_002, (if aggregation_period <= AggregationPeriod.MIN then "1 min" else if aggregation_period <= AggregationPeriod.TWO_MIN then "2 min" else if aggregation_period <= AggregationPeriod.THREE_MIN then "3 min" else if aggregation_period <= AggregationPeriod.FOUR_MIN then "4 min" else if aggregation_period <= AggregationPeriod.FIVE_MIN then "5 min" else if aggregation_period <= AggregationPeriod.TEN_MIN then "10 min" else if aggregation_period <= AggregationPeriod.FIFTEEN_MIN then "15 min" else if aggregation_period <= AggregationPeriod.TWENTY_MIN then "20 min" else if aggregation_period <= AggregationPeriod.THIRTY_MIN then "30 min" else if aggregation_period <= AggregationPeriod.HOUR then "1 hour" else if aggregation_period <= AggregationPeriod.TWO_HOURS then "2 hours" else if aggregation_period <= AggregationPeriod.FOUR_HOURS then "4 hours" else if aggregation_period <= AggregationPeriod.DAY then "1 day" else if aggregation_period <= AggregationPeriod.TWO_DAYS then "2 days" else if aggregation_period <= AggregationPeriod.THREE_DAYS then "3 days" else if aggregation_period <= AggregationPeriod.FOUR_DAYS then "4 days" else if aggregation_period <= AggregationPeriod.WEEK then "week" else if aggregation_period <= AggregationPeriod.MONTH then "month" else if aggregation_period <= AggregationPeriod.OPT_EXP then "opt exp" else if aggregation_period <= AggregationPeriod.QUARTER then "quarter" else "year") + " " + AsPrice(peak_002), globalColor("peak"));
# def mctb_002 = if num_biggest < 3 then nan else t_002_x + ((p_002_x - t_002_x) / 2 );
# def mctb_bn_002 = if num_biggest < 3 then nan else highestall(Max(btb_bn_002, bpb_bn_002));
# def mc_002 = if num_biggest < 3 then nan else if bn == mctb_bn_002 then mctb_002 else mc_002[1];
# def mc_002_x = if num_biggest < 3 then nan else if isnan(mc_002) then mc_002_x[1] else mc_002;
# plot midcandle_002 = if show_midcandles && num_biggest >= 3 && bn > mctb_bn_002 then mc_002_x else nan;
# midcandle_002.setLineWeight(thiccer_line_weight); midcandle_002.hideTitle(); midcandle_002.setStyle(line_style); midcandle_002.setPaintingStrategy(line_type); midcandle_002.setDefaultColor(globalColor("midcandle")); midcandle_002.assignValueColor(globalColor("midcandle"));
# #addchartbubble(num_biggest >= 2 && bn == mctb_bn_002, mc_002_x, "mctb2: " + mctb_002 + "; " + mc_002_x, globalColor("midcandle"));
def btb_003 = if num_biggest < 4 then nan else compoundvalue(1, if isvalley && valley_body > btb_003[1] && valley_body < btb_001 && valley_body < btb_002 && valley_body < biggest_valley_body then valley_body else btb_003[1], low);
def btb_bn_003 = if isnan(btb_003) then nan else highestall(if valley_body == btb_003 && !isAfterLastBn then bn else nan);
def t_003 = if isnan(btb_003) then nan else if bn == btb_bn_003 then valley else t_003[1];
def t_003_x = if isnan(btb_003) then nan else if isnan(t_003) then t_003_x[1] else t_003;
plot valley_003 = if t_003_x != 0 && num_biggest >= 4 && bn > btb_bn_003 then t_003_x else nan;
valley_003.setLineWeight(thiccer_line_weight); valley_003.hideTitle(); valley_003.setStyle(line_style); valley_003.setPaintingStrategy(line_type); valley_003.setDefaultColor(globalColor("valley")); valley_003.assignValueColor(globalColor("valley"));
#addchartbubble(num_biggest >= 3 && bn == btb_bn_003, t_003_x, "btb3: " + btb_003 + "; " + t_003_x, globalColor("valley"));
addchartbubble(show_labels && !isnan(btb_003), valley_003, (if aggregation_period <= AggregationPeriod.MIN then "1 min" else if aggregation_period <= AggregationPeriod.TWO_MIN then "2 min" else if aggregation_period <= AggregationPeriod.THREE_MIN then "3 min" else if aggregation_period <= AggregationPeriod.FOUR_MIN then "4 min" else if aggregation_period <= AggregationPeriod.FIVE_MIN then "5 min" else if aggregation_period <= AggregationPeriod.TEN_MIN then "10 min" else if aggregation_period <= AggregationPeriod.FIFTEEN_MIN then "15 min" else if aggregation_period <= AggregationPeriod.TWENTY_MIN then "20 min" else if aggregation_period <= AggregationPeriod.THIRTY_MIN then "30 min" else if aggregation_period <= AggregationPeriod.HOUR then "1 hour" else if aggregation_period <= AggregationPeriod.TWO_HOURS then "2 hours" else if aggregation_period <= AggregationPeriod.FOUR_HOURS then "4 hours" else if aggregation_period <= AggregationPeriod.DAY then "1 day" else if aggregation_period <= AggregationPeriod.TWO_DAYS then "2 days" else if aggregation_period <= AggregationPeriod.THREE_DAYS then "3 days" else if aggregation_period <= AggregationPeriod.FOUR_DAYS then "4 days" else if aggregation_period <= AggregationPeriod.WEEK then "week" else if aggregation_period <= AggregationPeriod.MONTH then "month" else if aggregation_period <= AggregationPeriod.OPT_EXP then "opt exp" else if aggregation_period <= AggregationPeriod.QUARTER then "quarter" else "year") + " " + AsPrice(valley_003), globalColor("valley"));
def bpb_003 = if num_biggest < 4 then nan else compoundvalue(1, if ispeak && peak_body > bpb_003[1] && peak_body < bpb_001 && peak_body < bpb_002 && peak_body < biggest_peak_body then peak_body else bpb_003[1], high);
def bpb_bn_003 = if isnan(bpb_003) then nan else highestall(if peak_body == bpb_003 && !isAfterLastBn then bn else nan);
def p_003 = if isnan(bpb_003) then nan else if bn == bpb_bn_003 then peak else p_003[1];
def p_003_x = if isnan(bpb_003) then nan else if isnan(p_003) then p_003_x[1] else p_003;
plot peak_003 = if p_003_x != 0 && num_biggest >= 4 && bn > bpb_bn_003 then p_003_x else nan;
peak_003.setLineWeight(thiccer_line_weight); peak_003.hideTitle(); peak_003.setStyle(line_style); peak_003.setPaintingStrategy(line_type); peak_003.setDefaultColor(globalColor("peak")); peak_003.assignValueColor(globalColor("peak"));
#addchartbubble(num_biggest >= 3 && bn == bpb_bn_003, p_003_x, "bpb3: " + bpb_003 + "; " + p_003_x, globalColor("peak"));
addchartbubble(show_labels && !isnan(peak_003), peak_003, (if aggregation_period <= AggregationPeriod.MIN then "1 min" else if aggregation_period <= AggregationPeriod.TWO_MIN then "2 min" else if aggregation_period <= AggregationPeriod.THREE_MIN then "3 min" else if aggregation_period <= AggregationPeriod.FOUR_MIN then "4 min" else if aggregation_period <= AggregationPeriod.FIVE_MIN then "5 min" else if aggregation_period <= AggregationPeriod.TEN_MIN then "10 min" else if aggregation_period <= AggregationPeriod.FIFTEEN_MIN then "15 min" else if aggregation_period <= AggregationPeriod.TWENTY_MIN then "20 min" else if aggregation_period <= AggregationPeriod.THIRTY_MIN then "30 min" else if aggregation_period <= AggregationPeriod.HOUR then "1 hour" else if aggregation_period <= AggregationPeriod.TWO_HOURS then "2 hours" else if aggregation_period <= AggregationPeriod.FOUR_HOURS then "4 hours" else if aggregation_period <= AggregationPeriod.DAY then "1 day" else if aggregation_period <= AggregationPeriod.TWO_DAYS then "2 days" else if aggregation_period <= AggregationPeriod.THREE_DAYS then "3 days" else if aggregation_period <= AggregationPeriod.FOUR_DAYS then "4 days" else if aggregation_period <= AggregationPeriod.WEEK then "week" else if aggregation_period <= AggregationPeriod.MONTH then "month" else if aggregation_period <= AggregationPeriod.OPT_EXP then "opt exp" else if aggregation_period <= AggregationPeriod.QUARTER then "quarter" else "year") + " " + AsPrice(peak_003), globalColor("peak"));
# def mctb_003 = if num_biggest < 4 then nan else t_003_x + ((p_003_x - t_003_x) / 2 );
# def mctb_bn_003 = if num_biggest < 4 then nan else highestall(Max(btb_bn_003, bpb_bn_003));
# def mc_003 = if num_biggest < 4 then nan else if bn == mctb_bn_003 then mctb_003 else mc_003[1];
# def mc_003_x = if num_biggest < 4 then nan else if isnan(mc_003) then mc_003_x[1] else mc_003;
# plot midcandle_003 = if show_midcandles && num_biggest >= 4 && bn > mctb_bn_003 then mc_003_x else nan;
# midcandle_003.setLineWeight(thiccer_line_weight); midcandle_003.hideTitle(); midcandle_003.setStyle(line_style); midcandle_003.setPaintingStrategy(line_type); midcandle_003.setDefaultColor(globalColor("midcandle")); midcandle_003.assignValueColor(globalColor("midcandle"));
# #addchartbubble(num_biggest >= 2 && bn == mctb_bn_003, mc_003_x, "mctb2: " + mctb_003 + "; " + mc_003_x, globalColor("midcandle"));
def btb_004 = if num_biggest < 5 then nan else compoundvalue(1, if isvalley && valley_body > btb_004[1] && valley_body < btb_001 && valley_body < btb_002 && valley_body < btb_003 && valley_body < biggest_valley_body then valley_body else btb_004[1], low);
def btb_bn_004 = if isnan(btb_004) then nan else highestall(if valley_body == btb_004 && !isAfterLastBn then bn else nan);
def t_004 = if isnan(btb_004) then nan else if bn == btb_bn_004 then valley else t_004[1];
def t_004_x = if isnan(btb_004) then nan else if isnan(t_004) then t_004_x[1] else t_004;
plot valley_004 = if t_004_x != 0 && num_biggest >= 5 && bn > btb_bn_004 then t_004_x else nan;
valley_004.setLineWeight(thiccer_line_weight); valley_004.hideTitle(); valley_004.setStyle(line_style); valley_004.setPaintingStrategy(line_type); valley_004.setDefaultColor(globalColor("valley")); valley_004.assignValueColor(globalColor("valley"));
#addchartbubble(num_biggest >= 3 && bn == btb_bn_004, t_004_x, "btb3: " + btb_004 + "; " + t_004_x, globalColor("valley"));
addchartbubble(show_labels && !isnan(btb_004), valley_004, (if aggregation_period <= AggregationPeriod.MIN then "1 min" else if aggregation_period <= AggregationPeriod.TWO_MIN then "2 min" else if aggregation_period <= AggregationPeriod.THREE_MIN then "3 min" else if aggregation_period <= AggregationPeriod.FOUR_MIN then "4 min" else if aggregation_period <= AggregationPeriod.FIVE_MIN then "5 min" else if aggregation_period <= AggregationPeriod.TEN_MIN then "10 min" else if aggregation_period <= AggregationPeriod.FIFTEEN_MIN then "15 min" else if aggregation_period <= AggregationPeriod.TWENTY_MIN then "20 min" else if aggregation_period <= AggregationPeriod.THIRTY_MIN then "30 min" else if aggregation_period <= AggregationPeriod.HOUR then "1 hour" else if aggregation_period <= AggregationPeriod.TWO_HOURS then "2 hours" else if aggregation_period <= AggregationPeriod.FOUR_HOURS then "4 hours" else if aggregation_period <= AggregationPeriod.DAY then "1 day" else if aggregation_period <= AggregationPeriod.TWO_DAYS then "2 days" else if aggregation_period <= AggregationPeriod.THREE_DAYS then "3 days" else if aggregation_period <= AggregationPeriod.FOUR_DAYS then "4 days" else if aggregation_period <= AggregationPeriod.WEEK then "week" else if aggregation_period <= AggregationPeriod.MONTH then "month" else if aggregation_period <= AggregationPeriod.OPT_EXP then "opt exp" else if aggregation_period <= AggregationPeriod.QUARTER then "quarter" else "year") + " " + AsPrice(valley_004), globalColor("valley"));
def bpb_004 = if num_biggest < 5 then nan else compoundvalue(1, if ispeak && peak_body > bpb_004[1] && peak_body < bpb_001 && peak_body < bpb_002 && peak_body < bpb_003 && peak_body < biggest_peak_body then peak_body else bpb_004[1], high);
def bpb_bn_004 = if isnan(bpb_004) then nan else highestall(if peak_body == bpb_004 && !isAfterLastBn then bn else nan);
def p_004 = if isnan(bpb_004) then nan else if bn == bpb_bn_004 then peak else p_004[1];
def p_004_x = if isnan(bpb_004) then nan else if isnan(p_004) then p_004_x[1] else p_004;
plot peak_004 = if p_004_x != 0 && num_biggest >= 5 && bn > bpb_bn_004 then p_004_x else nan;
peak_004.setLineWeight(thiccer_line_weight); peak_004.hideTitle(); peak_004.setStyle(line_style); peak_004.setPaintingStrategy(line_type); peak_004.setDefaultColor(globalColor("peak")); peak_004.assignValueColor(globalColor("peak"));
#addchartbubble(num_biggest >= 3 && bn == bpb_bn_004, p_004_x, "bpb3: " + bpb_004 + "; " + p_004_x, globalColor("peak"));
addchartbubble(show_labels && !isnan(peak_004), peak_004, (if aggregation_period <= AggregationPeriod.MIN then "1 min" else if aggregation_period <= AggregationPeriod.TWO_MIN then "2 min" else if aggregation_period <= AggregationPeriod.THREE_MIN then "3 min" else if aggregation_period <= AggregationPeriod.FOUR_MIN then "4 min" else if aggregation_period <= AggregationPeriod.FIVE_MIN then "5 min" else if aggregation_period <= AggregationPeriod.TEN_MIN then "10 min" else if aggregation_period <= AggregationPeriod.FIFTEEN_MIN then "15 min" else if aggregation_period <= AggregationPeriod.TWENTY_MIN then "20 min" else if aggregation_period <= AggregationPeriod.THIRTY_MIN then "30 min" else if aggregation_period <= AggregationPeriod.HOUR then "1 hour" else if aggregation_period <= AggregationPeriod.TWO_HOURS then "2 hours" else if aggregation_period <= AggregationPeriod.FOUR_HOURS then "4 hours" else if aggregation_period <= AggregationPeriod.DAY then "1 day" else if aggregation_period <= AggregationPeriod.TWO_DAYS then "2 days" else if aggregation_period <= AggregationPeriod.THREE_DAYS then "3 days" else if aggregation_period <= AggregationPeriod.FOUR_DAYS then "4 days" else if aggregation_period <= AggregationPeriod.WEEK then "week" else if aggregation_period <= AggregationPeriod.MONTH then "month" else if aggregation_period <= AggregationPeriod.OPT_EXP then "opt exp" else if aggregation_period <= AggregationPeriod.QUARTER then "quarter" else "year") + " " + AsPrice(peak_004), globalColor("peak"));
# def mctb_004 = if num_biggest < 5 then nan else t_004_x + ((p_004_x - t_004_x) / 2 );
# def mctb_bn_004 = if num_biggest < 5 then nan else highestall(Max(btb_bn_004, bpb_bn_004));
# def mc_004 = if num_biggest < 5 then nan else if bn == mctb_bn_004 then mctb_004 else mc_004[1];
# def mc_004_x = if num_biggest < 5 then nan else if isnan(mc_004) then mc_004_x[1] else mc_004;
# plot midcandle_004 = if show_midcandles && num_biggest >= 5 && bn > mctb_bn_004 then mc_004_x else nan;
# midcandle_004.setLineWeight(thiccer_line_weight); midcandle_004.hideTitle(); midcandle_004.setStyle(line_style); midcandle_004.setPaintingStrategy(line_type); midcandle_004.setDefaultColor(globalColor("midcandle")); midcandle_004.assignValueColor(globalColor("midcandle"));
# #addchartbubble(num_biggest >= 2 && bn == mctb_bn_004, mc_004_x, "mctb2: " + mctb_004 + "; " + mc_004_x, globalColor("midcandle"));
def btb_005 = if num_biggest < 6 then nan else compoundvalue(1, if isvalley && valley_body > btb_005[1] && valley_body < btb_001 && valley_body < btb_002 && valley_body < btb_003 && valley_body < btb_004 && valley_body < biggest_valley_body then valley_body else btb_005[1], low);
def btb_bn_005 = if isnan(btb_005) then nan else highestall(if valley_body == btb_005 && !isAfterLastBn then bn else nan);
def t_005 = if isnan(btb_005) then nan else if bn == btb_bn_005 then valley else t_005[1];
def t_005_x = if isnan(btb_005) then nan else if isnan(t_005) then t_005_x[1] else t_005;
plot valley_005 = if t_005_x != 0 && num_biggest >= 6 && bn > btb_bn_005 then t_005_x else nan;
valley_005.setLineWeight(thiccer_line_weight); valley_005.hideTitle(); valley_005.setStyle(line_style); valley_005.setPaintingStrategy(line_type); valley_005.setDefaultColor(globalColor("valley")); valley_005.assignValueColor(globalColor("valley"));
#addchartbubble(num_biggest >= 3 && bn == btb_bn_005, t_005_x, "btb3: " + btb_005 + "; " + t_005_x, globalColor("valley"));
addchartbubble(show_labels && !isnan(btb_005), valley_005, (if aggregation_period <= AggregationPeriod.MIN then "1 min" else if aggregation_period <= AggregationPeriod.TWO_MIN then "2 min" else if aggregation_period <= AggregationPeriod.THREE_MIN then "3 min" else if aggregation_period <= AggregationPeriod.FOUR_MIN then "4 min" else if aggregation_period <= AggregationPeriod.FIVE_MIN then "5 min" else if aggregation_period <= AggregationPeriod.TEN_MIN then "10 min" else if aggregation_period <= AggregationPeriod.FIFTEEN_MIN then "15 min" else if aggregation_period <= AggregationPeriod.TWENTY_MIN then "20 min" else if aggregation_period <= AggregationPeriod.THIRTY_MIN then "30 min" else if aggregation_period <= AggregationPeriod.HOUR then "1 hour" else if aggregation_period <= AggregationPeriod.TWO_HOURS then "2 hours" else if aggregation_period <= AggregationPeriod.FOUR_HOURS then "4 hours" else if aggregation_period <= AggregationPeriod.DAY then "1 day" else if aggregation_period <= AggregationPeriod.TWO_DAYS then "2 days" else if aggregation_period <= AggregationPeriod.THREE_DAYS then "3 days" else if aggregation_period <= AggregationPeriod.FOUR_DAYS then "4 days" else if aggregation_period <= AggregationPeriod.WEEK then "week" else if aggregation_period <= AggregationPeriod.MONTH then "month" else if aggregation_period <= AggregationPeriod.OPT_EXP then "opt exp" else if aggregation_period <= AggregationPeriod.QUARTER then "quarter" else "year") + " " + AsPrice(valley_005), globalColor("valley"));
def bpb_005 = if num_biggest < 6 then nan else compoundvalue(1, if ispeak && peak_body > bpb_005[1] && peak_body < bpb_001 && peak_body < bpb_002 && peak_body < bpb_003 && peak_body < bpb_004 && peak_body < biggest_peak_body then peak_body else bpb_005[1], high);
def bpb_bn_005 = if isnan(bpb_005) then nan else highestall(if peak_body == bpb_005 && !isAfterLastBn then bn else nan);
def p_005 = if isnan(bpb_005) then nan else if bn == bpb_bn_005 then peak else p_005[1];
def p_005_x = if isnan(bpb_005) then nan else if isnan(p_005) then p_005_x[1] else p_005;
plot peak_005 = if p_005_x != 0 && num_biggest >= 6 && bn > bpb_bn_005 then p_005_x else nan;
peak_005.setLineWeight(thiccer_line_weight); peak_005.hideTitle(); peak_005.setStyle(line_style); peak_005.setPaintingStrategy(line_type); peak_005.setDefaultColor(globalColor("peak")); peak_005.assignValueColor(globalColor("peak"));
#addchartbubble(num_biggest >= 3 && bn == bpb_bn_005, p_005_x, "bpb3: " + bpb_005 + "; " + p_005_x, globalColor("peak"));
addchartbubble(show_labels && !isnan(peak_005), peak_005, (if aggregation_period <= AggregationPeriod.MIN then "1 min" else if aggregation_period <= AggregationPeriod.TWO_MIN then "2 min" else if aggregation_period <= AggregationPeriod.THREE_MIN then "3 min" else if aggregation_period <= AggregationPeriod.FOUR_MIN then "4 min" else if aggregation_period <= AggregationPeriod.FIVE_MIN then "5 min" else if aggregation_period <= AggregationPeriod.TEN_MIN then "10 min" else if aggregation_period <= AggregationPeriod.FIFTEEN_MIN then "15 min" else if aggregation_period <= AggregationPeriod.TWENTY_MIN then "20 min" else if aggregation_period <= AggregationPeriod.THIRTY_MIN then "30 min" else if aggregation_period <= AggregationPeriod.HOUR then "1 hour" else if aggregation_period <= AggregationPeriod.TWO_HOURS then "2 hours" else if aggregation_period <= AggregationPeriod.FOUR_HOURS then "4 hours" else if aggregation_period <= AggregationPeriod.DAY then "1 day" else if aggregation_period <= AggregationPeriod.TWO_DAYS then "2 days" else if aggregation_period <= AggregationPeriod.THREE_DAYS then "3 days" else if aggregation_period <= AggregationPeriod.FOUR_DAYS then "4 days" else if aggregation_period <= AggregationPeriod.WEEK then "week" else if aggregation_period <= AggregationPeriod.MONTH then "month" else if aggregation_period <= AggregationPeriod.OPT_EXP then "opt exp" else if aggregation_period <= AggregationPeriod.QUARTER then "quarter" else "year") + " " + AsPrice(peak_005), globalColor("peak"));
# def mctb_005 = if num_biggest < 6 then nan else t_005_x + ((p_005_x - t_005_x) / 2 );
# def mctb_bn_005 = if num_biggest < 6 then nan else highestall(Max(btb_bn_005, bpb_bn_005));
# def mc_005 = if num_biggest < 6 then nan else if bn == mctb_bn_005 then mctb_005 else mc_005[1];
# def mc_005_x = if num_biggest < 6 then nan else if isnan(mc_005) then mc_005_x[1] else mc_005;
# plot midcandle_005 = if show_midcandles && num_biggest >= 6 && bn > mctb_bn_005 then mc_005_x else nan;
# midcandle_005.setLineWeight(thiccer_line_weight); midcandle_005.hideTitle(); midcandle_005.setStyle(line_style); midcandle_005.setPaintingStrategy(line_type); midcandle_005.setDefaultColor(globalColor("midcandle")); midcandle_005.assignValueColor(globalColor("midcandle"));
# #addchartbubble(num_biggest >= 2 && bn == mctb_bn_005, mc_005_x, "mctb2: " + mctb_005 + "; " + mc_005_x, globalColor("midcandle"));
def btb_006 = if num_biggest < 7 then nan else compoundvalue(1, if isvalley && valley_body > btb_006[1] && valley_body < btb_001 && valley_body < btb_002 && valley_body < btb_003 && valley_body < btb_004 && valley_body < btb_005 && valley_body < biggest_valley_body then valley_body else btb_006[1], low);
def btb_bn_006 = if isnan(btb_006) then nan else highestall(if valley_body == btb_006 && !isAfterLastBn then bn else nan);
def t_006 = if isnan(btb_006) then nan else if bn == btb_bn_006 then valley else t_006[1];
def t_006_x = if isnan(btb_006) then nan else if isnan(t_006) then t_006_x[1] else t_006;
plot valley_006 = if t_006_x != 0 && num_biggest >= 7 && bn > btb_bn_006 then t_006_x else nan;
valley_006.setLineWeight(thiccer_line_weight); valley_006.hideTitle(); valley_006.setStyle(line_style); valley_006.setPaintingStrategy(line_type); valley_006.setDefaultColor(globalColor("valley")); valley_006.assignValueColor(globalColor("valley"));
#addchartbubble(num_biggest >= 3 && bn == btb_bn_006, t_006_x, "btb3: " + btb_006 + "; " + t_006_x, globalColor("valley"));
addchartbubble(show_labels && !isnan(btb_006), valley_006, (if aggregation_period <= AggregationPeriod.MIN then "1 min" else if aggregation_period <= AggregationPeriod.TWO_MIN then "2 min" else if aggregation_period <= AggregationPeriod.THREE_MIN then "3 min" else if aggregation_period <= AggregationPeriod.FOUR_MIN then "4 min" else if aggregation_period <= AggregationPeriod.FIVE_MIN then "5 min" else if aggregation_period <= AggregationPeriod.TEN_MIN then "10 min" else if aggregation_period <= AggregationPeriod.FIFTEEN_MIN then "15 min" else if aggregation_period <= AggregationPeriod.TWENTY_MIN then "20 min" else if aggregation_period <= AggregationPeriod.THIRTY_MIN then "30 min" else if aggregation_period <= AggregationPeriod.HOUR then "1 hour" else if aggregation_period <= AggregationPeriod.TWO_HOURS then "2 hours" else if aggregation_period <= AggregationPeriod.FOUR_HOURS then "4 hours" else if aggregation_period <= AggregationPeriod.DAY then "1 day" else if aggregation_period <= AggregationPeriod.TWO_DAYS then "2 days" else if aggregation_period <= AggregationPeriod.THREE_DAYS then "3 days" else if aggregation_period <= AggregationPeriod.FOUR_DAYS then "4 days" else if aggregation_period <= AggregationPeriod.WEEK then "week" else if aggregation_period <= AggregationPeriod.MONTH then "month" else if aggregation_period <= AggregationPeriod.OPT_EXP then "opt exp" else if aggregation_period <= AggregationPeriod.QUARTER then "quarter" else "year") + " " + AsPrice(valley_006), globalColor("valley"));
def bpb_006 = if num_biggest < 7 then nan else compoundvalue(1, if ispeak && peak_body > bpb_006[1] && peak_body < bpb_001 && peak_body < bpb_002 && peak_body < bpb_003 && peak_body < bpb_004 && peak_body < bpb_005 && peak_body < biggest_peak_body then peak_body else bpb_006[1], high);
def bpb_bn_006 = if isnan(bpb_006) then nan else highestall(if peak_body == bpb_006 && !isAfterLastBn then bn else nan);
def p_006 = if isnan(bpb_006) then nan else if bn == bpb_bn_006 then peak else p_006[1];
def p_006_x = if isnan(bpb_006) then nan else if isnan(p_006) then p_006_x[1] else p_006;
plot peak_006 = if p_006_x != 0 && num_biggest >= 7 && bn > bpb_bn_006 then p_006_x else nan;
peak_006.setLineWeight(thiccer_line_weight); peak_006.hideTitle(); peak_006.setStyle(line_style); peak_006.setPaintingStrategy(line_type); peak_006.setDefaultColor(globalColor("peak")); peak_006.assignValueColor(globalColor("peak"));
#addchartbubble(num_biggest >= 3 && bn == bpb_bn_006, p_006_x, "bpb3: " + bpb_006 + "; " + p_006_x, globalColor("peak"));
addchartbubble(show_labels && !isnan(peak_006), peak_006, (if aggregation_period <= AggregationPeriod.MIN then "1 min" else if aggregation_period <= AggregationPeriod.TWO_MIN then "2 min" else if aggregation_period <= AggregationPeriod.THREE_MIN then "3 min" else if aggregation_period <= AggregationPeriod.FOUR_MIN then "4 min" else if aggregation_period <= AggregationPeriod.FIVE_MIN then "5 min" else if aggregation_period <= AggregationPeriod.TEN_MIN then "10 min" else if aggregation_period <= AggregationPeriod.FIFTEEN_MIN then "15 min" else if aggregation_period <= AggregationPeriod.TWENTY_MIN then "20 min" else if aggregation_period <= AggregationPeriod.THIRTY_MIN then "30 min" else if aggregation_period <= AggregationPeriod.HOUR then "1 hour" else if aggregation_period <= AggregationPeriod.TWO_HOURS then "2 hours" else if aggregation_period <= AggregationPeriod.FOUR_HOURS then "4 hours" else if aggregation_period <= AggregationPeriod.DAY then "1 day" else if aggregation_period <= AggregationPeriod.TWO_DAYS then "2 days" else if aggregation_period <= AggregationPeriod.THREE_DAYS then "3 days" else if aggregation_period <= AggregationPeriod.FOUR_DAYS then "4 days" else if aggregation_period <= AggregationPeriod.WEEK then "week" else if aggregation_period <= AggregationPeriod.MONTH then "month" else if aggregation_period <= AggregationPeriod.OPT_EXP then "opt exp" else if aggregation_period <= AggregationPeriod.QUARTER then "quarter" else "year") + " " + AsPrice(peak_006), globalColor("peak"));
# def mctb_006 = if num_biggest < 7 then nan else t_006_x + ((p_006_x - t_006_x) / 2 );
# def mctb_bn_006 = if num_biggest < 7 then nan else highestall(Max(btb_bn_006, bpb_bn_006));
# def mc_006 = if num_biggest < 7 then nan else if bn == mctb_bn_006 then mctb_006 else mc_006[1];
# def mc_006_x = if num_biggest < 7 then nan else if isnan(mc_006) then mc_006_x[1] else mc_006;
# plot midcandle_006 = if show_midcandles && num_biggest >= 7 && bn > mctb_bn_006 then mc_006_x else nan;
# midcandle_006.setLineWeight(thiccer_line_weight); midcandle_006.hideTitle(); midcandle_006.setStyle(line_style); midcandle_006.setPaintingStrategy(line_type); midcandle_006.setDefaultColor(globalColor("midcandle")); midcandle_006.assignValueColor(globalColor("midcandle"));
# #addchartbubble(num_biggest >= 2 && bn == mctb_bn_006, mc_006_x, "mctb2: " + mctb_006 + "; " + mc_006_x, globalColor("midcandle"));
def btb_007 = if num_biggest < 8 then nan else compoundvalue(1, if isvalley && valley_body > btb_007[1] && valley_body < btb_001 && valley_body < btb_002 && valley_body < btb_003 && valley_body < btb_004 && valley_body < btb_005 && valley_body < btb_006 && valley_body < biggest_valley_body then valley_body else btb_007[1], low);
def btb_bn_007 = if isnan(btb_007) then nan else highestall(if valley_body == btb_007 && !isAfterLastBn then bn else nan);
def t_007 = if isnan(btb_007) then nan else if bn == btb_bn_007 then valley else t_007[1];
def t_007_x = if isnan(btb_007) then nan else if isnan(t_007) then t_007_x[1] else t_007;
plot valley_007 = if t_007_x != 0 && num_biggest >= 8 && bn > btb_bn_007 then t_007_x else nan;
valley_007.setLineWeight(thiccer_line_weight); valley_007.hideTitle(); valley_007.setStyle(line_style); valley_007.setPaintingStrategy(line_type); valley_007.setDefaultColor(globalColor("valley")); valley_007.assignValueColor(globalColor("valley"));
#addchartbubble(num_biggest >= 3 && bn == btb_bn_007, t_007_x, "btb3: " + btb_007 + "; " + t_007_x, globalColor("valley"));
addchartbubble(show_labels && !isnan(btb_007), valley_007, (if aggregation_period <= AggregationPeriod.MIN then "1 min" else if aggregation_period <= AggregationPeriod.TWO_MIN then "2 min" else if aggregation_period <= AggregationPeriod.THREE_MIN then "3 min" else if aggregation_period <= AggregationPeriod.FOUR_MIN then "4 min" else if aggregation_period <= AggregationPeriod.FIVE_MIN then "5 min" else if aggregation_period <= AggregationPeriod.TEN_MIN then "10 min" else if aggregation_period <= AggregationPeriod.FIFTEEN_MIN then "15 min" else if aggregation_period <= AggregationPeriod.TWENTY_MIN then "20 min" else if aggregation_period <= AggregationPeriod.THIRTY_MIN then "30 min" else if aggregation_period <= AggregationPeriod.HOUR then "1 hour" else if aggregation_period <= AggregationPeriod.TWO_HOURS then "2 hours" else if aggregation_period <= AggregationPeriod.FOUR_HOURS then "4 hours" else if aggregation_period <= AggregationPeriod.DAY then "1 day" else if aggregation_period <= AggregationPeriod.TWO_DAYS then "2 days" else if aggregation_period <= AggregationPeriod.THREE_DAYS then "3 days" else if aggregation_period <= AggregationPeriod.FOUR_DAYS then "4 days" else if aggregation_period <= AggregationPeriod.WEEK then "week" else if aggregation_period <= AggregationPeriod.MONTH then "month" else if aggregation_period <= AggregationPeriod.OPT_EXP then "opt exp" else if aggregation_period <= AggregationPeriod.QUARTER then "quarter" else "year") + " " + AsPrice(valley_007), globalColor("valley"));
def bpb_007 = if num_biggest < 8 then nan else compoundvalue(1, if ispeak && peak_body > bpb_007[1] && peak_body < bpb_001 && peak_body < bpb_002 && peak_body < bpb_003 && peak_body < bpb_004 && peak_body < bpb_005 && peak_body < bpb_006 && peak_body < biggest_peak_body then peak_body else bpb_007[1], high);
def bpb_bn_007 = if isnan(bpb_007) then nan else highestall(if peak_body == bpb_007 && !isAfterLastBn then bn else nan);
def p_007 = if isnan(bpb_007) then nan else if bn == bpb_bn_007 then peak else p_007[1];
def p_007_x = if isnan(bpb_007) then nan else if isnan(p_007) then p_007_x[1] else p_007;
plot peak_007 = if p_007_x != 0 && num_biggest >= 8 && bn > bpb_bn_007 then p_007_x else nan;
peak_007.setLineWeight(thiccer_line_weight); peak_007.hideTitle(); peak_007.setStyle(line_style); peak_007.setPaintingStrategy(line_type); peak_007.setDefaultColor(globalColor("peak")); peak_007.assignValueColor(globalColor("peak"));
#addchartbubble(num_biggest >= 3 && bn == bpb_bn_007, p_007_x, "bpb3: " + bpb_007 + "; " + p_007_x, globalColor("peak"));
addchartbubble(show_labels && !isnan(peak_007), peak_007, (if aggregation_period <= AggregationPeriod.MIN then "1 min" else if aggregation_period <= AggregationPeriod.TWO_MIN then "2 min" else if aggregation_period <= AggregationPeriod.THREE_MIN then "3 min" else if aggregation_period <= AggregationPeriod.FOUR_MIN then "4 min" else if aggregation_period <= AggregationPeriod.FIVE_MIN then "5 min" else if aggregation_period <= AggregationPeriod.TEN_MIN then "10 min" else if aggregation_period <= AggregationPeriod.FIFTEEN_MIN then "15 min" else if aggregation_period <= AggregationPeriod.TWENTY_MIN then "20 min" else if aggregation_period <= AggregationPeriod.THIRTY_MIN then "30 min" else if aggregation_period <= AggregationPeriod.HOUR then "1 hour" else if aggregation_period <= AggregationPeriod.TWO_HOURS then "2 hours" else if aggregation_period <= AggregationPeriod.FOUR_HOURS then "4 hours" else if aggregation_period <= AggregationPeriod.DAY then "1 day" else if aggregation_period <= AggregationPeriod.TWO_DAYS then "2 days" else if aggregation_period <= AggregationPeriod.THREE_DAYS then "3 days" else if aggregation_period <= AggregationPeriod.FOUR_DAYS then "4 days" else if aggregation_period <= AggregationPeriod.WEEK then "week" else if aggregation_period <= AggregationPeriod.MONTH then "month" else if aggregation_period <= AggregationPeriod.OPT_EXP then "opt exp" else if aggregation_period <= AggregationPeriod.QUARTER then "quarter" else "year") + " " + AsPrice(peak_007), globalColor("peak"));
# def mctb_007 = if num_biggest < 8 then nan else t_007_x + ((p_007_x - t_007_x) / 2 );
# def mctb_bn_007 = if num_biggest < 8 then nan else highestall(Max(btb_bn_007, bpb_bn_007));
# def mc_007 = if num_biggest < 8 then nan else if bn == mctb_bn_007 then mctb_007 else mc_007[1];
# def mc_007_x = if num_biggest < 8 then nan else if isnan(mc_007) then mc_007_x[1] else mc_007;
# plot midcandle_007 = if show_midcandles && num_biggest >= 8 && bn > mctb_bn_007 then mc_007_x else nan;
# midcandle_007.setLineWeight(thiccer_line_weight); midcandle_007.hideTitle(); midcandle_007.setStyle(line_style); midcandle_007.setPaintingStrategy(line_type); midcandle_007.setDefaultColor(globalColor("midcandle")); midcandle_007.assignValueColor(globalColor("midcandle"));
# #addchartbubble(num_biggest >= 2 && bn == mctb_bn_007, mc_007_x, "mctb2: " + mctb_007 + "; " + mc_007_x, globalColor("midcandle"));
def btb_008 = if num_biggest < 9 then nan else compoundvalue(1, if isvalley && valley_body > btb_008[1] && valley_body < btb_001 && valley_body < btb_002 && valley_body < btb_003 && valley_body < btb_004 && valley_body < btb_005 && valley_body < btb_006 && valley_body < btb_007 && valley_body < biggest_valley_body then valley_body else btb_008[1], low);
def btb_bn_008 = if isnan(btb_008) then nan else highestall(if valley_body == btb_008 && !isAfterLastBn then bn else nan);
def t_008 = if isnan(btb_008) then nan else if bn == btb_bn_008 then valley else t_008[1];
def t_008_x = if isnan(btb_008) then nan else if isnan(t_008) then t_008_x[1] else t_008;
plot valley_008 = if t_008_x != 0 && num_biggest >= 9 && bn > btb_bn_008 then t_008_x else nan;
valley_008.setLineWeight(thiccer_line_weight); valley_008.hideTitle(); valley_008.setStyle(line_style); valley_008.setPaintingStrategy(line_type); valley_008.setDefaultColor(globalColor("valley")); valley_008.assignValueColor(globalColor("valley"));
#addchartbubble(num_biggest >= 3 && bn == btb_bn_008, t_008_x, "btb3: " + btb_008 + "; " + t_008_x, globalColor("valley"));
addchartbubble(show_labels && !isnan(btb_008), valley_008, (if aggregation_period <= AggregationPeriod.MIN then "1 min" else if aggregation_period <= AggregationPeriod.TWO_MIN then "2 min" else if aggregation_period <= AggregationPeriod.THREE_MIN then "3 min" else if aggregation_period <= AggregationPeriod.FOUR_MIN then "4 min" else if aggregation_period <= AggregationPeriod.FIVE_MIN then "5 min" else if aggregation_period <= AggregationPeriod.TEN_MIN then "10 min" else if aggregation_period <= AggregationPeriod.FIFTEEN_MIN then "15 min" else if aggregation_period <= AggregationPeriod.TWENTY_MIN then "20 min" else if aggregation_period <= AggregationPeriod.THIRTY_MIN then "30 min" else if aggregation_period <= AggregationPeriod.HOUR then "1 hour" else if aggregation_period <= AggregationPeriod.TWO_HOURS then "2 hours" else if aggregation_period <= AggregationPeriod.FOUR_HOURS then "4 hours" else if aggregation_period <= AggregationPeriod.DAY then "1 day" else if aggregation_period <= AggregationPeriod.TWO_DAYS then "2 days" else if aggregation_period <= AggregationPeriod.THREE_DAYS then "3 days" else if aggregation_period <= AggregationPeriod.FOUR_DAYS then "4 days" else if aggregation_period <= AggregationPeriod.WEEK then "week" else if aggregation_period <= AggregationPeriod.MONTH then "month" else if aggregation_period <= AggregationPeriod.OPT_EXP then "opt exp" else if aggregation_period <= AggregationPeriod.QUARTER then "quarter" else "year") + " " + AsPrice(valley_008), globalColor("valley"));
def bpb_008 = if num_biggest < 9 then nan else compoundvalue(1, if ispeak && peak_body > bpb_008[1] && peak_body < bpb_001 && peak_body < bpb_002 && peak_body < bpb_003 && peak_body < bpb_004 && peak_body < bpb_005 && peak_body < bpb_006 && peak_body < bpb_007 && peak_body < biggest_peak_body then peak_body else bpb_008[1], high);
def bpb_bn_008 = if isnan(bpb_008) then nan else highestall(if peak_body == bpb_008 && !isAfterLastBn then bn else nan);
def p_008 = if isnan(bpb_008) then nan else if bn == bpb_bn_008 then peak else p_008[1];
def p_008_x = if isnan(bpb_008) then nan else if isnan(p_008) then p_008_x[1] else p_008;
plot peak_008 = if p_008_x != 0 && num_biggest >= 9 && bn > bpb_bn_008 then p_008_x else nan;
peak_008.setLineWeight(thiccer_line_weight); peak_008.hideTitle(); peak_008.setStyle(line_style); peak_008.setPaintingStrategy(line_type); peak_008.setDefaultColor(globalColor("peak")); peak_008.assignValueColor(globalColor("peak"));
#addchartbubble(num_biggest >= 3 && bn == bpb_bn_008, p_008_x, "bpb3: " + bpb_008 + "; " + p_008_x, globalColor("peak"));
addchartbubble(show_labels && !isnan(peak_008), peak_008, (if aggregation_period <= AggregationPeriod.MIN then "1 min" else if aggregation_period <= AggregationPeriod.TWO_MIN then "2 min" else if aggregation_period <= AggregationPeriod.THREE_MIN then "3 min" else if aggregation_period <= AggregationPeriod.FOUR_MIN then "4 min" else if aggregation_period <= AggregationPeriod.FIVE_MIN then "5 min" else if aggregation_period <= AggregationPeriod.TEN_MIN then "10 min" else if aggregation_period <= AggregationPeriod.FIFTEEN_MIN then "15 min" else if aggregation_period <= AggregationPeriod.TWENTY_MIN then "20 min" else if aggregation_period <= AggregationPeriod.THIRTY_MIN then "30 min" else if aggregation_period <= AggregationPeriod.HOUR then "1 hour" else if aggregation_period <= AggregationPeriod.TWO_HOURS then "2 hours" else if aggregation_period <= AggregationPeriod.FOUR_HOURS then "4 hours" else if aggregation_period <= AggregationPeriod.DAY then "1 day" else if aggregation_period <= AggregationPeriod.TWO_DAYS then "2 days" else if aggregation_period <= AggregationPeriod.THREE_DAYS then "3 days" else if aggregation_period <= AggregationPeriod.FOUR_DAYS then "4 days" else if aggregation_period <= AggregationPeriod.WEEK then "week" else if aggregation_period <= AggregationPeriod.MONTH then "month" else if aggregation_period <= AggregationPeriod.OPT_EXP then "opt exp" else if aggregation_period <= AggregationPeriod.QUARTER then "quarter" else "year") + " " + AsPrice(peak_008), globalColor("peak"));
# def mctb_008 = if num_biggest < 9 then nan else t_008_x + ((p_008_x - t_008_x) / 2 );
# def mctb_bn_008 = if num_biggest < 9 then nan else highestall(Max(btb_bn_008, bpb_bn_008));
# def mc_008 = if num_biggest < 9 then nan else if bn == mctb_bn_008 then mctb_008 else mc_008[1];
# def mc_008_x = if num_biggest < 9 then nan else if isnan(mc_008) then mc_008_x[1] else mc_008;
# plot midcandle_008 = if show_midcandles && num_biggest >= 9 && bn > mctb_bn_008 then mc_008_x else nan;
# midcandle_008.setLineWeight(thiccer_line_weight); midcandle_008.hideTitle(); midcandle_008.setStyle(line_style); midcandle_008.setPaintingStrategy(line_type); midcandle_008.setDefaultColor(globalColor("midcandle")); midcandle_008.assignValueColor(globalColor("midcandle"));
# #addchartbubble(num_biggest >= 2 && bn == mctb_bn_008, mc_008_x, "mctb2: " + mctb_008 + "; " + mc_008_x, globalColor("midcandle"));
# plot most recent peaks and valleys that qualify; newer will overwrite older naturally. User can change the range if they want more or fewer lines
def pbn_ = if num_lines < 1 then nan else compoundvalue(1, if isPeak then bn else pbn_[1], high);
def p_ = if num_lines < 1 then nan else compoundvalue(1, if bn == pbn_ then peak else p_[1], high);
def p_x = if num_lines < 1 then nan else compoundvalue(1, if isnan(p_) then p_x[1] else p_, high); # this is because sometimes the higher level is not valid, like a 4h or a d aggregation period is nan over the weekend. assholes.
#plot p = if num_lines < 1 then nan else p_x; p.setLineWeight(line_weight); p.setDefaultColor(globalcolor("peak")); p.assignValueColor(globalcolor("peak")); p.hideTitle(); p.setStyle(line_style); p.setPaintingStrategy(line_type);
#addchartbubble(bn == pbn_, p_x, ": " + pbn + "; " + p_x, globalColor("peak"));
def pbn_01 = if num_lines < 1 then nan else highestall(if bn == 1 then 0 else if p_x != p_x[1] then bn else nan);
def p_01 = if num_lines < 1 then nan else compoundvalue(1, if bn == pbn_01 then p_x else p_01[1], high);
plot peak_01 = if p_01 != 0 && bn > pbn_01 && num_lines >= 1 then p_01 else nan;
peak_01.setLineWeight(line_weight); peak_01.hideTitle(); peak_01.setStyle(line_style); peak_01.setPaintingStrategy(line_type); peak_01.setDefaultColor(globalColor("peak")); peak_01.assignValueColor(globalColor("peak"));
#addchartbubble(bn == pbn_01, p_x, "1: " + "; " + p_x, globalColor("peak"));
addchartbubble(show_labels && !isnan(peak_01), peak_01, (if aggregation_period <= AggregationPeriod.MIN then "1 min" else if aggregation_period <= AggregationPeriod.TWO_MIN then "2 min" else if aggregation_period <= AggregationPeriod.THREE_MIN then "3 min" else if aggregation_period <= AggregationPeriod.FOUR_MIN then "4 min" else if aggregation_period <= AggregationPeriod.FIVE_MIN then "5 min" else if aggregation_period <= AggregationPeriod.TEN_MIN then "10 min" else if aggregation_period <= AggregationPeriod.FIFTEEN_MIN then "15 min" else if aggregation_period <= AggregationPeriod.TWENTY_MIN then "20 min" else if aggregation_period <= AggregationPeriod.THIRTY_MIN then "30 min" else if aggregation_period <= AggregationPeriod.HOUR then "1 hour" else if aggregation_period <= AggregationPeriod.TWO_HOURS then "2 hours" else if aggregation_period <= AggregationPeriod.FOUR_HOURS then "4 hours" else if aggregation_period <= AggregationPeriod.DAY then "1 day" else if aggregation_period <= AggregationPeriod.TWO_DAYS then "2 days" else if aggregation_period <= AggregationPeriod.THREE_DAYS then "3 days" else if aggregation_period <= AggregationPeriod.FOUR_DAYS then "4 days" else if aggregation_period <= AggregationPeriod.WEEK then "week" else if aggregation_period <= AggregationPeriod.MONTH then "month" else if aggregation_period <= AggregationPeriod.OPT_EXP then "opt exp" else if aggregation_period <= AggregationPeriod.QUARTER then "quarter" else "year") + " " + AsPrice(peak_01), globalColor("peak"));
def pbn_02 = if num_lines < 2 then nan else highestall(if bn == 1 then 0 else if p_x != p_x[1] && p_01 != p_x then bn else nan);
def p_02 = if num_lines < 2 then nan else compoundvalue(1, if bn == pbn_02 then p_x else p_02[1], high);
plot peak_02 = if p_01 != p_02 && p_02 != 0 && bn > pbn_02 && num_lines >= 2 then p_02 else nan;
peak_02.setLineWeight(line_weight); peak_02.hideTitle(); peak_02.setStyle(line_style); peak_02.setPaintingStrategy(line_type); peak_02.setDefaultColor(globalColor("peak")); peak_02.assignValueColor(globalColor("peak"));
#addchartbubble(bn == pbn_02, p_x, "2: " + "; " + p_x, globalColor("peak"));
addchartbubble(show_labels && !isnan(peak_02), peak_02, (if aggregation_period <= AggregationPeriod.MIN then "1 min" else if aggregation_period <= AggregationPeriod.TWO_MIN then "2 min" else if aggregation_period <= AggregationPeriod.THREE_MIN then "3 min" else if aggregation_period <= AggregationPeriod.FOUR_MIN then "4 min" else if aggregation_period <= AggregationPeriod.FIVE_MIN then "5 min" else if aggregation_period <= AggregationPeriod.TEN_MIN then "10 min" else if aggregation_period <= AggregationPeriod.FIFTEEN_MIN then "15 min" else if aggregation_period <= AggregationPeriod.TWENTY_MIN then "20 min" else if aggregation_period <= AggregationPeriod.THIRTY_MIN then "30 min" else if aggregation_period <= AggregationPeriod.HOUR then "1 hour" else if aggregation_period <= AggregationPeriod.TWO_HOURS then "2 hours" else if aggregation_period <= AggregationPeriod.FOUR_HOURS then "4 hours" else if aggregation_period <= AggregationPeriod.DAY then "1 day" else if aggregation_period <= AggregationPeriod.TWO_DAYS then "2 days" else if aggregation_period <= AggregationPeriod.THREE_DAYS then "3 days" else if aggregation_period <= AggregationPeriod.FOUR_DAYS then "4 days" else if aggregation_period <= AggregationPeriod.WEEK then "week" else if aggregation_period <= AggregationPeriod.MONTH then "month" else if aggregation_period <= AggregationPeriod.OPT_EXP then "opt exp" else if aggregation_period <= AggregationPeriod.QUARTER then "quarter" else "year") + " " + AsPrice(peak_02), globalColor("peak"));
def pbn_03 = if num_lines < 3 then nan else highestall(if bn == 1 then 0 else if p_x != p_x[1] && p_01 != p_x && p_02 != p_x then bn else nan);
def p_03 = if num_lines < 3 then nan else compoundvalue(1, if bn == pbn_03 then p_x else p_03[1], high);
plot peak_03 = if p_02 != p_03 && p_03 != 0 && bn > pbn_03 && num_lines >= 3 then p_03 else nan;
peak_03.setLineWeight(line_weight); peak_03.hideTitle(); peak_03.setStyle(line_style); peak_03.setPaintingStrategy(line_type); peak_03.setDefaultColor(globalColor("peak")); peak_03.assignValueColor(globalColor("peak"));
#addchartbubble(bn == pbn_03, p_x, "3: " + "; " + p_x, globalColor("peak"));
addchartbubble(show_labels && !isnan(peak_03), peak_03, (if aggregation_period <= AggregationPeriod.MIN then "1 min" else if aggregation_period <= AggregationPeriod.TWO_MIN then "2 min" else if aggregation_period <= AggregationPeriod.THREE_MIN then "3 min" else if aggregation_period <= AggregationPeriod.FOUR_MIN then "4 min" else if aggregation_period <= AggregationPeriod.FIVE_MIN then "5 min" else if aggregation_period <= AggregationPeriod.TEN_MIN then "10 min" else if aggregation_period <= AggregationPeriod.FIFTEEN_MIN then "15 min" else if aggregation_period <= AggregationPeriod.TWENTY_MIN then "20 min" else if aggregation_period <= AggregationPeriod.THIRTY_MIN then "30 min" else if aggregation_period <= AggregationPeriod.HOUR then "1 hour" else if aggregation_period <= AggregationPeriod.TWO_HOURS then "2 hours" else if aggregation_period <= AggregationPeriod.FOUR_HOURS then "4 hours" else if aggregation_period <= AggregationPeriod.DAY then "1 day" else if aggregation_period <= AggregationPeriod.TWO_DAYS then "2 days" else if aggregation_period <= AggregationPeriod.THREE_DAYS then "3 days" else if aggregation_period <= AggregationPeriod.FOUR_DAYS then "4 days" else if aggregation_period <= AggregationPeriod.WEEK then "week" else if aggregation_period <= AggregationPeriod.MONTH then "month" else if aggregation_period <= AggregationPeriod.OPT_EXP then "opt exp" else if aggregation_period <= AggregationPeriod.QUARTER then "quarter" else "year") + " " + AsPrice(peak_03), globalColor("peak"));
def pbn_04 = if num_lines < 4 then nan else highestall(if bn == 1 then 0 else if p_x != p_x[1] && p_01 != p_x && p_02 != p_x && p_03 != p_x then bn else nan);
def p_04 = if num_lines < 4 then nan else compoundvalue(1, if bn == pbn_04 then p_x else p_04[1], high);
plot peak_04 = if p_03 != p_04 && p_04 != 0 && bn > pbn_04 && num_lines >= 4 then p_04 else nan;
peak_04.setLineWeight(line_weight); peak_04.hideTitle(); peak_04.setStyle(line_style); peak_04.setPaintingStrategy(line_type); peak_04.setDefaultColor(globalColor("peak")); peak_04.assignValueColor(globalColor("peak"));
#addchartbubble(bn == pbn_04, p_x, "4: " + "; " + p_x, globalColor("peak"));
addchartbubble(show_labels && !isnan(peak_04), peak_04, (if aggregation_period <= AggregationPeriod.MIN then "1 min" else if aggregation_period <= AggregationPeriod.TWO_MIN then "2 min" else if aggregation_period <= AggregationPeriod.THREE_MIN then "3 min" else if aggregation_period <= AggregationPeriod.FOUR_MIN then "4 min" else if aggregation_period <= AggregationPeriod.FIVE_MIN then "5 min" else if aggregation_period <= AggregationPeriod.TEN_MIN then "10 min" else if aggregation_period <= AggregationPeriod.FIFTEEN_MIN then "15 min" else if aggregation_period <= AggregationPeriod.TWENTY_MIN then "20 min" else if aggregation_period <= AggregationPeriod.THIRTY_MIN then "30 min" else if aggregation_period <= AggregationPeriod.HOUR then "1 hour" else if aggregation_period <= AggregationPeriod.TWO_HOURS then "2 hours" else if aggregation_period <= AggregationPeriod.FOUR_HOURS then "4 hours" else if aggregation_period <= AggregationPeriod.DAY then "1 day" else if aggregation_period <= AggregationPeriod.TWO_DAYS then "2 days" else if aggregation_period <= AggregationPeriod.THREE_DAYS then "3 days" else if aggregation_period <= AggregationPeriod.FOUR_DAYS then "4 days" else if aggregation_period <= AggregationPeriod.WEEK then "week" else if aggregation_period <= AggregationPeriod.MONTH then "month" else if aggregation_period <= AggregationPeriod.OPT_EXP then "opt exp" else if aggregation_period <= AggregationPeriod.QUARTER then "quarter" else "year") + " " + AsPrice(peak_04), globalColor("peak"));
def pbn_05 = if num_lines < 5 then nan else highestall(if bn == 1 then 0 else if p_x != p_x[1] && p_01 != p_x && p_02 != p_x && p_03 && p_04 != p_x then bn else nan);
def p_05 = if num_lines < 5 then nan else compoundvalue(1, if bn == pbn_05 then p_x else p_05[1], high);
plot peak_05 = if p_04 != p_05 && p_05 != 0 && bn > pbn_05 && num_lines >= 5 then p_05 else nan;
peak_05.setLineWeight(line_weight); peak_05.hideTitle(); peak_05.setStyle(line_style); peak_05.setPaintingStrategy(line_type); peak_05.setDefaultColor(globalColor("peak")); peak_05.assignValueColor(globalColor("peak"));
#addchartbubble(bn == pbn_05, p_x, "4: " + "; " + p_x, globalColor("peak"));
addchartbubble(show_labels && !isnan(peak_05), peak_05, (if aggregation_period <= AggregationPeriod.MIN then "1 min" else if aggregation_period <= AggregationPeriod.TWO_MIN then "2 min" else if aggregation_period <= AggregationPeriod.THREE_MIN then "3 min" else if aggregation_period <= AggregationPeriod.FOUR_MIN then "4 min" else if aggregation_period <= AggregationPeriod.FIVE_MIN then "5 min" else if aggregation_period <= AggregationPeriod.TEN_MIN then "10 min" else if aggregation_period <= AggregationPeriod.FIFTEEN_MIN then "15 min" else if aggregation_period <= AggregationPeriod.TWENTY_MIN then "20 min" else if aggregation_period <= AggregationPeriod.THIRTY_MIN then "30 min" else if aggregation_period <= AggregationPeriod.HOUR then "1 hour" else if aggregation_period <= AggregationPeriod.TWO_HOURS then "2 hours" else if aggregation_period <= AggregationPeriod.FOUR_HOURS then "4 hours" else if aggregation_period <= AggregationPeriod.DAY then "1 day" else if aggregation_period <= AggregationPeriod.TWO_DAYS then "2 days" else if aggregation_period <= AggregationPeriod.THREE_DAYS then "3 days" else if aggregation_period <= AggregationPeriod.FOUR_DAYS then "4 days" else if aggregation_period <= AggregationPeriod.WEEK then "week" else if aggregation_period <= AggregationPeriod.MONTH then "month" else if aggregation_period <= AggregationPeriod.OPT_EXP then "opt exp" else if aggregation_period <= AggregationPeriod.QUARTER then "quarter" else "year") + " " + AsPrice(peak_05), globalColor("peak"));
def pbn_06 = if num_lines < 6 then nan else highestall(if bn == 1 then 0 else if p_x != p_x[1] && p_01 != p_x && p_02 != p_x && p_03 != p_x && p_04 != p_x && p_05 != p_x then bn else nan);
def p_06 = if num_lines < 6 then nan else compoundvalue(1, if bn == pbn_06 then p_x else p_06[1], high);
plot peak_06 = if p_05 != p_06 && p_06 != 0 && bn > pbn_06 && num_lines >= 6 then p_06 else nan;
peak_06.setLineWeight(line_weight); peak_06.hideTitle(); peak_06.setStyle(line_style); peak_06.setPaintingStrategy(line_type); peak_06.setDefaultColor(globalColor("peak")); peak_06.assignValueColor(globalColor("peak"));
#addchartbubble(bn == pbn_06, p_x, "4: " + "; " + p_x, globalColor("peak"));
addchartbubble(show_labels && !isnan(peak_06), peak_06, (if aggregation_period <= AggregationPeriod.MIN then "1 min" else if aggregation_period <= AggregationPeriod.TWO_MIN then "2 min" else if aggregation_period <= AggregationPeriod.THREE_MIN then "3 min" else if aggregation_period <= AggregationPeriod.FOUR_MIN then "4 min" else if aggregation_period <= AggregationPeriod.FIVE_MIN then "5 min" else if aggregation_period <= AggregationPeriod.TEN_MIN then "10 min" else if aggregation_period <= AggregationPeriod.FIFTEEN_MIN then "15 min" else if aggregation_period <= AggregationPeriod.TWENTY_MIN then "20 min" else if aggregation_period <= AggregationPeriod.THIRTY_MIN then "30 min" else if aggregation_period <= AggregationPeriod.HOUR then "1 hour" else if aggregation_period <= AggregationPeriod.TWO_HOURS then "2 hours" else if aggregation_period <= AggregationPeriod.FOUR_HOURS then "4 hours" else if aggregation_period <= AggregationPeriod.DAY then "1 day" else if aggregation_period <= AggregationPeriod.TWO_DAYS then "2 days" else if aggregation_period <= AggregationPeriod.THREE_DAYS then "3 days" else if aggregation_period <= AggregationPeriod.FOUR_DAYS then "4 days" else if aggregation_period <= AggregationPeriod.WEEK then "week" else if aggregation_period <= AggregationPeriod.MONTH then "month" else if aggregation_period <= AggregationPeriod.OPT_EXP then "opt exp" else if aggregation_period <= AggregationPeriod.QUARTER then "quarter" else "year") + " " + AsPrice(peak_06), globalColor("peak"));
def pbn_07 = if num_lines < 7 then nan else highestall(if bn == 1 then 0 else if p_x != p_x[1] && p_01 != p_x && p_02 != p_x && p_03 != p_x && p_04 != p_x && p_05 != p_x && p_06 != p_x then bn else nan);
def p_07 = if num_lines < 7 then nan else compoundvalue(1, if bn == pbn_07 then p_x else p_07[1], high);
plot peak_07 = if p_06 != p_07 && p_07 != 0 && bn > pbn_07 && num_lines >= 7 then p_07 else nan;
peak_07.setLineWeight(line_weight); peak_07.hideTitle(); peak_07.setStyle(line_style); peak_07.setPaintingStrategy(line_type); peak_07.setDefaultColor(globalColor("peak")); peak_07.assignValueColor(globalColor("peak"));
#addchartbubble(bn == pbn_07, p_x, "4: " + "; " + p_x, globalColor("peak"));
addchartbubble(show_labels && !isnan(peak_07), peak_07, (if aggregation_period <= AggregationPeriod.MIN then "1 min" else if aggregation_period <= AggregationPeriod.TWO_MIN then "2 min" else if aggregation_period <= AggregationPeriod.THREE_MIN then "3 min" else if aggregation_period <= AggregationPeriod.FOUR_MIN then "4 min" else if aggregation_period <= AggregationPeriod.FIVE_MIN then "5 min" else if aggregation_period <= AggregationPeriod.TEN_MIN then "10 min" else if aggregation_period <= AggregationPeriod.FIFTEEN_MIN then "15 min" else if aggregation_period <= AggregationPeriod.TWENTY_MIN then "20 min" else if aggregation_period <= AggregationPeriod.THIRTY_MIN then "30 min" else if aggregation_period <= AggregationPeriod.HOUR then "1 hour" else if aggregation_period <= AggregationPeriod.TWO_HOURS then "2 hours" else if aggregation_period <= AggregationPeriod.FOUR_HOURS then "4 hours" else if aggregation_period <= AggregationPeriod.DAY then "1 day" else if aggregation_period <= AggregationPeriod.TWO_DAYS then "2 days" else if aggregation_period <= AggregationPeriod.THREE_DAYS then "3 days" else if aggregation_period <= AggregationPeriod.FOUR_DAYS then "4 days" else if aggregation_period <= AggregationPeriod.WEEK then "week" else if aggregation_period <= AggregationPeriod.MONTH then "month" else if aggregation_period <= AggregationPeriod.OPT_EXP then "opt exp" else if aggregation_period <= AggregationPeriod.QUARTER then "quarter" else "year") + " " + AsPrice(peak_07), globalColor("peak"));
def pbn_08 = if num_lines < 8 then nan else highestall(if bn == 1 then 0 else if p_x != p_x[1] && p_01 != p_x && p_02 != p_x && p_03 != p_x && p_04 != p_x && p_05 != p_x && p_06 != p_x && p_07 != p_x then bn else nan);
def p_08 = if num_lines < 8 then nan else compoundvalue(1, if bn == pbn_08 then p_x else p_08[1], high);
plot peak_08 = if p_07 != p_08 && p_08 != 0 && bn > pbn_08 && num_lines >= 8 then p_08 else nan;
peak_08.setLineWeight(line_weight); peak_08.hideTitle(); peak_08.setStyle(line_style); peak_08.setPaintingStrategy(line_type); peak_08.setDefaultColor(globalColor("peak")); peak_08.assignValueColor(globalColor("peak"));
#addchartbubble(bn == pbn_08, p_x, "4: " + "; " + p_x, globalColor("peak"));
addchartbubble(show_labels && !isnan(peak_08), peak_08, (if aggregation_period <= AggregationPeriod.MIN then "1 min" else if aggregation_period <= AggregationPeriod.TWO_MIN then "2 min" else if aggregation_period <= AggregationPeriod.THREE_MIN then "3 min" else if aggregation_period <= AggregationPeriod.FOUR_MIN then "4 min" else if aggregation_period <= AggregationPeriod.FIVE_MIN then "5 min" else if aggregation_period <= AggregationPeriod.TEN_MIN then "10 min" else if aggregation_period <= AggregationPeriod.FIFTEEN_MIN then "15 min" else if aggregation_period <= AggregationPeriod.TWENTY_MIN then "20 min" else if aggregation_period <= AggregationPeriod.THIRTY_MIN then "30 min" else if aggregation_period <= AggregationPeriod.HOUR then "1 hour" else if aggregation_period <= AggregationPeriod.TWO_HOURS then "2 hours" else if aggregation_period <= AggregationPeriod.FOUR_HOURS then "4 hours" else if aggregation_period <= AggregationPeriod.DAY then "1 day" else if aggregation_period <= AggregationPeriod.TWO_DAYS then "2 days" else if aggregation_period <= AggregationPeriod.THREE_DAYS then "3 days" else if aggregation_period <= AggregationPeriod.FOUR_DAYS then "4 days" else if aggregation_period <= AggregationPeriod.WEEK then "week" else if aggregation_period <= AggregationPeriod.MONTH then "month" else if aggregation_period <= AggregationPeriod.OPT_EXP then "opt exp" else if aggregation_period <= AggregationPeriod.QUARTER then "quarter" else "year") + " " + AsPrice(peak_08), globalColor("peak"));
def pbn_09 = if num_lines < 9 then nan else highestall(if bn == 1 then 0 else if p_x != p_x[1] && p_01 != p_x && p_02 != p_x && p_03 != p_x && p_04 != p_x && p_05 != p_x && p_06 != p_x && p_07 != p_x && p_08 != p_x then bn else nan);
def p_09 = if num_lines < 9 then nan else compoundvalue(1, if bn == pbn_09 then p_x else p_09[1], high);
plot peak_09 = if p_08 != p_09 && p_09 != 0 && bn > pbn_09 && num_lines >= 9 then p_09 else nan;
peak_09.setLineWeight(line_weight); peak_09.hideTitle(); peak_09.setStyle(line_style); peak_09.setPaintingStrategy(line_type); peak_09.setDefaultColor(globalColor("peak")); peak_09.assignValueColor(globalColor("peak"));
#addchartbubble(bn == pbn_09, p_x, "4: " + "; " + p_x, globalColor("peak"));
addchartbubble(show_labels && !isnan(peak_09), peak_09, (if aggregation_period <= AggregationPeriod.MIN then "1 min" else if aggregation_period <= AggregationPeriod.TWO_MIN then "2 min" else if aggregation_period <= AggregationPeriod.THREE_MIN then "3 min" else if aggregation_period <= AggregationPeriod.FOUR_MIN then "4 min" else if aggregation_period <= AggregationPeriod.FIVE_MIN then "5 min" else if aggregation_period <= AggregationPeriod.TEN_MIN then "10 min" else if aggregation_period <= AggregationPeriod.FIFTEEN_MIN then "15 min" else if aggregation_period <= AggregationPeriod.TWENTY_MIN then "20 min" else if aggregation_period <= AggregationPeriod.THIRTY_MIN then "30 min" else if aggregation_period <= AggregationPeriod.HOUR then "1 hour" else if aggregation_period <= AggregationPeriod.TWO_HOURS then "2 hours" else if aggregation_period <= AggregationPeriod.FOUR_HOURS then "4 hours" else if aggregation_period <= AggregationPeriod.DAY then "1 day" else if aggregation_period <= AggregationPeriod.TWO_DAYS then "2 days" else if aggregation_period <= AggregationPeriod.THREE_DAYS then "3 days" else if aggregation_period <= AggregationPeriod.FOUR_DAYS then "4 days" else if aggregation_period <= AggregationPeriod.WEEK then "week" else if aggregation_period <= AggregationPeriod.MONTH then "month" else if aggregation_period <= AggregationPeriod.OPT_EXP then "opt exp" else if aggregation_period <= AggregationPeriod.QUARTER then "quarter" else "year") + " " + AsPrice(peak_09), globalColor("peak"));
def tbn_ = if num_lines < 1 then nan else compoundvalue(1, if isvalley then bn else tbn_[1], low);
def t_ = if isnan(tbn_) then nan else compoundvalue(1, if bn == tbn_ then valley else t_[1], low);
def t_x = if isnan(tbn_) then nan else compoundvalue(1, if isnan(t_) then t_x[1] else t_, low); # this is because sometimes the higher level is not valid, like a 4h or a d aggregation period is nan over the weekend. assholes.
#plot t = if num_lines < 1 then nan else t_x; t.setLineWeight(line_weight); t.setDefaultColor(globalcolor("valley")); t.assignValueColor(globalcolor("valley")); t.hideTitle(); #t.setStyle(line_style); t.setPaintingStrategy(line_type);
#addchartbubble(bn == tbn_, t_x, ": " + tbn + "; " + t_x, globalColor("valley"));
def tbn_01 = if num_lines < 1 then nan else highestall(if bn == 1 then 0 else if t_x != t_x[1] then bn else nan);
def t_01 = if num_lines < 1 then nan else compoundvalue(1, if bn == tbn_01 then t_x else t_01[1], low);
plot valley_01 = if t_01 != 0 && bn > tbn_01 && num_lines >= 1 then t_01 else nan;
valley_01.setLineWeight(line_weight); valley_01.hideTitle(); valley_01.setStyle(line_style); valley_01.setPaintingStrategy(line_type); valley_01.setDefaultColor(globalColor("valley")); valley_01.assignValueColor(globalColor("valley"));
#addchartbubble(bn == tbn_01, t_x, "1: " + "; " + t_x, globalColor("valley"));
addchartbubble(show_labels && !isnan(valley_01), valley_01, (if aggregation_period <= AggregationPeriod.MIN then "1 min" else if aggregation_period <= AggregationPeriod.TWO_MIN then "2 min" else if aggregation_period <= AggregationPeriod.THREE_MIN then "3 min" else if aggregation_period <= AggregationPeriod.FOUR_MIN then "4 min" else if aggregation_period <= AggregationPeriod.FIVE_MIN then "5 min" else if aggregation_period <= AggregationPeriod.TEN_MIN then "10 min" else if aggregation_period <= AggregationPeriod.FIFTEEN_MIN then "15 min" else if aggregation_period <= AggregationPeriod.TWENTY_MIN then "20 min" else if aggregation_period <= AggregationPeriod.THIRTY_MIN then "30 min" else if aggregation_period <= AggregationPeriod.HOUR then "1 hour" else if aggregation_period <= AggregationPeriod.TWO_HOURS then "2 hours" else if aggregation_period <= AggregationPeriod.FOUR_HOURS then "4 hours" else if aggregation_period <= AggregationPeriod.DAY then "1 day" else if aggregation_period <= AggregationPeriod.TWO_DAYS then "2 days" else if aggregation_period <= AggregationPeriod.THREE_DAYS then "3 days" else if aggregation_period <= AggregationPeriod.FOUR_DAYS then "4 days" else if aggregation_period <= AggregationPeriod.WEEK then "week" else if aggregation_period <= AggregationPeriod.MONTH then "month" else if aggregation_period <= AggregationPeriod.OPT_EXP then "opt exp" else if aggregation_period <= AggregationPeriod.QUARTER then "quarter" else "year") + " " + AsPrice(valley_01), globalColor("valley"));
def tbn_02 = if num_lines < 2 then nan else highestall(if bn == 1 then 0 else if t_x != t_x[1] && t_01 != t_x then bn else nan);
def t_02 = if num_lines < 2 then nan else compoundvalue(1, if bn == tbn_02 then t_x else t_02[1], low);
plot valley_02 = if t_01 != t_02 && t_02 != 0 && bn > tbn_02 && num_lines >= 2 then t_02 else nan;
valley_02.setLineWeight(line_weight); valley_02.hideTitle(); valley_02.setStyle(line_style); valley_02.setPaintingStrategy(line_type); valley_02.setDefaultColor(globalColor("valley")); valley_02.assignValueColor(globalColor("valley"));
#addchartbubble(bn == tbn_02, t_x, "2: " + "; " + t_x, globalColor("valley"));
addchartbubble(show_labels && !isnan(valley_02), valley_02, (if aggregation_period <= AggregationPeriod.MIN then "1 min" else if aggregation_period <= AggregationPeriod.TWO_MIN then "2 min" else if aggregation_period <= AggregationPeriod.THREE_MIN then "3 min" else if aggregation_period <= AggregationPeriod.FOUR_MIN then "4 min" else if aggregation_period <= AggregationPeriod.FIVE_MIN then "5 min" else if aggregation_period <= AggregationPeriod.TEN_MIN then "10 min" else if aggregation_period <= AggregationPeriod.FIFTEEN_MIN then "15 min" else if aggregation_period <= AggregationPeriod.TWENTY_MIN then "20 min" else if aggregation_period <= AggregationPeriod.THIRTY_MIN then "30 min" else if aggregation_period <= AggregationPeriod.HOUR then "1 hour" else if aggregation_period <= AggregationPeriod.TWO_HOURS then "2 hours" else if aggregation_period <= AggregationPeriod.FOUR_HOURS then "4 hours" else if aggregation_period <= AggregationPeriod.DAY then "1 day" else if aggregation_period <= AggregationPeriod.TWO_DAYS then "2 days" else if aggregation_period <= AggregationPeriod.THREE_DAYS then "3 days" else if aggregation_period <= AggregationPeriod.FOUR_DAYS then "4 days" else if aggregation_period <= AggregationPeriod.WEEK then "week" else if aggregation_period <= AggregationPeriod.MONTH then "month" else if aggregation_period <= AggregationPeriod.OPT_EXP then "opt exp" else if aggregation_period <= AggregationPeriod.QUARTER then "quarter" else "year") + " " + AsPrice(valley_02), globalColor("valley"));
def tbn_03 = if num_lines < 3 then nan else highestall(if bn == 1 then 0 else if t_x != t_x[1] && t_01 != t_x && t_02 != t_x then bn else nan);
def t_03 = if num_lines < 3 then nan else compoundvalue(1, if bn == tbn_03 then t_x else t_03[1], low);
plot valley_03 = if t_02 != t_03 && t_03 != 0 && bn > tbn_03 && num_lines >= 3 then t_03 else nan;
valley_03.setLineWeight(line_weight); valley_03.hideTitle(); valley_03.setStyle(line_style); valley_03.setPaintingStrategy(line_type); valley_03.setDefaultColor(globalColor("valley")); valley_03.assignValueColor(globalColor("valley"));
#addchartbubble(bn == tbn_03, t_x, "3: " + "; " + t_x, globalColor("valley"));
addchartbubble(show_labels && !isnan(valley_03), valley_03, (if aggregation_period <= AggregationPeriod.MIN then "1 min" else if aggregation_period <= AggregationPeriod.TWO_MIN then "2 min" else if aggregation_period <= AggregationPeriod.THREE_MIN then "3 min" else if aggregation_period <= AggregationPeriod.FOUR_MIN then "4 min" else if aggregation_period <= AggregationPeriod.FIVE_MIN then "5 min" else if aggregation_period <= AggregationPeriod.TEN_MIN then "10 min" else if aggregation_period <= AggregationPeriod.FIFTEEN_MIN then "15 min" else if aggregation_period <= AggregationPeriod.TWENTY_MIN then "20 min" else if aggregation_period <= AggregationPeriod.THIRTY_MIN then "30 min" else if aggregation_period <= AggregationPeriod.HOUR then "1 hour" else if aggregation_period <= AggregationPeriod.TWO_HOURS then "2 hours" else if aggregation_period <= AggregationPeriod.FOUR_HOURS then "4 hours" else if aggregation_period <= AggregationPeriod.DAY then "1 day" else if aggregation_period <= AggregationPeriod.TWO_DAYS then "2 days" else if aggregation_period <= AggregationPeriod.THREE_DAYS then "3 days" else if aggregation_period <= AggregationPeriod.FOUR_DAYS then "4 days" else if aggregation_period <= AggregationPeriod.WEEK then "week" else if aggregation_period <= AggregationPeriod.MONTH then "month" else if aggregation_period <= AggregationPeriod.OPT_EXP then "opt exp" else if aggregation_period <= AggregationPeriod.QUARTER then "quarter" else "year") + " " + AsPrice(valley_03), globalColor("valley"));
def tbn_04 = if num_lines < 4 then nan else highestall(if bn == 1 then 0 else if t_x != t_x[1] && t_01 != t_x && t_02 != t_x && t_03 != t_x then bn else nan);
def t_04 = if num_lines < 4 then nan else compoundvalue(1, if bn == tbn_04 then t_x else t_04[1], low);
plot valley_04 = if t_03 != t_04 && t_04 != 0 && bn > tbn_04 && num_lines >=4 then t_04 else nan;
valley_04.setLineWeight(line_weight); valley_04.hideTitle(); valley_04.setStyle(line_style); valley_04.setPaintingStrategy(line_type); valley_04.setDefaultColor(globalColor("valley")); valley_04.assignValueColor(globalColor("valley"));
#addchartbubble(bn == tbn_04, t_x, "4: " + "; " + t_x, globalColor("valley"));
addchartbubble(show_labels && !isnan(valley_04), valley_04, (if aggregation_period <= AggregationPeriod.MIN then "1 min" else if aggregation_period <= AggregationPeriod.TWO_MIN then "2 min" else if aggregation_period <= AggregationPeriod.THREE_MIN then "3 min" else if aggregation_period <= AggregationPeriod.FOUR_MIN then "4 min" else if aggregation_period <= AggregationPeriod.FIVE_MIN then "5 min" else if aggregation_period <= AggregationPeriod.TEN_MIN then "10 min" else if aggregation_period <= AggregationPeriod.FIFTEEN_MIN then "15 min" else if aggregation_period <= AggregationPeriod.TWENTY_MIN then "20 min" else if aggregation_period <= AggregationPeriod.THIRTY_MIN then "30 min" else if aggregation_period <= AggregationPeriod.HOUR then "1 hour" else if aggregation_period <= AggregationPeriod.TWO_HOURS then "2 hours" else if aggregation_period <= AggregationPeriod.FOUR_HOURS then "4 hours" else if aggregation_period <= AggregationPeriod.DAY then "1 day" else if aggregation_period <= AggregationPeriod.TWO_DAYS then "2 days" else if aggregation_period <= AggregationPeriod.THREE_DAYS then "3 days" else if aggregation_period <= AggregationPeriod.FOUR_DAYS then "4 days" else if aggregation_period <= AggregationPeriod.WEEK then "week" else if aggregation_period <= AggregationPeriod.MONTH then "month" else if aggregation_period <= AggregationPeriod.OPT_EXP then "opt exp" else if aggregation_period <= AggregationPeriod.QUARTER then "quarter" else "year") + " " + AsPrice(valley_04), globalColor("valley"));
def tbn_05 = if num_lines < 5 then nan else highestall(if bn == 1 then 0 else if t_x != t_x[1] && t_01 != t_x && t_02 != t_x && t_03 != t_x && t_04 != t_x then bn else nan);
def t_05 = if num_lines < 5 then nan else compoundvalue(1, if bn == tbn_05 then t_x else t_05[1], low);
plot valley_05 = if t_04 != t_05 && t_05 != 0 && bn > tbn_05 && num_lines >= 5 then t_05 else nan;
valley_05.setLineWeight(line_weight); valley_05.hideTitle(); valley_05.setStyle(line_style); valley_05.setPaintingStrategy(line_type); valley_05.setDefaultColor(globalColor("valley")); valley_05.assignValueColor(globalColor("valley"));
#addchartbubble(bn == tbn_05, t_x, "4: " + "; " + t_x, globalColor("valley"));
addchartbubble(show_labels && !isnan(valley_05), valley_05, (if aggregation_period <= AggregationPeriod.MIN then "1 min" else if aggregation_period <= AggregationPeriod.TWO_MIN then "2 min" else if aggregation_period <= AggregationPeriod.THREE_MIN then "3 min" else if aggregation_period <= AggregationPeriod.FOUR_MIN then "4 min" else if aggregation_period <= AggregationPeriod.FIVE_MIN then "5 min" else if aggregation_period <= AggregationPeriod.TEN_MIN then "10 min" else if aggregation_period <= AggregationPeriod.FIFTEEN_MIN then "15 min" else if aggregation_period <= AggregationPeriod.TWENTY_MIN then "20 min" else if aggregation_period <= AggregationPeriod.THIRTY_MIN then "30 min" else if aggregation_period <= AggregationPeriod.HOUR then "1 hour" else if aggregation_period <= AggregationPeriod.TWO_HOURS then "2 hours" else if aggregation_period <= AggregationPeriod.FOUR_HOURS then "4 hours" else if aggregation_period <= AggregationPeriod.DAY then "1 day" else if aggregation_period <= AggregationPeriod.TWO_DAYS then "2 days" else if aggregation_period <= AggregationPeriod.THREE_DAYS then "3 days" else if aggregation_period <= AggregationPeriod.FOUR_DAYS then "4 days" else if aggregation_period <= AggregationPeriod.WEEK then "week" else if aggregation_period <= AggregationPeriod.MONTH then "month" else if aggregation_period <= AggregationPeriod.OPT_EXP then "opt exp" else if aggregation_period <= AggregationPeriod.QUARTER then "quarter" else "year") + " " + AsPrice(valley_05), globalColor("valley"));
def tbn_06 = if num_lines < 6 then nan else highestall(if bn == 1 then 0 else if t_x != t_x[1] && t_01 != t_x && t_02 != t_x && t_03 != t_x && t_04 != t_x && t_05 != t_x then bn else nan);
def t_06 = if num_lines < 6 then nan else compoundvalue(1, if bn == tbn_06 then t_x else t_06[1], low);
plot valley_06 = if t_05 != t_06 && t_06 != 0 && bn > tbn_06 && num_lines >= 6 then t_06 else nan;
valley_06.setLineWeight(line_weight); valley_06.hideTitle(); valley_06.setStyle(line_style); valley_06.setPaintingStrategy(line_type); valley_06.setDefaultColor(globalColor("valley")); valley_06.assignValueColor(globalColor("valley"));
#addchartbubble(bn == tbn_06, t_x, "4: " + "; " + t_x, globalColor("valley"));
addchartbubble(show_labels && !isnan(valley_06), valley_06, (if aggregation_period <= AggregationPeriod.MIN then "1 min" else if aggregation_period <= AggregationPeriod.TWO_MIN then "2 min" else if aggregation_period <= AggregationPeriod.THREE_MIN then "3 min" else if aggregation_period <= AggregationPeriod.FOUR_MIN then "4 min" else if aggregation_period <= AggregationPeriod.FIVE_MIN then "5 min" else if aggregation_period <= AggregationPeriod.TEN_MIN then "10 min" else if aggregation_period <= AggregationPeriod.FIFTEEN_MIN then "15 min" else if aggregation_period <= AggregationPeriod.TWENTY_MIN then "20 min" else if aggregation_period <= AggregationPeriod.THIRTY_MIN then "30 min" else if aggregation_period <= AggregationPeriod.HOUR then "1 hour" else if aggregation_period <= AggregationPeriod.TWO_HOURS then "2 hours" else if aggregation_period <= AggregationPeriod.FOUR_HOURS then "4 hours" else if aggregation_period <= AggregationPeriod.DAY then "1 day" else if aggregation_period <= AggregationPeriod.TWO_DAYS then "2 days" else if aggregation_period <= AggregationPeriod.THREE_DAYS then "3 days" else if aggregation_period <= AggregationPeriod.FOUR_DAYS then "4 days" else if aggregation_period <= AggregationPeriod.WEEK then "week" else if aggregation_period <= AggregationPeriod.MONTH then "month" else if aggregation_period <= AggregationPeriod.OPT_EXP then "opt exp" else if aggregation_period <= AggregationPeriod.QUARTER then "quarter" else "year") + " " + AsPrice(valley_06), globalColor("valley"));
def tbn_07 = if num_lines < 7 then nan else highestall(if bn == 1 then 0 else if t_x != t_x[1] && t_01 != t_x && t_02 != t_x && t_03 != t_x && t_04 != t_x && t_05 != t_x && t_06 != t_x then bn else nan);
def t_07 = if num_lines < 7 then nan else compoundvalue(1, if bn == tbn_07 then t_x else t_07[1], low);
plot valley_07 = if t_06 != t_07 && t_07 != 0 && bn > tbn_07 && num_lines >= 7 then t_07 else nan;
valley_07.setLineWeight(line_weight); valley_07.hideTitle(); valley_07.setStyle(line_style); valley_07.setPaintingStrategy(line_type); valley_07.setDefaultColor(globalColor("valley")); valley_07.assignValueColor(globalColor("valley"));
#addchartbubble(bn == tbn_07, t_x, "4: " + "; " + t_x, globalColor("valley"));
addchartbubble(show_labels && !isnan(valley_07), valley_07, (if aggregation_period <= AggregationPeriod.MIN then "1 min" else if aggregation_period <= AggregationPeriod.TWO_MIN then "2 min" else if aggregation_period <= AggregationPeriod.THREE_MIN then "3 min" else if aggregation_period <= AggregationPeriod.FOUR_MIN then "4 min" else if aggregation_period <= AggregationPeriod.FIVE_MIN then "5 min" else if aggregation_period <= AggregationPeriod.TEN_MIN then "10 min" else if aggregation_period <= AggregationPeriod.FIFTEEN_MIN then "15 min" else if aggregation_period <= AggregationPeriod.TWENTY_MIN then "20 min" else if aggregation_period <= AggregationPeriod.THIRTY_MIN then "30 min" else if aggregation_period <= AggregationPeriod.HOUR then "1 hour" else if aggregation_period <= AggregationPeriod.TWO_HOURS then "2 hours" else if aggregation_period <= AggregationPeriod.FOUR_HOURS then "4 hours" else if aggregation_period <= AggregationPeriod.DAY then "1 day" else if aggregation_period <= AggregationPeriod.TWO_DAYS then "2 days" else if aggregation_period <= AggregationPeriod.THREE_DAYS then "3 days" else if aggregation_period <= AggregationPeriod.FOUR_DAYS then "4 days" else if aggregation_period <= AggregationPeriod.WEEK then "week" else if aggregation_period <= AggregationPeriod.MONTH then "month" else if aggregation_period <= AggregationPeriod.OPT_EXP then "opt exp" else if aggregation_period <= AggregationPeriod.QUARTER then "quarter" else "year") + " " + AsPrice(valley_07), globalColor("valley"));
def tbn_08 = if num_lines < 8 then nan else highestall(if bn == 1 then 0 else if t_x != t_x[1] && t_01 != t_x && t_02 != t_x && t_03 != t_x && t_04 != t_x && t_05 != t_x && t_06 != t_x && t_07 != t_x then bn else nan);
def t_08 = if num_lines < 8 then nan else compoundvalue(1, if bn == tbn_08 then t_x else t_08[1], low);
plot valley_08 = if t_07 != t_08 && t_08 != 0 && bn > tbn_08 && num_lines >= 8 then t_08 else nan;
valley_08.setLineWeight(line_weight); valley_08.hideTitle(); valley_08.setStyle(line_style); valley_08.setPaintingStrategy(line_type); valley_08.setDefaultColor(globalColor("valley")); valley_08.assignValueColor(globalColor("valley"));
#addchartbubble(bn == tbn_08, t_x, "4: " + "; " + t_x, globalColor("valley"));
addchartbubble(show_labels && !isnan(valley_08), valley_08, (if aggregation_period <= AggregationPeriod.MIN then "1 min" else if aggregation_period <= AggregationPeriod.TWO_MIN then "2 min" else if aggregation_period <= AggregationPeriod.THREE_MIN then "3 min" else if aggregation_period <= AggregationPeriod.FOUR_MIN then "4 min" else if aggregation_period <= AggregationPeriod.FIVE_MIN then "5 min" else if aggregation_period <= AggregationPeriod.TEN_MIN then "10 min" else if aggregation_period <= AggregationPeriod.FIFTEEN_MIN then "15 min" else if aggregation_period <= AggregationPeriod.TWENTY_MIN then "20 min" else if aggregation_period <= AggregationPeriod.THIRTY_MIN then "30 min" else if aggregation_period <= AggregationPeriod.HOUR then "1 hour" else if aggregation_period <= AggregationPeriod.TWO_HOURS then "2 hours" else if aggregation_period <= AggregationPeriod.FOUR_HOURS then "4 hours" else if aggregation_period <= AggregationPeriod.DAY then "1 day" else if aggregation_period <= AggregationPeriod.TWO_DAYS then "2 days" else if aggregation_period <= AggregationPeriod.THREE_DAYS then "3 days" else if aggregation_period <= AggregationPeriod.FOUR_DAYS then "4 days" else if aggregation_period <= AggregationPeriod.WEEK then "week" else if aggregation_period <= AggregationPeriod.MONTH then "month" else if aggregation_period <= AggregationPeriod.OPT_EXP then "opt exp" else if aggregation_period <= AggregationPeriod.QUARTER then "quarter" else "year") + " " + AsPrice(valley_08), globalColor("valley"));
def tbn_09 = if num_lines < 9 then nan else highestall(if bn == 1 then 0 else if t_x != t_x[1] && t_01 != t_x && t_02 != t_x && t_03 != t_x && t_04 != t_x && t_05 != t_x && t_06 != t_x && t_07 != t_x && t_08 != t_x then bn else nan);
def t_09 = if num_lines < 9 then nan else compoundvalue(1, if bn == tbn_09 then t_x else t_09[1], low);
plot valley_09 = if t_08 != t_09 && t_09 != 0 && bn > tbn_09 && num_lines >= 9 then t_09 else nan;
valley_09.setLineWeight(line_weight); valley_09.hideTitle(); valley_09.setStyle(line_style); valley_09.setPaintingStrategy(line_type); valley_09.setDefaultColor(globalColor("valley")); valley_09.assignValueColor(globalColor("valley"));
#addchartbubble(bn == tbn_09, t_x, "4: " + "; " + t_x, globalColor("valley"));
addchartbubble(show_labels && !isnan(valley_09), valley_09, (if aggregation_period <= AggregationPeriod.MIN then "1 min" else if aggregation_period <= AggregationPeriod.TWO_MIN then "2 min" else if aggregation_period <= AggregationPeriod.THREE_MIN then "3 min" else if aggregation_period <= AggregationPeriod.FOUR_MIN then "4 min" else if aggregation_period <= AggregationPeriod.FIVE_MIN then "5 min" else if aggregation_period <= AggregationPeriod.TEN_MIN then "10 min" else if aggregation_period <= AggregationPeriod.FIFTEEN_MIN then "15 min" else if aggregation_period <= AggregationPeriod.TWENTY_MIN then "20 min" else if aggregation_period <= AggregationPeriod.THIRTY_MIN then "30 min" else if aggregation_period <= AggregationPeriod.HOUR then "1 hour" else if aggregation_period <= AggregationPeriod.TWO_HOURS then "2 hours" else if aggregation_period <= AggregationPeriod.FOUR_HOURS then "4 hours" else if aggregation_period <= AggregationPeriod.DAY then "1 day" else if aggregation_period <= AggregationPeriod.TWO_DAYS then "2 days" else if aggregation_period <= AggregationPeriod.THREE_DAYS then "3 days" else if aggregation_period <= AggregationPeriod.FOUR_DAYS then "4 days" else if aggregation_period <= AggregationPeriod.WEEK then "week" else if aggregation_period <= AggregationPeriod.MONTH then "month" else if aggregation_period <= AggregationPeriod.OPT_EXP then "opt exp" else if aggregation_period <= AggregationPeriod.QUARTER then "quarter" else "year") + " " + AsPrice(valley_09), globalColor("valley"));
# def mc_ = if num_lines < 1 then nan else t_x + ((p_x-t_x)/2);
# def mcbn_ = if num_lines < 1 then nan else if mc_ != mc_[1] then bn else mcbn_[1];
# def mc_x = if num_lines < 1 then nan else if isnan(mc_) then mc_x[1] else mc_;
# plot midcandle_x = if num_lines < 1 then nan else if show_midcandles then mc_x else nan;
# midcandle_x.setLineWeight(line_weight); midcandle_x.hideTitle(); midcandle_x.setStyle(line_style); midcandle_x.setPaintingStrategy(line_type); midcandle_x.setDefaultColor(globalColor("midcandle")); midcandle_x.assignValueColor(globalColor("midcandle"));
# #addchartbubble(bn == mcbn_, mc_x, "mc_x: " + "; " + mc_x, globalColor("midcandle"));
# def mcbn_01 = if num_lines < 1 then nan else highestall(if bn == 1 then 0 else if mc_x != mc_x[-1] then bn else nan);
# def mc_01 = if num_lines < 1 then nan else if bn == mcbn_01 then mc_x else mc_01[1];
# plot midcandle_01 = if show_midcandles && show_midcandles && bn > mcbn_01 && num_lines >= 1 then mc_01 else nan;
# midcandle_01.setLineWeight(line_weight); midcandle_01.hideTitle(); midcandle_01.setStyle(line_style); midcandle_01.setPaintingStrategy(line_type); midcandle_01.setDefaultColor(globalColor("midcandle")); midcandle_01.assignValueColor(globalColor("midcandle"));
# #addchartbubble(bn == mcbn_01, mc_01, "mc_01: " + "; " + mc_01, globalColor("midcandle"));
# def mcbn_02 = if num_lines < 2 then nan else highestall(if bn == 1 then 0 else if mc_x != mc_x[-1] && mc_01 != mc_x then bn else nan);
# def mc_02 = if num_lines < 2 then nan else if bn == mcbn_02 then mc_x else mc_02[1];
# plot midcandle_02 = if show_midcandles && show_midcandles && bn > mcbn_02 && num_lines >= 2 then mc_02 else nan;
# midcandle_02.setLineWeight(line_weight); midcandle_02.hideTitle(); midcandle_02.setStyle(line_style); midcandle_02.setPaintingStrategy(line_type); midcandle_02.setDefaultColor(globalColor("midcandle")); midcandle_02.assignValueColor(globalColor("midcandle"));
# #addchartbubble(bn == mcbn_02, mc_02, "mc_02: " + "; " + mc_02, globalColor("midcandle"));
# def mcbn_03 = if num_lines < 3 then nan else highestall(if bn == 1 then 0 else if mc_x != mc_x[-1] && mc_01 != mc_x && mc_02 != mc_x then bn else nan);
# def mc_03 = if num_lines < 3 then nan else if bn == mcbn_03 then mc_x else mc_03[1];
# plot midcandle_03 = if show_midcandles && show_midcandles && bn > mcbn_03 && num_lines >= 3 then mc_03 else nan;
# midcandle_03.setLineWeight(line_weight); midcandle_03.hideTitle(); midcandle_03.setStyle(line_style); midcandle_03.setPaintingStrategy(line_type); midcandle_03.setDefaultColor(globalColor("midcandle")); midcandle_03.assignValueColor(globalColor("midcandle"));
# #addchartbubble(bn == mcbn_03, mc_03, "mc_03: " + "; " + mc_03, globalColor("midcandle"));
# def mcbn_04 = if num_lines < 4 then nan else highestall(if bn == 1 then 0 else if mc_x != mc_x[-1] && mc_01 != mc_x && mc_02 != mc_x && mc_03 != mc_x then bn else nan);
# def mc_04 = if num_lines < 4 then nan else if bn == mcbn_04 then mc_x else mc_04[1];
# plot midcandle_04 = if show_midcandles && show_midcandles && bn > mcbn_04 && num_lines >= 4 then mc_04 else nan;
# midcandle_04.setLineWeight(line_weight); midcandle_04.hideTitle(); midcandle_04.setStyle(line_style); midcandle_04.setPaintingStrategy(line_type); midcandle_04.setDefaultColor(globalColor("midcandle")); midcandle_04.assignValueColor(globalColor("midcandle"));
# #addchartbubble(bn == mcbn_04, mc_04, "mc_04: " + "; " + mc_04, globalColor("midcandle"));
# def mcbn_05 = if num_lines < 5 then nan else highestall(if bn == 1 then 0 else if mc_x != mc_x[-1] && mc_01 != mc_x && mc_02 != mc_x && mc_03 != mc_x && mc_04 != mc_x then bn else nan);
# def mc_05 = if num_lines < 5 then nan else if bn == mcbn_05 then mc_x else mc_05[1];
# plot midcandle_05 = if show_midcandles && show_midcandles && bn > mcbn_05 && num_lines >= 5 then mc_05 else nan;
# midcandle_05.setLineWeight(line_weight); midcandle_05.hideTitle(); midcandle_05.setStyle(line_style); midcandle_05.setPaintingStrategy(line_type); midcandle_05.setDefaultColor(globalColor("midcandle")); midcandle_05.assignValueColor(globalColor("midcandle"));
# #addchartbubble(bn == mcbn_05, mc_05, "mc_05: " + "; " + mc_05, globalColor("midcandle"));
# def mcbn_06 = if num_lines < 6 then nan else highestall(if bn == 1 then 0 else if mc_x != mc_x[-1] && mc_01 != mc_x && mc_02 != mc_x && mc_03 != mc_x && mc_04 != mc_x && mc_05 != mc_x then bn else nan);
# def mc_06 = if num_lines < 6 then nan else if bn == mcbn_06 then mc_x else mc_06[1];
# plot midcandle_06 = if show_midcandles && show_midcandles && bn > mcbn_06 && num_lines >= 6 then mc_06 else nan;
# midcandle_06.setLineWeight(line_weight); midcandle_06.hideTitle(); midcandle_06.setStyle(line_style); midcandle_06.setPaintingStrategy(line_type); midcandle_06.setDefaultColor(globalColor("midcandle")); midcandle_06.assignValueColor(globalColor("midcandle"));
# #addchartbubble(bn == mcbn_06, mc_06, "mc_06: " + "; " + mc_06, globalColor("midcandle"));
# def mcbn_07 = if num_lines < 7 then nan else highestall(if bn == 1 then 0 else if mc_x != mc_x[-1] && mc_01 != mc_x && mc_02 != mc_x && mc_03 != mc_x && mc_04 != mc_x && mc_05 != mc_x && mc_06 != mc_x then bn else nan);
# def mc_07 = if num_lines < 7 then nan else if bn == mcbn_07 then mc_x else mc_07[1];
# plot midcandle_07 = if show_midcandles && show_midcandles && bn > mcbn_07 && num_lines >= 7 then mc_07 else nan;
# midcandle_07.setLineWeight(line_weight); midcandle_07.hideTitle(); midcandle_07.setStyle(line_style); midcandle_07.setPaintingStrategy(line_type); midcandle_07.setDefaultColor(globalColor("midcandle")); midcandle_07.assignValueColor(globalColor("midcandle"));
# #addchartbubble(bn == mcbn_07, mc_07, "mc_07: " + "; " + mc_07, globalColor("midcandle"));
# def mcbn_08 = if num_lines < 8 then nan else highestall(if bn == 1 then 0 else if mc_x != mc_x[-1] && mc_01 != mc_x && mc_02 != mc_x && mc_03 != mc_x && mc_04 != mc_x && mc_05 != mc_x && mc_06 != mc_x && mc_07 != mc_x then bn else nan);
# def mc_08 = if num_lines < 8 then nan else if bn == mcbn_08 then mc_x else mc_08[1];
# plot midcandle_08 = if show_midcandles && show_midcandles && bn > mcbn_08 && num_lines >= 8 then mc_08 else nan;
# midcandle_08.setLineWeight(line_weight); midcandle_08.hideTitle(); midcandle_08.setStyle(line_style); midcandle_08.setPaintingStrategy(line_type); midcandle_08.setDefaultColor(globalColor("midcandle")); midcandle_08.assignValueColor(globalColor("midcandle"));
# #addchartbubble(bn == mcbn_08, mc_08, "mc_08: " + "; " + mc_08, globalColor("midcandle"));
# def mcbn_09 = if num_lines < 9 then nan else highestall(if bn == 1 then 0 else if mc_x != mc_x[-1] && mc_01 != mc_x && mc_02 != mc_x && mc_03 != mc_x && mc_04 != mc_x && mc_05 != mc_x && mc_06 != mc_x && mc_07 != mc_x && mc_08 != mc_x then bn else nan);
# def mc_09 = if num_lines < 9 then nan else if bn == mcbn_09 then mc_x else mc_09[1];
# plot midcandle_09 = if show_midcandles && show_midcandles && bn > mcbn_09 && num_lines >= 9 then mc_09 else nan;
# midcandle_09.setLineWeight(line_weight); midcandle_09.hideTitle(); midcandle_09.setStyle(line_style); midcandle_09.setPaintingStrategy(line_type); midcandle_09.setDefaultColor(globalColor("midcandle")); midcandle_09.assignValueColor(globalColor("midcandle"));
# #addchartbubble(bn == mcbn_09, mc_09, "mc_09: " + "; " + mc_09, globalColor("midcandle"));
#
switch(credits){default:}#bagginses