// This source code is subject to the terms of the Mozilla Public License 2.0 at https://mozilla.org/MPL/2.0/
// © btc_charlie / @TheParagonGrp
//@version=5
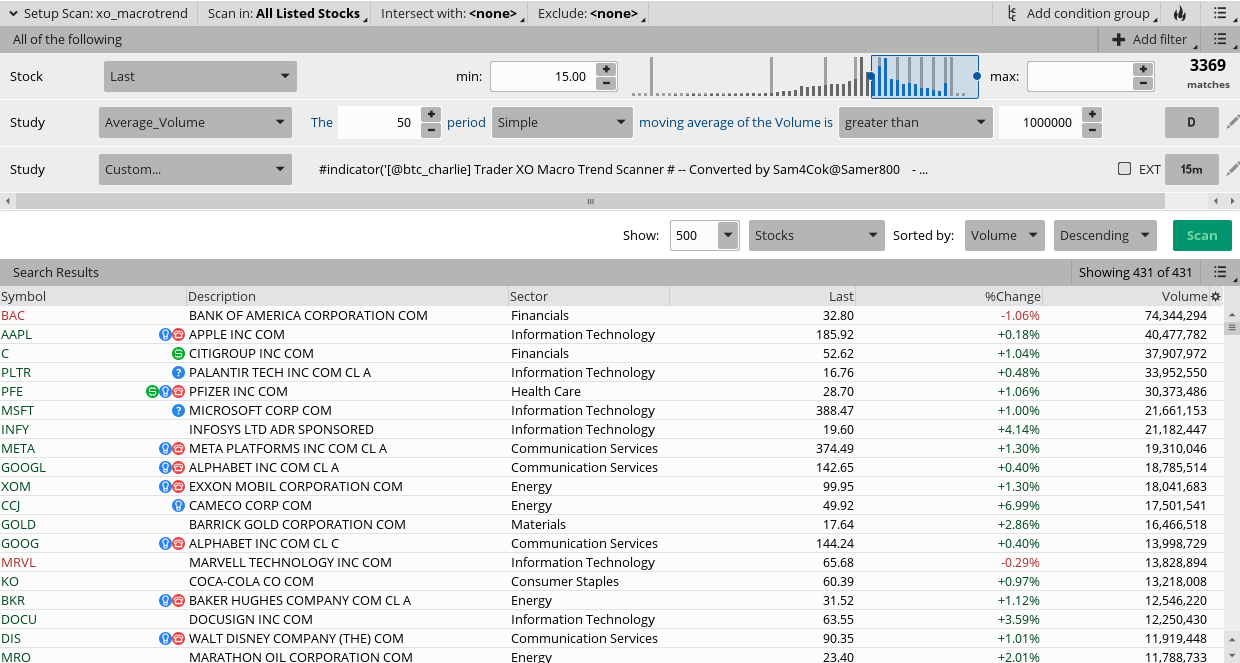
indicator('[@btc_charlie] Trader XO Macro Trend Scanner', overlay=true)
// Variables
var ok = 0
var countBuy = 0
var countSell = 0
src = input(close, title='OHLC Type')
i_fastEMA = input(12, title='Fast EMA')
i_slowEMA = input(25, title='Slow EMA')
i_defEMA = input(25, title='Consolidated EMA')
// Allow the option to show single or double EMA
i_bothEMAs = input(title='Show Both EMAs', defval=true)
// Define EMAs
v_fastEMA = ta.ema(src, i_fastEMA)
v_slowEMA = ta.ema(src, i_slowEMA)
v_biasEMA = ta.ema(src, i_defEMA)
// Color the EMAs
emaColor = v_fastEMA > v_slowEMA ? color.green : v_fastEMA < v_slowEMA ? color.red : #FF530D
// Plot EMAs
plot(i_bothEMAs ? na : v_biasEMA, color=emaColor, linewidth=3, title='Consolidated EMA')
plot(i_bothEMAs ? v_fastEMA : na, title='Fast EMA', color=emaColor)
plot(i_bothEMAs ? v_slowEMA : na, title='Slow EMA', color=emaColor)
// Colour the bars
buy = v_fastEMA > v_slowEMA
sell = v_fastEMA < v_slowEMA
if buy
countBuy += 1
countBuy
if buy
countSell := 0
countSell
if sell
countSell += 1
countSell
if sell
countBuy := 0
countBuy
buysignal = countBuy < 2 and countBuy > 0 and countSell < 1 and buy and not buy[1]
sellsignal = countSell > 0 and countSell < 2 and countBuy < 1 and sell and not sell[1]
barcolor(buysignal ? color.green : na)
barcolor(sellsignal ? color.red : na)
// Plot Bull/Bear
plotshape(buysignal, title='Bull', text='Bull', style=shape.triangleup, location=location.belowbar, color=color.new(color.green, 0), textcolor=color.new(color.black, 0), size=size.tiny)
plotshape(sellsignal, title='Bear', text='Bear', style=shape.triangledown, location=location.abovebar, color=color.new(color.red, 0), textcolor=color.new(color.black, 0), size=size.tiny)
bull = countBuy > 1
bear = countSell > 1
barcolor(bull ? color.green : na)
barcolor(bear ? color.red : na)
// Set Alerts
alertcondition(ta.crossover(v_fastEMA, v_slowEMA), title='Bullish EMA Cross', message='Bullish EMA crossover')
alertcondition(ta.crossunder(v_fastEMA, v_slowEMA), title='Bearish EMA Cross', message='Bearish EMA Crossover')
// Stoch RSI code
smoothK = input.int(3, 'K', minval=1)
smoothD = input.int(3, 'D', minval=1)
lengthRSI = input.int(14, 'RSI Length', minval=1)
lengthStoch = input.int(14, 'Stochastic Length', minval=1)
rsi1 = ta.rsi(src, lengthRSI)
k = ta.sma(ta.stoch(rsi1, rsi1, rsi1, lengthStoch), smoothK)
d = ta.sma(k, smoothD)
bandno0 = input.int(80, minval=1, title='Upper Band', group='Bands (change this instead of length in Style for Stoch RSI colour to work properly)')
bandno2 = input.int(50, minval=1, title='Middle Band', group='Bands (change this instead of length in Style for Stoch RSI colour to work properly)')
bandno1 = input.int(20, minval=1, title='Lower Band', group='Bands (change this instead of length in Style for Stoch RSI colour to work properly)')
// Alerts
crossoverAlertBgColourMidOnOff = input.bool(title='Crossover Alert Background Colour (Middle Level) [ON/OFF]', group='Crossover Alerts', defval=false)
crossoverAlertBgColourOBOSOnOff = input.bool(title='Crossover Alert Background Colour (OB/OS Level) [ON/OFF]', group='Crossover Alerts', defval=false)
crossoverAlertBgColourGreaterThanOnOff = input.bool(title='Crossover Alert >input [ON/OFF]', group='Crossover Alerts', defval=false)
crossoverAlertBgColourLessThanOnOff = input.bool(title='Crossover Alert <input [ON/OFF]', group='Crossover Alerts', defval=false)
maTypeChoice = input.string('EMA', title='MA Type', group='Moving Average', options=['EMA', 'WMA', 'SMA', 'None'])
maSrc = input.source(close, title='MA Source', group='Moving Average')
maLen = input.int(200, minval=1, title='MA Length', group='Moving Average')
maValue = if maTypeChoice == 'EMA'
ta.ema(maSrc, maLen)
else if maTypeChoice == 'WMA'
ta.wma(maSrc, maLen)
else if maTypeChoice == 'SMA'
ta.sma(maSrc, maLen)
else
0
crossupCHECK = maTypeChoice == 'None' or open > maValue and maTypeChoice != 'None'
crossdownCHECK = maTypeChoice == 'None' or open < maValue and maTypeChoice != 'None'
crossupalert = crossupCHECK and ta.crossover(k, d) and (k < bandno2 or d < bandno2)
crossdownalert = crossdownCHECK and ta.crossunder(k, d) and (k > bandno2 or d > bandno2)
crossupOSalert = crossupCHECK and ta.crossover(k, d) and (k < bandno1 or d < bandno1)
crossdownOBalert = crossdownCHECK and ta.crossunder(k, d) and (k > bandno0 or d > bandno0)
aboveBandalert = ta.crossunder(k, bandno0)
belowBandalert = ta.crossover(k, bandno1)
bgcolor(color=crossupalert and crossoverAlertBgColourMidOnOff ? #4CAF50 : crossdownalert and crossoverAlertBgColourMidOnOff ? #FF0000 : na, title='Crossover Alert Background Colour (Middle Level)', transp=70)
bgcolor(color=crossupOSalert and crossoverAlertBgColourOBOSOnOff ? #fbc02d : crossdownOBalert and crossoverAlertBgColourOBOSOnOff ? #000000 : na, title='Crossover Alert Background Colour (OB/OS Level)', transp=70)
bgcolor(color=aboveBandalert and crossoverAlertBgColourGreaterThanOnOff ? #ff0014 : crossdownalert and crossoverAlertBgColourMidOnOff ? #FF0000 : na, title='Crossover Alert - K > Upper level', transp=70)
bgcolor(color=belowBandalert and crossoverAlertBgColourLessThanOnOff ? #4CAF50 : crossdownalert and crossoverAlertBgColourMidOnOff ? #FF0000 : na, title='Crossover Alert - K < Lower level', transp=70)
alertcondition(crossupalert or crossdownalert, title='Stoch RSI Crossover', message='STOCH RSI CROSSOVER')