
Author Message:
For day traders, establishing a trend at the start of the day is critically important for setting targets and entering positions. This can be difficult when traditional moving averages lag from previous days, causing late entry and/or incorrect trend interpretation.
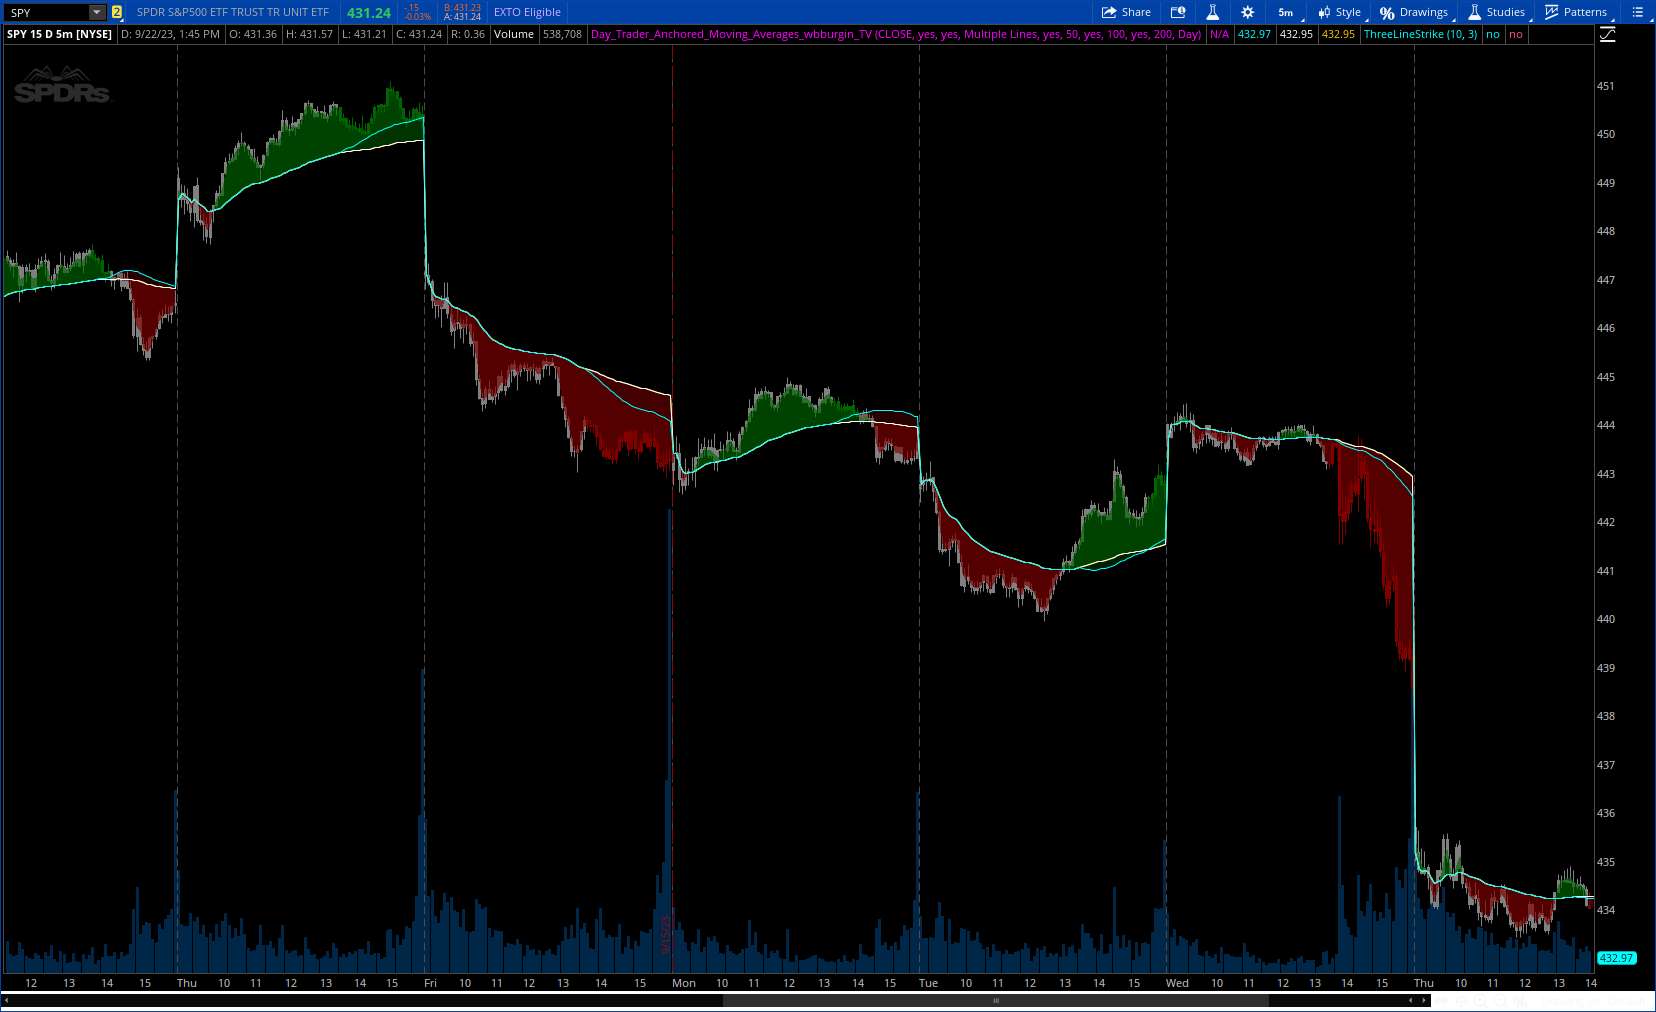
The Day Trader's Anchored MA indicator plots three dynamic moving averages which restart on each new period (session or monthly - more coming soon). This eliminates the lag in traditional moving averages while better identifying the trend, as the moving averages essentially 'build up' their lengths as the day progresses, until they reach your chosen maximum length.
This means that these anchored moving averages are
- Quicker to identify the start-of-day trend, as markets tend to establish and then follow one trend throughout the day;
- Dynamically increasing throughout the day (to your specifications)
- Completely independent from previous days
Quick usage note: make sure that your moving average length is less than the number of bars in the period, or it won't reach the maximum length you specified.
CODE:
CSS:
#// https://www.tradingview.com/v/XqWFNfGN/
#// © wbburgin
#indicator("Day Trader's Anchored Moving Averages [wbburgin]"
# Converted and mod by Sam4Cok@Samer800    - 09/2023
input source = close;        # "Source",
input showCloud = yes;    # "Highlighting"
input colorBar = yes;
input diplayMovAvg = {default "Average Line", "Multiple Lines"};
input showMovAvg1 = yes;         # "Moving Average #1"
input length1 = 50;
input showMovAvg2 = yes;         # "Moving Average #2"
input length2 = 100;
input showMovAvg3 = yes;         # "Moving Average #3"
input length3 = 200;
input period = {default "Day", "Month"};    # "Anchor Change Period"

def na = Double.NaN;
def multi = diplayMovAvg == diplayMovAvg."Multiple Lines";
def cloudCond = multi and showCloud;
def ohlc = ohlc4;
def dayofmonth = GetDayOfMonth(GetYYYYMMDD());
def month = GetMonth();
def day = period == period."Day";
def anchor_reset = if day then (dayofmonth - dayofmonth[1])
                   else (month - month[1]);

script anchored_ma {
    input source = close;
    input length = 50;
    input anchor_reset_period = yes;
    def barssince = if anchor_reset_period then 0 else barssince[1] + 1;
    def num = Min(barssince, length);
    def sum = fold i = 0 to num with p do
              p + GetValue(source, i);
    def ma = if anchor_reset_period then source else
             if num > 0 then sum / num else source;
    plot out = ma;
}

def ma_1 = anchored_ma(source, length1, anchor_reset);
def ma_2 = anchored_ma(source, length2, anchor_reset);
def ma_3 = anchored_ma(source, length3, anchor_reset);
def ma1 = ma_1;
def ma2 = ma_2;
def ma3 = ma_3;
def avg_Ma = (ma1 + ma2 + ma3) / 3;

def extUp = ohlc > ma1 and  ma1 > ma2 and ma2 > ma3;
def norUp = ohlc > ma1 and  ma1 > ma3;
def extDn = ohlc < ma1 and  ma1 < ma2 and ma2 < ma3;
def norDn = ohlc < ma1 and  ma1 < ma3;

plot AvgMa = if multi then na else avg_Ma;
plot map1 = if !showMovAvg1 or !multi then na else ma1;    # "Anchored MA 1"
plot map2 = if !showMovAvg2 or !multi then na else ma2;    # "Anchored MA 2"
plot map3 = if !showMovAvg3 or !multi then na else ma3;    # "Anchored MA 3"

AvgMa.SetDefaultColor(Color.MAGENTA);
map1.SetDefaultColor(Color.CYAN);
map2.SetDefaultColor(Color.WHITE);
map3.SetDefaultColor(Color.ORANGE);

AddCloud(if cloudCond then ma1 else na, ohlc,  Color.DARK_RED,  Color.DARK_GREEN);
AddCloud(if cloudCond then ma2 else na, ohlc, Color.DARK_RED, Color.DARK_GREEN);
AddCloud(if cloudCond then ma3 else na, ohlc, Color.DARK_RED, Color.DARK_GREEN);


AssignPriceColor(if !colorBar then Color.CURRENT else
                 if extUp then Color.GREEN else
                 if norUp then Color.DARK_GREEN else
                 if extDn then Color.RED else
                 if norDn then Color.DARK_RED else Color.GRAY);


#-- END of CODES