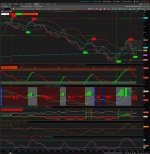
I continue to refine the set of indicators and visualization of the results to avoid multi-collinearity. However, I am spending too much time manually moving between stocks for eval.
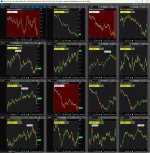
My first cut was to create a grid and populate it with the results of the scan. So I made a 4x4 grid. Each window is only displaying the simple chart, but the code running in the upper evaluates 9 buy/sell criteria from the indicators in the analysis window. When a threshold is hit, the background turns green for buy, red for sell, and default for the rest of the time. The code is in the attached text file, indicator eval.txt.
However, it is cumbersome to have to manually choose the stocks for each window in the grid.
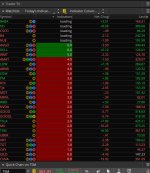
I had never played with Watchlist, but decided to try to put the results of the scan there and add a column that showed the sum of the buy indicators from the code in the grid in appropriately color coded backgrounds.
This partially works. After an unknown number of stocks are displayed working correctly, the rest simply say "loading" in the column. That number is different each time. I have played around with running the scan, getting a smaller number of stocks for the watchlist, removing the scan from memory, and variations thereof ad nauseum.
The best info that I could find is that no more than ~1000 custom cells could be used at one time. But with 25 rows and one custom cell per row, I should not be close to that limit.
The grid window is not open. The only other window that is open is the analysis window. I'm not aware of any other custom cells being used.
Is there a way to find out how much memory I can access for the watchlist? Does TOS do dynamic memory garbage cleanup or do I have to close it and reopen it every time I load a new watchlist?
Any help/direction will be appreciated.
Scan: http://tos.mx/!bB7Wxf2t
Watchlist: http://tos.mx/!wCAHglnJ
Analysis window: http://tos.mx/!gApY0VG4
Grid: Grid: http://tos.mx/!Rm4IvHdo
My first cut was to create a grid and populate it with the results of the scan. So I made a 4x4 grid. Each window is only displaying the simple chart, but the code running in the upper evaluates 9 buy/sell criteria from the indicators in the analysis window. When a threshold is hit, the background turns green for buy, red for sell, and default for the rest of the time. The code is in the attached text file, indicator eval.txt.
However, it is cumbersome to have to manually choose the stocks for each window in the grid.
I had never played with Watchlist, but decided to try to put the results of the scan there and add a column that showed the sum of the buy indicators from the code in the grid in appropriately color coded backgrounds.
This partially works. After an unknown number of stocks are displayed working correctly, the rest simply say "loading" in the column. That number is different each time. I have played around with running the scan, getting a smaller number of stocks for the watchlist, removing the scan from memory, and variations thereof ad nauseum.
The best info that I could find is that no more than ~1000 custom cells could be used at one time. But with 25 rows and one custom cell per row, I should not be close to that limit.
The grid window is not open. The only other window that is open is the analysis window. I'm not aware of any other custom cells being used.
Is there a way to find out how much memory I can access for the watchlist? Does TOS do dynamic memory garbage cleanup or do I have to close it and reopen it every time I load a new watchlist?
Any help/direction will be appreciated.
Scan: http://tos.mx/!bB7Wxf2t
Watchlist: http://tos.mx/!wCAHglnJ
Analysis window: http://tos.mx/!gApY0VG4
Grid: Grid: http://tos.mx/!Rm4IvHdo