
I like the TMO on the 1 hour time frame with extended hours turned off (open to alternative ideas though). I like to trade SPY, QQQ, NVDA, TSLA, META, XOM, GOOGL, AAPL and one or two other big companies. These companies have high options volume. The TMO on the 1 hour time frame is often accurate. But sometimes it pump fakes me. A few times I've been burned with a pump fake, and since I trade options, the losses have been significant. I feel like I have a decent set up, but I'm missing something and I just don't quite know exactly what it is. My entries ****, that I know. My entries are always too early, even when I hit big.Hey @bigworm
You still in Oregon? Big, I haven't looked in the Archive here for quite a while but JQ's archive should be in the tutorials section.
If not mistaken, Nube did a few studies mixing TMO with Supertrend and/or RSI Laguerre. I personally would suggest that you look in the Archive for Doc's (of Theotrade) that Mobius made for them and start there. Did you ask Mobius?
there are several folks that might be able to load it up and try to trouble shoot it.
I looked at the code but it's way above my head. Regarding TMO picking up pivots, no idea. Depends on your time frame possibly?...
Please tell everyone what instruments you are trading, what time frame your pivots would be used at, etc. That would be helpful.
What have you tried so far?, etc.
Are you working on your Doctorate or Masters?
@BenTen & @MerryDay, is there anyone you know here who understands machine learning and classification analysis?
You are using an out of date browser. It may not display this or other websites correctly.
You should upgrade or use an alternative browser.
You should upgrade or use an alternative browser.
TMO True Momentum Oscillator For ThinkOrSwim
- Thread starter BenTen
- Start date
No, indicator can be used in isolation.I like the TMO on the 1 hour time frame with extended hours turned off (open to alternative ideas though). I like to trade SPY, QQQ, NVDA, TSLA, META, XOM, GOOGL, AAPL and one or two other big companies. These companies have high options volume. The TMO on the 1 hour time frame is often accurate. But sometimes it pump fakes me. A few times I've been burned with a pump fake, and since I trade options, the losses have been significant. I feel like I have a decent set up, but I'm missing something and I just don't quite know exactly what it is. My entries ****, that I know. My entries are always too early, even when I hit big.
Read more:
https://usethinkscript.com/threads/...nt-to-successful-trading-in-thinkorswim.6114/
No trade should be analyzed on a single timeframe
Oscillators are challenging to use an entry indicator:
https://usethinkscript.com/threads/how-to-read-an-oscillator-in-thinkorswim.11497/
below is the TMO script found in this forum with arrows designating a crossover by main and signal.
I want to modify such that only a cross of main and signal happening under OB and OS conditions generates an arrow
For the life of me, I cant get that to happen - can anyone help with this please?
# TMO ((T)rue (M)omentum (O)scilator)
# Mobius
# V01.05.2018
#hint: TMO calculates momentum using the delta of price. Giving a much better picture of trend, tend reversals and divergence than momentum oscillators using price.
declare Lower;
input length = 14;
input calcLength = 5;
input smoothLength = 3;
def o = open;
def c = close;
def data = fold i = 0 to length
with s
do s + (if c > getValue(o, i)
then 1
else if c < getValue(o, i)
then - 1
else 0);
def EMA5 = ExpAverage(data, calcLength);
plot Main = ExpAverage(EMA5, smoothLength);
plot Signal = ExpAverage(Main, smoothLength);
Main.AssignValueColor(if Main > Signal
then color.green
else color.red);
Signal.AssignValueColor(if Main > Signal
then color.green
else color.red);
Signal.HideBubble();
Signal.HideTitle();
addCloud(Main, Signal, color.green, color.red);
plot zero = if isNaN(c) then double.nan else 0;
zero.SetDefaultColor(Color.gray);
zero.hideBubble();
zero.hideTitle();
plot ob = if isNaN(c) then double.nan else round(length * .7);
ob.SetDefaultColor(Color.gray);
ob.HideBubble();
ob.HideTitle();
plot os = if isNaN(c) then double.nan else -round(length * .7);
os.SetDefaultColor(Color.gray);
os.HideBubble();
os.HideTitle();
addCloud(ob, length, color.light_red, color.light_red, no);
addCloud(-length, os, color.light_green, color.light_green);
plot DownSignal = if Main crosses below Signal then Signal else Double.NaN;
DownSignal.SetPaintingStrategy(PaintingStrategy.Arrow_DOWN);
#AddChartBubble((DownSignal) and (DownSignal), DownSignal, "S" , Color.RED);
plot UpSignal = if Main crosses above Signal then Signal else Double.NaN;
UpSignal.SetPaintingStrategy(PaintingStrategy.Arrow_Up);
#AddChartBubble((UpSignal) and (UpSignal), UpSignal, "B" , Color.GREEN);
AddLabel (yes, if Main > Signal then "(2) MOMENTUM: BUY" + "" else "", Color.GREEN);
AddLabel (yes, if Main < Signal then "(2) MOMENTUM: SELL" + "" else "", Color.RED);
below is the TMO script found in this forum with arrows designating a crossover by main and signal.
I want to modify such that only a cross of main and signal happening under OB and OS conditions generates an arrow
For the life of me, I cant get that to happen - can anyone help with this please?
change:
to:plot UpSignal = if Main crosses above Signal then Signal else Double.NaN;
plot UpSignal = if Main crosses above Signal and (main>ob or main<os) then Signal else Double.NaN;
Last edited:
Moody
New member
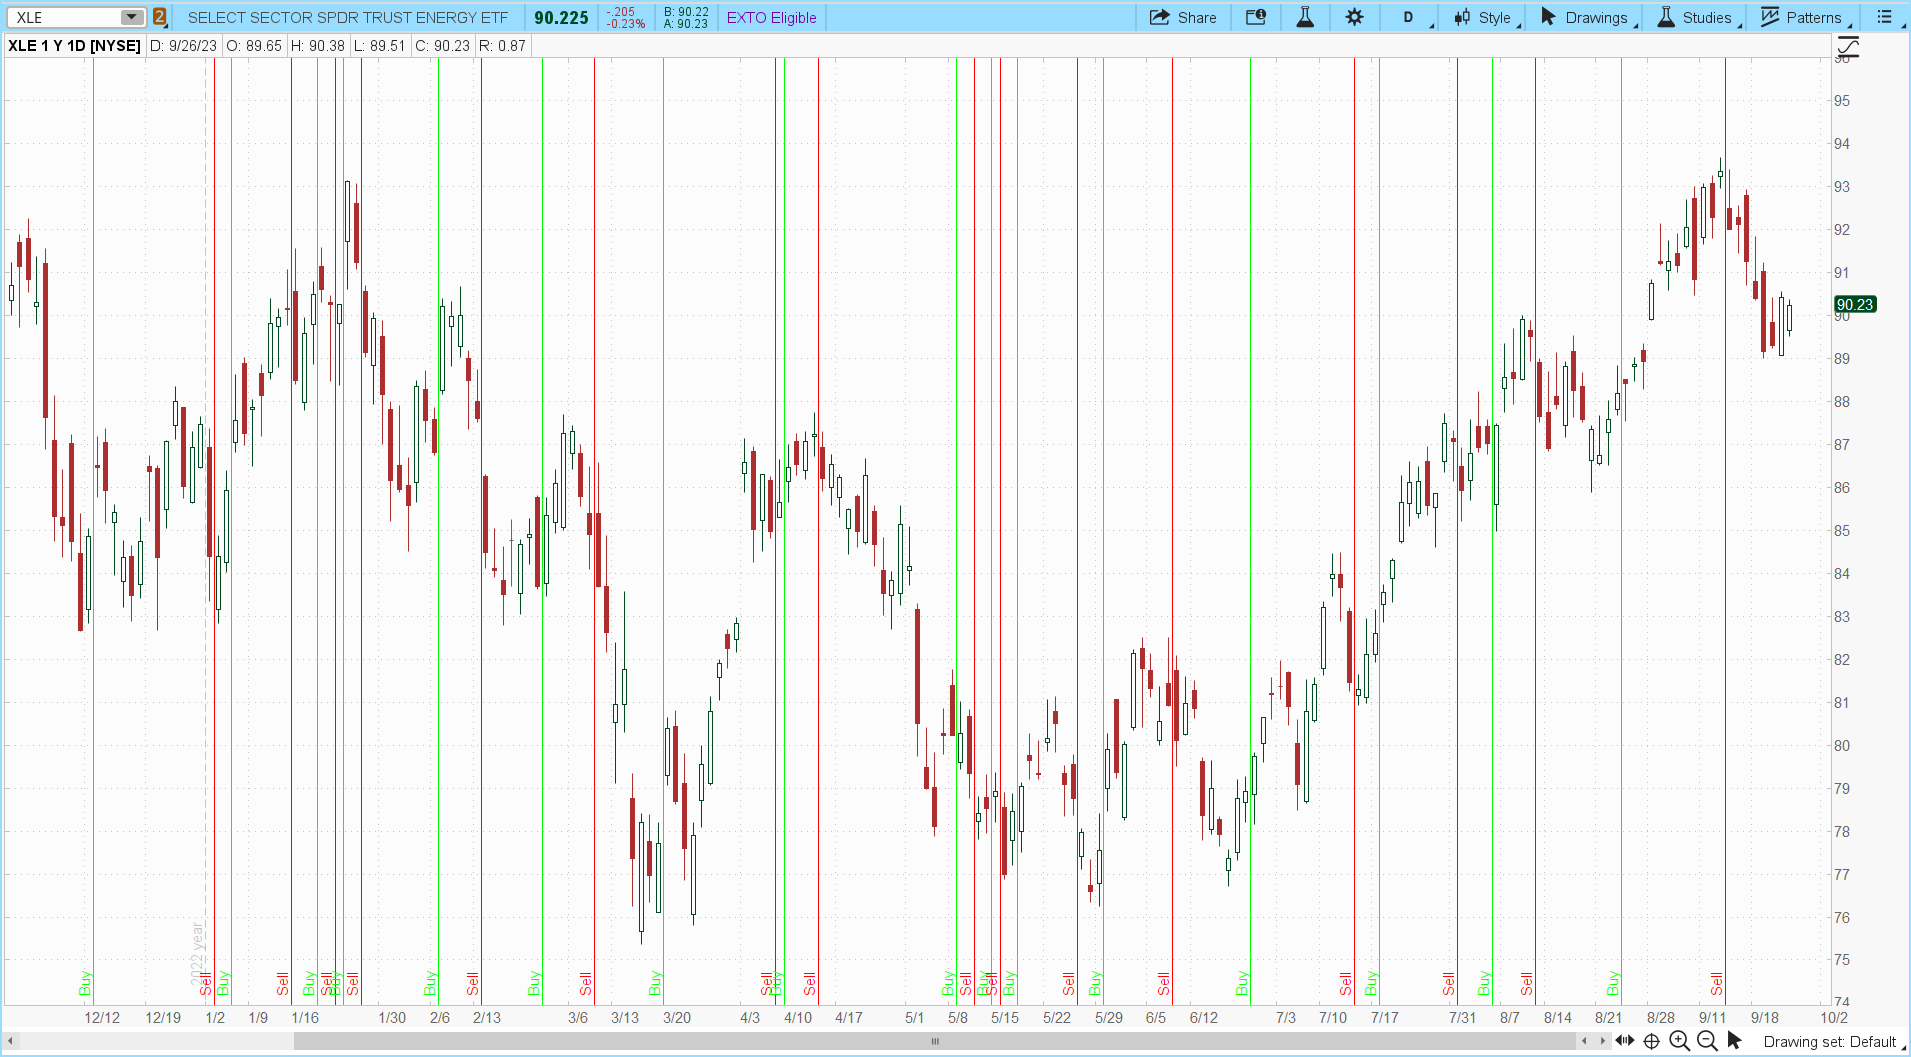
Is there a way to code this so the line on the chart and not the indicator?Hi Ben...this doesnt seem to line up with this............
def BUYsignal = Main crosses above Signal;
def SELLsignal = Main crosses below Signal;
addverticalline(BUYsignal,"Buy",color.green,curve.firm);
addverticalline(SELLsignal,"Sell",color.red,curve.firm);
it appears the signals generated by your strategy are like 2 days after these lines are drawn, was hoping you could help/revise so your strategy lined up so I could backtest.
Last edited by a moderator:
dunpeal
New member
Give this a try:Is there a way to code this so the line on the chart and not the indicator?
https://tos.mx/vD4ScOp
Ruby:
# tmo_plusminus10_upper_00

#https://usethinkscript.com/threads/horizontal-line-when-price-is-over-under-tmo-10-10.14195/
#horizontal Line when price is over/under TMO -10 & +10

#----------------------------
#https://usethinkscript.com/threads/tmo-true-momentum-oscillator-for-thinkorswim.9413/#post-24
#TMO True Momentum Oscillator For ThinkOrSwim
# BenTen  Start dateDec 18, 2018  Tagsunanswered
#https://usethinkscript.com/threads/tmo-true-momentum-oscillator-archived-posts.15/
#The following thinkScript of the true momentum oscillator was created by Mobius.
#It calculates momentum using the delta of price. Giving a much better picture of trend, tend reversals and divergence than momentum oscillators using price.

# TMO ((T)rue (M)omentum (O)scilator)
# Mobius
# V01.05.2018
# hint: TMO calculates momentum using the delta of price. Giving a much better picture of trend, tend reversals and divergence than momentum oscillators using price.

#declare Lower;

input length = 14;
input calcLength = 5;
input smoothLength = 3;

input length_factor = 0.7;

def o = open;
def c = close;
def data = fold i = 0 to length
           with s
           do s + (if c > getValue(o, i)
                   then 1
                   else if c < getValue(o, i)
                        then - 1
                        else 0);

def EMA5 = ExpAverage(data, calcLength);
def Main = ExpAverage(EMA5, smoothLength);
def Signal = ExpAverage(Main, smoothLength);
#     Main.AssignValueColor(if Main > Signal
#                           then color.green
#                           else color.red);
#     Signal.AssignValueColor(if Main > Signal
#                             then color.green
#                             else color.red);
#     Signal.HideBubble();
#     Signal.HideTitle();
#addCloud(Main, Signal, color.green, color.red);

#plot zero = if isNaN(c) then double.nan else 0;
#     zero.SetDefaultColor(Color.gray);
#     zero.hideBubble();
#     zero.hideTitle();
#def ob = if isNaN(c) then double.nan else round(length * .7);
def ob = if isNaN(c) then double.nan else round(length * length_factor);
#     ob.SetDefaultColor(Color.gray);
#     ob.HideBubble();
#     ob.HideTitle();
#def os = if isNaN(c) then double.nan else -round(length * .7);
def os = if isNaN(c) then double.nan else -round(length * length_factor);
#     os.SetDefaultColor(Color.gray);
#     os.HideBubble();
#     os.HideTitle();
#addCloud(ob, length, color.light_red, color.light_red, no);
#addCloud(-length, os, color.light_green, color.light_green);


def bn = barnumber();
def na = double.nan;

def level = round(length * length_factor);

def shi = if bn == 1 then na
 else if signal > level and Main > Signal and Main[1] > Signal[1] and Main[2] > Signal[2] then close
 else shi[1];
plot zshi = shi;
zshi.SetPaintingStrategy(PaintingStrategy.HORIZONTAL);
zshi.SetDefaultColor(Color.red);
zshi.hidebubble();

def slo = if bn == 1 then na
 else if signal < -level and Main < Signal and Main[1] < Signal[1] and Main[2] < Signal[2] then close
 else slo[1];
plot zslo = slo;
zslo.SetPaintingStrategy(PaintingStrategy.HORIZONTAL);
zslo.SetDefaultColor(Color.green);
zslo.hidebubble();


# End Code TMO
#
Last edited by a moderator:
Moody
New member
I wanted a vertical line on the chart. Not the indicator. But this looks interesting. Thanks!Give this a try:
https://tos.mx/vD4ScOp
Ruby:# tmo_plusminus10_upper_00 #https://usethinkscript.com/threads/horizontal-line-when-price-is-over-under-tmo-10-10.14195/ #horizontal Line when price is over/under TMO -10 & +10 #---------------------------- #https://usethinkscript.com/threads/tmo-true-momentum-oscillator-for-thinkorswim.9413/#post-24 #TMO True Momentum Oscillator For ThinkOrSwim # BenTen Start dateDec 18, 2018 Tagsunanswered #https://usethinkscript.com/threads/tmo-true-momentum-oscillator-archived-posts.15/ #The following thinkScript of the true momentum oscillator was created by Mobius. #It calculates momentum using the delta of price. Giving a much better picture of trend, tend reversals and divergence than momentum oscillators using price. # TMO ((T)rue (M)omentum (O)scilator) # Mobius # V01.05.2018 # hint: TMO calculates momentum using the delta of price. Giving a much better picture of trend, tend reversals and divergence than momentum oscillators using price. #declare Lower; input length = 14; input calcLength = 5; input smoothLength = 3; input length_factor = 0.7; def o = open; def c = close; def data = fold i = 0 to length with s do s + (if c > getValue(o, i) then 1 else if c < getValue(o, i) then - 1 else 0); def EMA5 = ExpAverage(data, calcLength); def Main = ExpAverage(EMA5, smoothLength); def Signal = ExpAverage(Main, smoothLength); # Main.AssignValueColor(if Main > Signal # then color.green # else color.red); # Signal.AssignValueColor(if Main > Signal # then color.green # else color.red); # Signal.HideBubble(); # Signal.HideTitle(); #addCloud(Main, Signal, color.green, color.red); #plot zero = if isNaN(c) then double.nan else 0; # zero.SetDefaultColor(Color.gray); # zero.hideBubble(); # zero.hideTitle(); #def ob = if isNaN(c) then double.nan else round(length * .7); def ob = if isNaN(c) then double.nan else round(length * length_factor); # ob.SetDefaultColor(Color.gray); # ob.HideBubble(); # ob.HideTitle(); #def os = if isNaN(c) then double.nan else -round(length * .7); def os = if isNaN(c) then double.nan else -round(length * length_factor); # os.SetDefaultColor(Color.gray); # os.HideBubble(); # os.HideTitle(); #addCloud(ob, length, color.light_red, color.light_red, no); #addCloud(-length, os, color.light_green, color.light_green); def bn = barnumber(); def na = double.nan; def level = round(length * length_factor); def shi = if bn == 1 then na else if signal > level and Main > Signal and Main[1] > Signal[1] and Main[2] > Signal[2] then close else shi[1]; plot zshi = shi; zshi.SetPaintingStrategy(PaintingStrategy.HORIZONTAL); zshi.SetDefaultColor(Color.red); zshi.hidebubble(); def slo = if bn == 1 then na else if signal < -level and Main < Signal and Main[1] < Signal[1] and Main[2] < Signal[2] then close else slo[1]; plot zslo = slo; zslo.SetPaintingStrategy(PaintingStrategy.HORIZONTAL); zslo.SetDefaultColor(Color.green); zslo.hidebubble(); # End Code TMO #
I wanted a vertical line on the chart. Not the indicator. But this looks interesting. Thanks!
Upper Chart TMO with Vertical Lines for buy and sell
Ruby:
# TMO ((T)rue (M)omentum (O)scilator)
# Mobius
# V01.05.2018
# hint: TMO calculates momentum using the delta of price. Giving a much better picture of trend, tend reversals and divergence than momentum oscillators using price.
# Modified by BenTen 03/24/2021: added vertical lines to upper chart

input length = 14;
input calcLength = 5;
input smoothLength = 3;

def o = open;
def c = close;
def data = fold i = 0 to length
           with s
           do s + (if c > getValue(o, i)
                   then 1
                   else if c < getValue(o, i)
                        then - 1
                        else 0);

def EMA5 = ExpAverage(data, calcLength);
def Main = ExpAverage(EMA5, smoothLength);
def Signal = ExpAverage(Main, smoothLength);
def BUYsignal = Main crosses above Signal;
def SELLsignal = Main crosses below Signal;
addverticalline(BUYsignal,"Buy",color.green,curve.firm);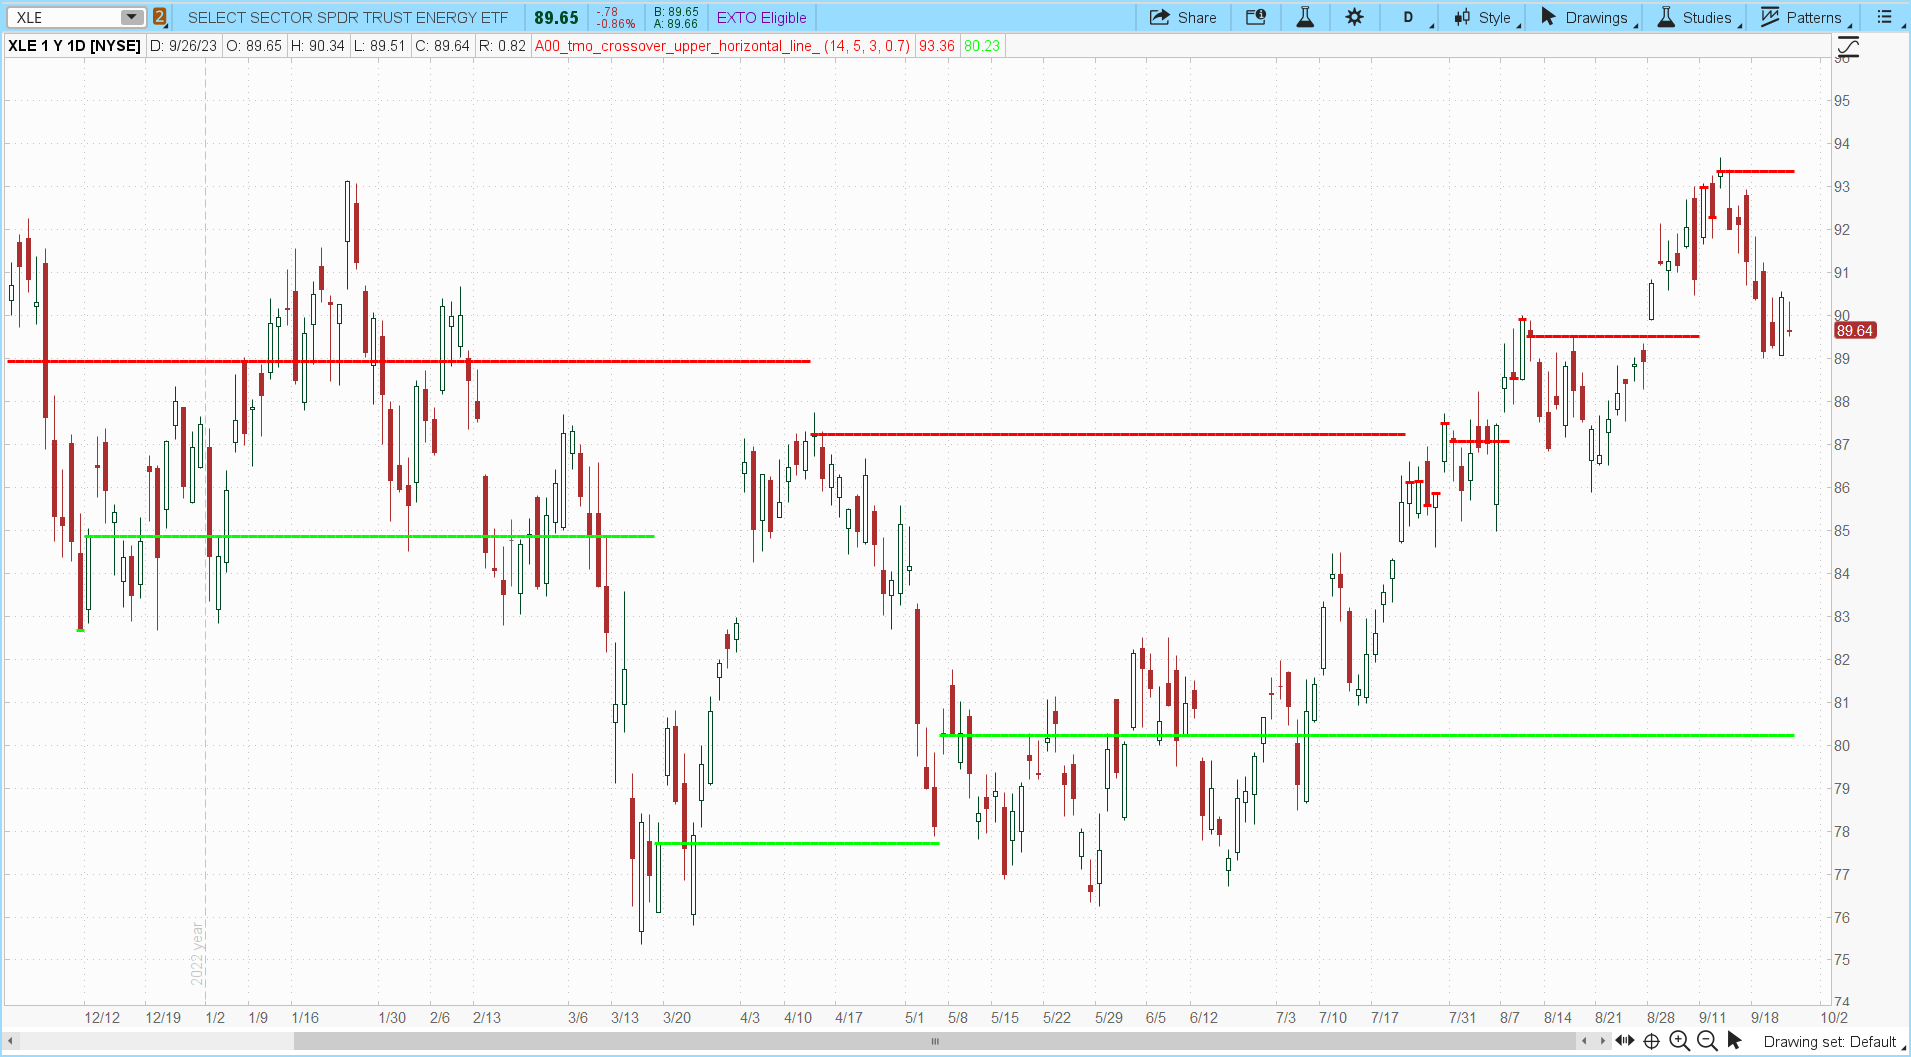
addverticalline(SELLsignal,"Sell",color.red,curve.firm);Is it possible to draw the horizontal line on the chart where the TMO signal actually crossed the 10/-10 threshold? Also keep the line there so long as its still over/under 10/-10.Give this a try:
https://tos.mx/vD4ScOp
Ruby:# tmo_plusminus10_upper_00 #https://usethinkscript.com/threads/horizontal-line-when-price-is-over-under-tmo-10-10.14195/ #horizontal Line when price is over/under TMO -10 & +10 #---------------------------- #https://usethinkscript.com/threads/tmo-true-momentum-oscillator-for-thinkorswim.9413/#post-24 #TMO True Momentum Oscillator For ThinkOrSwim # BenTen Start dateDec 18, 2018 Tagsunanswered #https://usethinkscript.com/threads/tmo-true-momentum-oscillator-archived-posts.15/ #The following thinkScript of the true momentum oscillator was created by Mobius. #It calculates momentum using the delta of price. Giving a much better picture of trend, tend reversals and divergence than momentum oscillators using price. # TMO ((T)rue (M)omentum (O)scilator) # Mobius # V01.05.2018 # hint: TMO calculates momentum using the delta of price. Giving a much better picture of trend, tend reversals and divergence than momentum oscillators using price. #declare Lower; input length = 14; input calcLength = 5; input smoothLength = 3; input length_factor = 0.7; def o = open; def c = close; def data = fold i = 0 to length with s do s + (if c > getValue(o, i) then 1 else if c < getValue(o, i) then - 1 else 0); def EMA5 = ExpAverage(data, calcLength); def Main = ExpAverage(EMA5, smoothLength); def Signal = ExpAverage(Main, smoothLength); # Main.AssignValueColor(if Main > Signal # then color.green # else color.red); # Signal.AssignValueColor(if Main > Signal # then color.green # else color.red); # Signal.HideBubble(); # Signal.HideTitle(); #addCloud(Main, Signal, color.green, color.red); #plot zero = if isNaN(c) then double.nan else 0; # zero.SetDefaultColor(Color.gray); # zero.hideBubble(); # zero.hideTitle(); #def ob = if isNaN(c) then double.nan else round(length * .7); def ob = if isNaN(c) then double.nan else round(length * length_factor); # ob.SetDefaultColor(Color.gray); # ob.HideBubble(); # ob.HideTitle(); #def os = if isNaN(c) then double.nan else -round(length * .7); def os = if isNaN(c) then double.nan else -round(length * length_factor); # os.SetDefaultColor(Color.gray); # os.HideBubble(); # os.HideTitle(); #addCloud(ob, length, color.light_red, color.light_red, no); #addCloud(-length, os, color.light_green, color.light_green); def bn = barnumber(); def na = double.nan; def level = round(length * length_factor); def shi = if bn == 1 then na else if signal > level and Main > Signal and Main[1] > Signal[1] and Main[2] > Signal[2] then close else shi[1]; plot zshi = shi; zshi.SetPaintingStrategy(PaintingStrategy.HORIZONTAL); zshi.SetDefaultColor(Color.red); zshi.hidebubble(); def slo = if bn == 1 then na else if signal < -level and Main < Signal and Main[1] < Signal[1] and Main[2] < Signal[2] then close else slo[1]; plot zslo = slo; zslo.SetPaintingStrategy(PaintingStrategy.HORIZONTAL); zslo.SetDefaultColor(Color.green); zslo.hidebubble(); # End Code TMO #
Here I've drawn a couple yellow dotted lines to see what I mean. (although I couldn't figure out how to shorten the dotted line it in TOS)

Hello,
First, let me say that I am super impressed with the admin in this place. You put in a ton of work, and I'm sure everyone really appreciates it... thank you.
Now, yet one more request, if you don't mind:
I spent a lot of time playing with this and different settings. I find the 5,15,30 combinations work best for me. However, there are pros and cons to between the 15/30 part of the equation. One gets you in a little faster but is prone to chop; the other is "safer" but a little slow to get you out.
Is there a way to get a buy signal (arrow/dot) on the 5/30 cross-up? And a sell signal on the 5/15 cross-down?
Again, thank you.
Moody
New member
lol. That looks like ****. Ill use the first one. Thanks!
Upper Chart TMO with Vertical Lines for buy and sell
Ruby:# TMO ((T)rue (M)omentum (O)scilator) # Mobius # V01.05.2018 # hint: TMO calculates momentum using the delta of price. Giving a much better picture of trend, tend reversals and divergence than momentum oscillators using price. # Modified by BenTen 03/24/2021: added vertical lines to upper chart input length = 14; input calcLength = 5; input smoothLength = 3; def o = open; def c = close; def data = fold i = 0 to length with s do s + (if c > getValue(o, i) then 1 else if c < getValue(o, i) then - 1 else 0); def EMA5 = ExpAverage(data, calcLength); def Main = ExpAverage(EMA5, smoothLength); def Signal = ExpAverage(Main, smoothLength); def BUYsignal = Main crosses above Signal; def SELLsignal = Main crosses below Signal; addverticalline(BUYsignal,"Buy",color.green,curve.firm); addverticalline(SELLsignal,"Sell",color.red,curve.firm);
I got this to work for me when it first changes to Green. Could someone lend a hand for when it first turns to Red? Thanks ---------- "B"@tenacity11 Per your request, I have modified Mobius TMO to scan for stocks when it is below -10 and the cloud has transitioned from red to green. Scanning this against the S&P 500 I obtained 1 result and on the NASDAQ Composite I obtained 43 results, using daily aggregation.
At this point I don't expect too many results as the major indices have been making new highs and most stocks are not selling off. Wait to see a correlated market so when stocks do sell off you should see a lot more results
Code:# TMO ((T)rue (M)omentum (O)scilator) Scan # Mobius, with modifications by tomsk, 1.1.2020 # V01.05.2018 #hint: TMO calculates momentum using the delta of price. Giving a much better picture of trend, tend reversals and divergence than momentum oscillators using price. input length = 14; input calcLength = 5; input smoothLength = 3; input level = -10; def o = open; def c = close; def data = fold i = 0 to length with s do s + (if c > getValue(o, i) then 1 else if c < getValue(o, i) then - 1 else 0); def EMA5 = ExpAverage(data, calcLength); def Main = ExpAverage(EMA5, smoothLength); def Signal = ExpAverage(Main, smoothLength); plot scan = main < level and signal < level and main > signal; # End TMO ((T)rue (M)omentum (O)scilator) Scan
So the syntax to define a Red data point is:I got this to work for me when it first changes to Green. Could someone lend a hand for when it first turns to Red? Thanks ---------- "B"
def red = Main <= Signal;
To find the first red, you are asking for where the prior data point was green and the current is red.
The syntax would be:
! means not and [1] means priordef red = Main <= Signal;
plot firstRed = red and !red[1];
So red and !red[1] means the current bar is red and !red[1] means the prior bar is not red
Last edited:
Hello,
I tried to insert your two lines on Lines 12 and 13, but I was getting errors.
I'm afraid I am well above my abilities. I will attempt to paste below what I am showing, or attach a file of it.
Hoping to get it where it detects the first change TO red.
Thanks so much,, hate to be a bother.
"B"
===================
# TMO ((T)rue (M)omentum (O)scilator) Scan
# Mobius, with modifications by tomsk, 1.1.2020
# V01.05.2018
#hint: TMO calculates momentum using the delta of price. Giving a much better picture of trend, tend reversals and divergence than momentum oscillators using price.
input length = 14;
input calcLength = 5;
input smoothLength = 3;
input level = -10;
def red = Main <= Signal;
plot firstRed = red and !red[1];
def o = open;
def c = close;
def data = fold i = 0 to length
with s
do s + (if c > getValue(o, i)
then 1
else if c < getValue(o, i)
then - 1
else 0);
def EMA5 = ExpAverage(data, calcLength);
def Main = ExpAverage(EMA5, smoothLength);
def Signal = ExpAverage(Main, smoothLength);
plot scan = main < level and signal < level and main > signal;
# End TMO ((T)rue (M)omentum (O)scilator) Scan
==================================================
When you see snippets of code such as scan statements, alerts, arrows, etc. in posts on the forum;Hello,
I tried to insert your two lines on Lines 12 and 13, but I was getting errors.
I'm afraid I am well above my abilities. I will attempt to paste below what I am showing, or attach a file of it.
Hoping to get it where it detects the first change TO red.
Thanks so much,, hate to be a bother.
"B"
===================
# TMO ((T)rue (M)omentum (O)scilator) Scan
# Mobius, with modifications by tomsk, 1.1.2020
# V01.05.2018
#hint: TMO calculates momentum using the delta of price. Giving a much better picture of trend, tend reversals and divergence than momentum oscillators using price.
input length = 14;
input calcLength = 5;
input smoothLength = 3;
input level = -10;
def red = Main <= Signal;
plot firstRed = red and !red[1];
def o = open;
def c = close;
def data = fold i = 0 to length
with s
do s + (if c > getValue(o, i)
then 1
else if c < getValue(o, i)
then - 1
else 0);
def EMA5 = ExpAverage(data, calcLength);
def Main = ExpAverage(EMA5, smoothLength);
def Signal = ExpAverage(Main, smoothLength);
plot scan = main < level and signal < level and main > signal;
# End TMO ((T)rue (M)omentum (O)scilator) Scan
==================================================
you would normally append them to the END of the script.
In this particular case, the poster was REPLACING the scan condition:
Replace this:
With this:plot scan = main < level and signal < level and main > signal;
def red = Main <= Signal;
plot firstRed = red and !red[1];
jonshank62
New member
I would like to modify this true momentum oscillator to add arrows and ring bell when crossovers occur , green to red =red down arrow ring bell ,red to green = green up arrow ring bell I tried but could not get it to come out right kept plotting when they crossed center line
# TMO ((T)rue (M)omentum (O)scilator)
# Mobius
# V01.05.2018
# hint: TMO calculates momentum using the delta of price. Giving a much better picture of trend, tend reversals and divergence than momentum oscillators using price.
declare Lower;
input length = 14;
input calcLength = 5;
input smoothLength = 3;
def o = open;
def c = close;
def data = fold i = 0 to length
with s
do s + (if c > getValue(o, i)
then 1
else if c < getValue(o, i)
then - 1
else 0);
def EMA5 = ExpAverage(data, calcLength);
plot Main = ExpAverage(EMA5, smoothLength);
plot Signal = ExpAverage(Main, smoothLength);
Main.AssignValueColor(if Main > Signal
then color.green
else color.red);
Signal.AssignValueColor(if Main > Signal
then color.green
else color.red);
Signal.HideBubble();
Signal.HideTitle();
addCloud(Main, Signal, color.green, color.red);
plot zero = if isNaN(c) then double.nan else 0;
zero.SetDefaultColor(Color.gray);
zero.hideBubble();
zero.hideTitle();
plot ob = if isNaN(c) then double.nan else round(length * .7);
ob.SetDefaultColor(Color.gray);
ob.HideBubble();
ob.HideTitle();
plot os = if isNaN(c) then double.nan else -round(length * .7);
os.SetDefaultColor(Color.gray);
os.HideBubble();
os.HideTitle();
addCloud(ob, length, color.light_red, color.light_red, no);
addCloud(-length, os, color.light_green, color.light_green);
For arrows:I would like to modify this true momentum oscillator to add arrows and ring bell when crossovers occur , green to red =red down arrow ring bell ,red to green = green up arrow ring bell I tried but could not get it to come out right kept plotting when they crossed center line
https://usethinkscript.com/threads/...llator-for-thinkorswim.9413/page-2#post-85843
For alerts, add this snippet to the bottom of the above script:
Alert(up, "up cross", Alert.Bar, Sound.ding);
Alert(down, "dn cross", Alert.Bar, Sound.bell);
G
guest
Guest
#TMO True Momentum Oscillator with Higher Aggregation Script and WL
#EvilSurgeon 5/16/22
#Combined Weekly and Daily into on script
#Tweeked Rising/Falling Def
#Added Breakouts
#Added arrows for crossovers
#Changed Lables per Preference
#Changed Colors Per Preference
#Combined all headers
Bugs:
1. Seems some colors over-ride others on plots and clouds, but still looks ok
2. Could not find, after lots of trial and error, a way to make weekly arrows only show up once per week (I do like when they overlap with daily though)
NOTE: Please check equations under AddLabel, AssignValueColor, and AssignBackground Color (all relatively the same), as I made some changes that may or may not be appropriate, but do seem to match up with original code.
If I did not credit a contribution appropriately, please let me know and I will update. Most, if not all, code from this thread.
All comments welcome, I am not a coder, but can piece stuff together, usually.
Script Code:
Code:##shared_TMO_wHigherAgg_SAIMOD3_Day_Wk #TMO True Momentum Oscillator with Higher Aggregation _Mobius #Tuesday, May 15, 2018 12:36 PM ## OneNote Archive Name: TMO True Momentum Oscillator with Higher Aggregation _Mobius ## Archive Section: Momentum ## Suggested Tos Name: TrueMomentumOscillator_w_HigherAggregation_Mobius ## Archive Date: 5.15.2018 ## Archive Notes: ## 08:43 Mobius: Well give it a few days to get altered, muched, distorted and twisted. Then when it get back to being used as intended someone will start making money with it. ## 08:45 Mobius: Oh and in my view - It's highest and best use is as designed with a secondary aggregation plotted either on it or with it around 5 to 10 time higher. ## "##" indicates an addition or adjustment by the OneNote Archivist ## Original Code Follows # TMO ((T)rue (M)omentum (O)scillator) With Higher Aggregation # Mobius # V01.05.2018 # TMO ((T)rue (M)omentum (O)scilator) # Mobius, with modifications by tomsk, 1.1.2020 #with Labels and Candle Painting added by @MerryDay 12/2020 #EvilSurgeon 5/16/22 #Combined Weekly and Daily into on script #Tweeked Rising/Falling Def #Added Breakouts #Added arrows for crossovers #Changed Lables per Preference #Changed Colors Per Preference #Combined all headers #hint: TMO calculates momentum using the delta of price. Giving a much better picture of trend, tend reversals and divergence than momentum oscillators using price. #Original Label color assignment: #Red =Falling.. main < signal #Orange =Trend is maxing out.. main > overbought #Gray =No trend, probable reversal.. #Cyan =Pre-trend.. main > signal and main < oversold #Green =Trend is rising.. main > signal, main > oversold, main is rising, main < overbought #BLUE =BEGINNING TO TREND.. main > signal and main is crossing above oversold #Yellow =END OF TREND.. main crossing below overbought #declare lower; input length = 14; input calcLength = 5; input smoothLength = 3; input aggday = AggregationPeriod.DAY; input aggwk = AggregationPeriod.WEEK; def oday = open(period = aggday); def cday = close(period = aggday); def dataday = fold i = 0 to length with s do s + (if cday > GetValue(oday, i) then 1 else if cday < GetValue(oday, i) then - 1 else 0); def EMA5day = ExpAverage(dataday, calcLength); plot Mainday = ExpAverage(EMA5day, smoothLength); mainday.SetLineWeight(2); #Main.AssignValueColor(if Main > Signal # then Color.GREEN # else Color.RED); plot Signalday = ExpAverage(Mainday, smoothLength); signalday.SetLineWeight(2); #Signal.AssignValueColor(if Main > Signal #then Color.GREEN #else Color.RED); Signalday.HideBubble(); Signalday.HideTitle(); #AddCloud(Main, Signal, Color.LIGHT_GREEN, Color.RED); def owk = open(period = aggwk); def cwk = close(period = aggwk); def datawk = fold iwk = 0 to length with swk do swk + (if cwk > GetValue(owk, iwk) then 1 else if cwk < GetValue(owk, iwk) then - 1 else 0); def EMA5wk = ExpAverage(datawk, calcLength); plot Mainwk = ExpAverage(EMA5wk, smoothLength); mainwk.SetLineWeight(2); #Main.AssignValueColor(if Main > Signal # then Color.GREEN # else Color.RED); plot Signalwk = ExpAverage(Mainwk, smoothLength); signalwk.SetLineWeight(2); #Signal.AssignValueColor(if Main > Signal #then Color.GREEN #else Color.RED); #Signal.HideBubble(); #Signal.HideTitle(); #AddCloud(Main, Signal, Color.LIGHT_GREEN, Color.RED); plot zero = if IsNan(cday) then Double.NaN else 0; zero.SetDefaultColor(Color.GRAY); zero.HideBubble(); zero.HideTitle(); plot ob = if IsNan(cday) then Double.NaN else 10; ob.SetDefaultColor(Color.GRAY); ob.HideBubble(); ob.HideTitle(); plot os = if IsNan(cday) then Double.NaN else -10; os.SetDefaultColor(Color.GRAY); os.HideBubble(); os.HideTitle(); AddCloud(ob, length, CreateColor(50, 205, 50), CreateColor(50, 205, 50), yes); AddCloud(-length, os,CreateColor ( 240,128,128 ),CreateColor ( 240,128,128 ), yes); #charting and formatting DefineGlobalColor("pretrend", CreateColor(0, 255, 127)); DefineGlobalColor("TrendBEGIN", Color.DARK_GREEN); DefineGlobalColor("TrendBrkOutUp", CreateColor( 34, 139, 34 ) ); DefineGlobalColor("rising", CreateColor(60, 179, 113)); DefineGlobalColor("maxxed", Color.DARK_ORANGE); DefineGlobalColor("TrendEnd", Color.DARK_RED); DefineGlobalColor("TrendBrkoutDwn", Color.RED); DefineGlobalColor("falling", color.downtick); #CreateColor(255, 215, 0)); DefineGlobalColor("neutral", Color.YELLOW); AddLabel(yes, "TMO Trnd Day", Color.BLUE); AddLabel( mainday < os , "PreTrnd" , GlobalColor("pretrend") ); AddLabel( mainday > ob , "TrndMax" , GlobalColor("maxxed") ); AddLabel( mainday crosses above os , "BeginTrnd" , GlobalColor("TrendBEGIN") ); AddLabel( mainday crosses below ob , "TrndEnd" , GlobalColor("TrendEnd") ); AddLabel( mainday < signalday , "Bearish", GlobalColor("falling") ); AddLabel( mainday >= signalday, "Bullish" , GlobalColor("rising") ); AddLabel( mainday crosses above signalday , "Trend BrkOut Up" , GlobalColor("TrendBrkOutUp") ); AddLabel( mainday crosses below signalday , "Trend Brkout Dwn" , GlobalColor("TrendBrkoutDwn") ); AddLabel( mainday < mainday[1] , "TrndDwn" , GlobalColor("falling") ); AddLabel( mainday >= mainday[1] , "TrndUp" , GlobalColor("rising") ); mainday.AssignValueColor( if mainday < os then GlobalColor("pretrend") else if mainday > ob then GlobalColor("maxxed") else if mainday crosses above os then GlobalColor("TrendBEGIN") else if mainday crosses below ob then GlobalColor("TrendEND") else if mainday crosses above signalday then GlobalColor("TrendBrkOutUp") else if mainday crosses below signalday then GlobalColor("TrendBrkoutDwn") else if mainday < signalday then GlobalColor("falling") else if mainday >= signalday then GlobalColor("rising") else if mainday < mainday[1] then GlobalColor("falling") else if mainday >= mainday[1] then GlobalColor("rising") else GlobalColor("neutral")) ; signalday.AssignValueColor( if mainday < os then GlobalColor("pretrend") else if mainday > ob then GlobalColor("maxxed") else if mainday crosses above os then GlobalColor("TrendBEGIN") else if mainday crosses below ob then GlobalColor("TrendEND") else if mainday crosses above signalday then GlobalColor("TrendBrkOutUp") else if mainday crosses below signalday then GlobalColor("TrendBrkoutDwn") else if mainday < signalday then GlobalColor("falling") else if mainday >= signalday then GlobalColor("rising") else if mainday < mainday[1] then GlobalColor("falling") else if mainday >= mainday[1] then GlobalColor("rising") else GlobalColor("neutral")) ; AddCloud(if mainday crosses below ob then mainday else double.nan, if mainday crosses below ob then signalday else double.nan, GlobalColor("TrendEND"), GlobalColor("TrendEND")); AddCloud(if mainday crosses above os then mainday else double.nan, if mainday crosses above os then signalday else double.nan, GlobalColor("TrendBEGIN"), GlobalColor("TrendBEGIN"));AddCloud(if mainday > ob then mainday else double .nan , if signalday > ob then signalday else double.nan, GlobalColor("maxxed"), GlobalColor("maxxed")); AddCloud(mainday , signalday, GlobalColor("rising"), GlobalColor("falling")); AddCloud(if mainday < os then mainday else double.nan, if mainday < os then signalday else double.nan, GlobalColor("pretrend"), GlobalColor("pretrend")); plot arrow = if mainday crosses above os then mainday else Double.NaN; arrow.SetPaintingStrategy(PaintingStrategy.ARROW_UP); arrow.SetDefaultColor(Color.DARK_GREEN); arrow.SetLineWeight(4); plot arrow2 = if mainday crosses below ob then mainday else Double.NaN; arrow2.SetPaintingStrategy(PaintingStrategy.ARROW_DOWN); arrow2.SetDefaultColor(Color.DARK_RED); arrow2.SetLineWeight(4); plot arrow3_1 = if mainday crosses above signalday then mainday else double.nan; arrow3_1.SetPaintingStrategy(PaintingStrategy.ARROW_UP); arrow3_1.SetDefaultColor(Color.GREEN); arrow3_1.SetLineWeight(4); plot arrow4 = if mainday crosses below signalday then mainday else Double.NaN; arrow4.SetPaintingStrategy(PaintingStrategy.ARROW_DOWN); arrow4.SetDefaultColor(Color.RED); arrow4.SetLineWeight(4); AddLabel(yes, " ", color.black); AddLabel(yes, "TMO Trnd Week", Color.BLUE); AddLabel( mainwk < os , "PreTrnd" , GlobalColor("pretrend") ); AddLabel( mainwk > ob , "TrndMax" , GlobalColor("maxxed") ); AddLabel( mainwk crosses above os , "BeginTrnd" , GlobalColor("TrendBEGIN") ); AddLabel( mainwk crosses below ob , "TrndEnd" , GlobalColor("TrendEnd") ); AddLabel( mainwk < signalwk , "Bearish", GlobalColor("falling") ); AddLabel( mainwk >= signalwk, "Bullish" , GlobalColor("rising") ); AddLabel( mainwk crosses above signalwk , "Trend BrkOut Up" , GlobalColor("TrendBrkOutUp") ); AddLabel( mainwk crosses below signalwk , "Trend Brkout Dwn" , GlobalColor("TrendBrkoutDwn") ); AddLabel( mainwk < mainwk[1] , "TrndDwn" , GlobalColor("falling") ); AddLabel( mainwk >= mainwk[1] , "TrndUp" , GlobalColor("rising") ); mainwk.AssignValueColor( if mainwk < os then GlobalColor("pretrend") else if mainwk > ob then GlobalColor("maxxed") else if mainwk crosses above os then GlobalColor("TrendBEGIN") else if mainwk crosses below ob then GlobalColor("TrendEND") else if mainwk crosses above signalwk then GlobalColor("TrendBrkOutUp") else if mainwk crosses below signalwk then GlobalColor("TrendBrkoutDwn") else if mainwk < signalwk then GlobalColor("falling") else if mainwk >= signalwk then GlobalColor("rising") else if mainwk < mainwk[1] then GlobalColor("falling") else if mainwk >= mainwk[1] then GlobalColor("rising") else GlobalColor("neutral")) ; signalwk.AssignValueColor( if mainwk < os then GlobalColor("pretrend") else if mainwk > ob then GlobalColor("maxxed") else if mainwk crosses above os then GlobalColor("TrendBEGIN") else if mainwk crosses below ob then GlobalColor("TrendEND") else if mainwk crosses above signalwk then GlobalColor("TrendBrkOutUp") else if mainwk crosses below signalwk then GlobalColor("TrendBrkoutDwn") else if mainwk < signalwk then GlobalColor("falling") else if mainwk >= signalwk then GlobalColor("rising") else if mainwk < mainwk[1] then GlobalColor("falling") else if mainwk >= mainwk[1] then GlobalColor("rising") else GlobalColor("neutral")) ; AddCloud(if mainwk crosses below ob then mainwk else double.nan, if mainwk crosses below ob then signalwk else double.nan, GlobalColor("TrendEND"), GlobalColor("TrendEND")); AddCloud(if mainwk crosses above os then mainwk else double.nan, if mainwk crosses above os then signalwk else double.nan, GlobalColor("TrendBEGIN"), GlobalColor("TrendBEGIN")); AddCloud(if mainwk > ob then mainwk else double .nan , if signalwk > ob then signalwk else double.nan, GlobalColor("maxxed"), GlobalColor("maxxed")); AddCloud(mainwk , signalwk, GlobalColor("rising"), GlobalColor("falling")); AddCloud(if mainwk < os then mainwk else double.nan, if mainwk < os then signalwk else double.nan, GlobalColor("pretrend"), GlobalColor("pretrend")); plot arrowwk = if mainwk crosses above os then mainwk else Double.NaN; arrowwk.SetPaintingStrategy(PaintingStrategy.ARROW_UP); arrowwk.SetDefaultColor(CreateColor(60, 179, 113)); arrowwk.SetLineWeight(4); plot arrow2wk = if mainwk crosses below ob then mainwk else Double.NaN; arrow2wk.SetPaintingStrategy(PaintingStrategy.ARROW_DOWN); arrow2wk.SetDefaultColor(Color.downtick); arrow2wk.SetLineWeight(4); plot arrow3_1wk = if mainwk crosses above signalwk then mainwk else double.nan; arrow3_1wk.SetPaintingStrategy(PaintingStrategy.ARROW_UP); arrow3_1wk.SetDefaultColor(CreateColor(50, 205, 50)); arrow3_1wk.SetLineWeight(4); plot arrow4wk = if mainwk crosses below signalwk then mainwk else Double.NaN; arrow4wk.SetPaintingStrategy(PaintingStrategy.ARROW_DOWN); arrow4wk.SetDefaultColor(CreateColor(255, 215, 0)); arrow4wk.SetLineWeight(4); # End Code
Watchlist Code:
Code:##TMO_WL SAI MOD #TMO True Momentum Oscillator with Higher Aggregation _Mobius #Tuesday, May 15, 2018 12:36 PM ## OneNote Archive Name: TMO True Momentum Oscillator with Higher Aggregation _Mobius ## Archive Section: Momentum ## Suggested Tos Name: TrueMomentumOscillator_w_HigherAggregation_Mobius ## Archive Date: 5.15.2018 ## Archive Notes: ## 08:43 Mobius: Well give it a few days to get altered, muched, distorted and twisted. Then when it get back to being used as intended someone will start making money with it. ## 08:45 Mobius: Oh and in my view - It's highest and best use is as designed with a secondary aggregation plotted either on it or with it around 5 to 10 time higher. ## "##" indicates an addition or adjustment by the OneNote Archivist ## Original Code Follows # TMO ((T)rue (M)omentum (O)scillator) With Higher Aggregation # Mobius # V01.05.2018 # TMO ((T)rue (M)omentum (O)scilator) # Mobius, with modifications by tomsk, 1.1.2020 #with Labels and Candle Painting added by @MerryDay 12/2020 #EvilSurgeon 5/16/22 #Added Breakouts #Tweeked Rising/Falling Def #Changed Lables per Preference #Changed Colors Per Preference #Combined all headers #hint: TMO calculates momentum using the delta of price. Giving a much better picture of trend, tend reversals and divergence than momentum oscillators using price. #Original Label color assignment: #Red =Falling.. main < signal #Orange =Trend is maxing out.. main > overbought #Gray =No trend, probable reversal.. #Cyan =Pre-trend.. main > signal and main < oversold #Green =Trend is rising.. main > signal, main > oversold, main is rising, main < overbought #BLUE =BEGINNING TO TREND.. main > signal and main is crossing above oversold #Yellow =END OF TREND.. main crossing below overbought def length = 14; def calcLength = 5; def smoothLength = 3; def tmo_ob = 10; def tmo_os = -10; def data = fold i = 0 to length with s do s + (if close > getValue(open, i) then 1 else if close < getValue(open, i) then - 1 else 0); def EMA5 = ExpAverage(data, calcLength); def Main = ExpAverage(EMA5, smoothLength); def Signal = ExpAverage(Main, smoothLength); def TMO = round(main,0); # ######################################################## #charting and formatting #DefineGlobalColor("pretrend", CreateColor(0, 255, 127)); #DefineGlobalColor("TrendBEGIN", Color.DARK_GREEN); #DefineGlobalColor("TrendBrkOutUp", CreateColor( 34, 139, 34 ) ); #DefineGlobalColor("rising", CreateColor(60, 179, 113)); #DefineGlobalColor("maxxed", Color.DARK_ORANGE); #DefineGlobalColor("TrendEnd", Color.DARK_RED); #DefineGlobalColor("TrendBrkoutDwn", Color.RED); #DefineGlobalColor("falling", color.downtick); #CreateColor(255, 215, 0)); #DefineGlobalColor("neutral", Color.YELLOW); AddLabel(yes, TMO + if main crosses above tmo_os then " BeginTrnd" else "" + if main crosses below tmo_ob then " TrndEnd" else "" + if main < tmo_os then " PreTrnd" else "" + if main > tmo_ob then " TrndMax" else "" + if main < signal then " Bearish" else "" + if main >= signal then " Bullish" else "" + if main crosses above signal then " Trend BrkOut Up" else "" + if main crosses below signal then " Trend Brkout Dwn" else "" + if main < main[1] then " TrndDwn" else "" + if main >= main[1] then " TrndUp" else "", color.black);# AssignBackgroundColor( if main < tmo_os then CreateColor(0, 255, 127) else if main > tmo_ob then Color.DARK_ORANGE else if main crosses above tmo_os then Color.DARK_GREEN else if main crosses below tmo_ob then Color.DARK_RED else if main crosses above signal then CreateColor( 34, 139, 34 ) else if main crosses below signal then Color.RED else if main < signal then color.downtick else if main >= signal then CreateColor(60, 179, 113) else if main < main[1] then color.downtick else if main >= main[1] then CreateColor(60, 179, 113) else color.yellow) ;
Chart and WL images:
Hey @EvilSurgeon were able to figure out how to scan on the weekly signals? Love the indicator by the way, great work!
No, the scan hacker does not support secondary timeframes inside of scripts.Hey @EvilSurgeon were able to figure out how to scan on the weekly signals? Love the indicator by the way, great work!
But no fear. Just use the 1st post and set up your scanner for a weekly timeframe
Join useThinkScript to post your question to a community of 21,000+ developers and traders.
| Thread starter | Similar threads | Forum | Replies | Date |
|---|---|---|---|---|
|
|
Archived: TMO True Momentum Oscillator | Indicators | 346 | |
|
|
Repaints TMO with Higher Agg_Mobius @ TSL | Indicators | 207 | |
| C | Repaints True Strength Index Indicator for ThinkorSwim | Indicators | 33 | |
| D | Average True Range (ATR) Implied Move for ThinkorSwim | Indicators | 5 | |
| T | Repaints Multi-Time Frame True Momentum Oscillator (MTF) for ThinkorSwim | Indicators | 165 |
Similar threads
-

-

-
-
-
Repaints Multi-Time Frame True Momentum Oscillator (MTF) for ThinkorSwim
- Started by tomsk
- Replies: 165
Not the exact question you're looking for?
Start a new thread and receive assistance from our community.
87k+
Posts
1591
Online
Similar threads
-
-
-
-
-
Repaints Multi-Time Frame True Momentum Oscillator (MTF) for ThinkorSwim
- Started by tomsk
- Replies: 165
Similar threads
-
-
-
-
-
Repaints Multi-Time Frame True Momentum Oscillator (MTF) for ThinkorSwim
- Started by tomsk
- Replies: 165
The Market Trading Game Changer
Join 2,500+ subscribers inside the useThinkScript VIP Membership Club
- Exclusive indicators
- Proven strategies & setups
- Private Discord community
- ‘Buy The Dip’ signal alerts
- Exclusive members-only content
- Add-ons and resources
- 1 full year of unlimited support
Frequently Asked Questions
What is useThinkScript?
useThinkScript is the #1 community of stock market investors using indicators and other tools to power their trading strategies. Traders of all skill levels use our forums to learn about scripting and indicators, help each other, and discover new ways to gain an edge in the markets.
How do I get started?
We get it. Our forum can be intimidating, if not overwhelming. With thousands of topics, tens of thousands of posts, our community has created an incredibly deep knowledge base for stock traders. No one can ever exhaust every resource provided on our site.
If you are new, or just looking for guidance, here are some helpful links to get you started.
- The most viewed thread:
https://usethinkscript.com/threads/repainting-trend-reversal-for-thinkorswim.183/ - Our most popular indicator:
https://usethinkscript.com/threads/buy-the-dip-indicator-for-thinkorswim.3553/ - Answers to frequently asked questions:
https://usethinkscript.com/threads/answers-to-commonly-asked-questions.6006/
What are the benefits of VIP Membership?
VIP members get exclusive access to these proven and tested premium indicators: Buy the Dip, Advanced Market Moves 2.0, Take Profit, and Volatility Trading Range. In addition, VIP members get access to over 50 VIP-only custom indicators, add-ons, and strategies, private VIP-only forums, private Discord channel to discuss trades and strategies in real-time, customer support, trade alerts, and much more. Learn all about VIP membership here.
How can I access the premium indicators?
To access the premium indicators, which are plug and play ready, sign up for VIP membership here.