TMO or RSI in Laguerre Time with FE - Q&A

markos

Well-known member
VIP

A useThinkScript Conversation re TMO vs RSI Laguerre w Fractal Energy (FE)

Before we start answering questions, if you are using the set up that I shared, notice that the Slim Ribbon overrides coloring of candles. Whether you use Candles, Bars, or Heiken Ashi, it will not matter. If you're wondering where to get my set ups, here they are: https://tos.mx/bc1Hwy and https://tos.mx/onxiH8
Bars and Heiken Ashi are the two I use for no particular reason. They are just 3 exponential moving averages that are set to Fibonacci numbers.
In his video, I believe, Slim Miller states that it is a guide for your indicators as well as the chart pattern that you see. (see website AskSlim.com/slimribbon)

There is no holy grail or magic bullet in investing or trading. There’s only discipline, vigilance, and understanding that the market will do whatever it wants, and it does not care what you think. Have no ego. Ego can drain an account quite fast.

For me, watching markets is about the probability of Z happening if X or Y happen.
If the market or my position does X, Y, or Z then I will react in a certain way.
With Options, it’s about expected move and days to expiration (DTE).

About indicators: Indicators do just that, they indicate.
Just like seeing rain clouds does not mean that it will rain on you.
It does indicate, however, that there is a higher probability that it will rain on you.

Q: Start with TMO: Is there any tutorial or videos on TMO?

A: Possibly, but doubtful, though I have never looked. The study's creator, Mobius, only gave an occasional comment outside of the code since he posted the study. Read the code for clues. What makes it unique is that it is based on the Delta of Price, and not price itself.

Q: I would like to understand how you utilise both Week and Day TMO indicator for analysis?

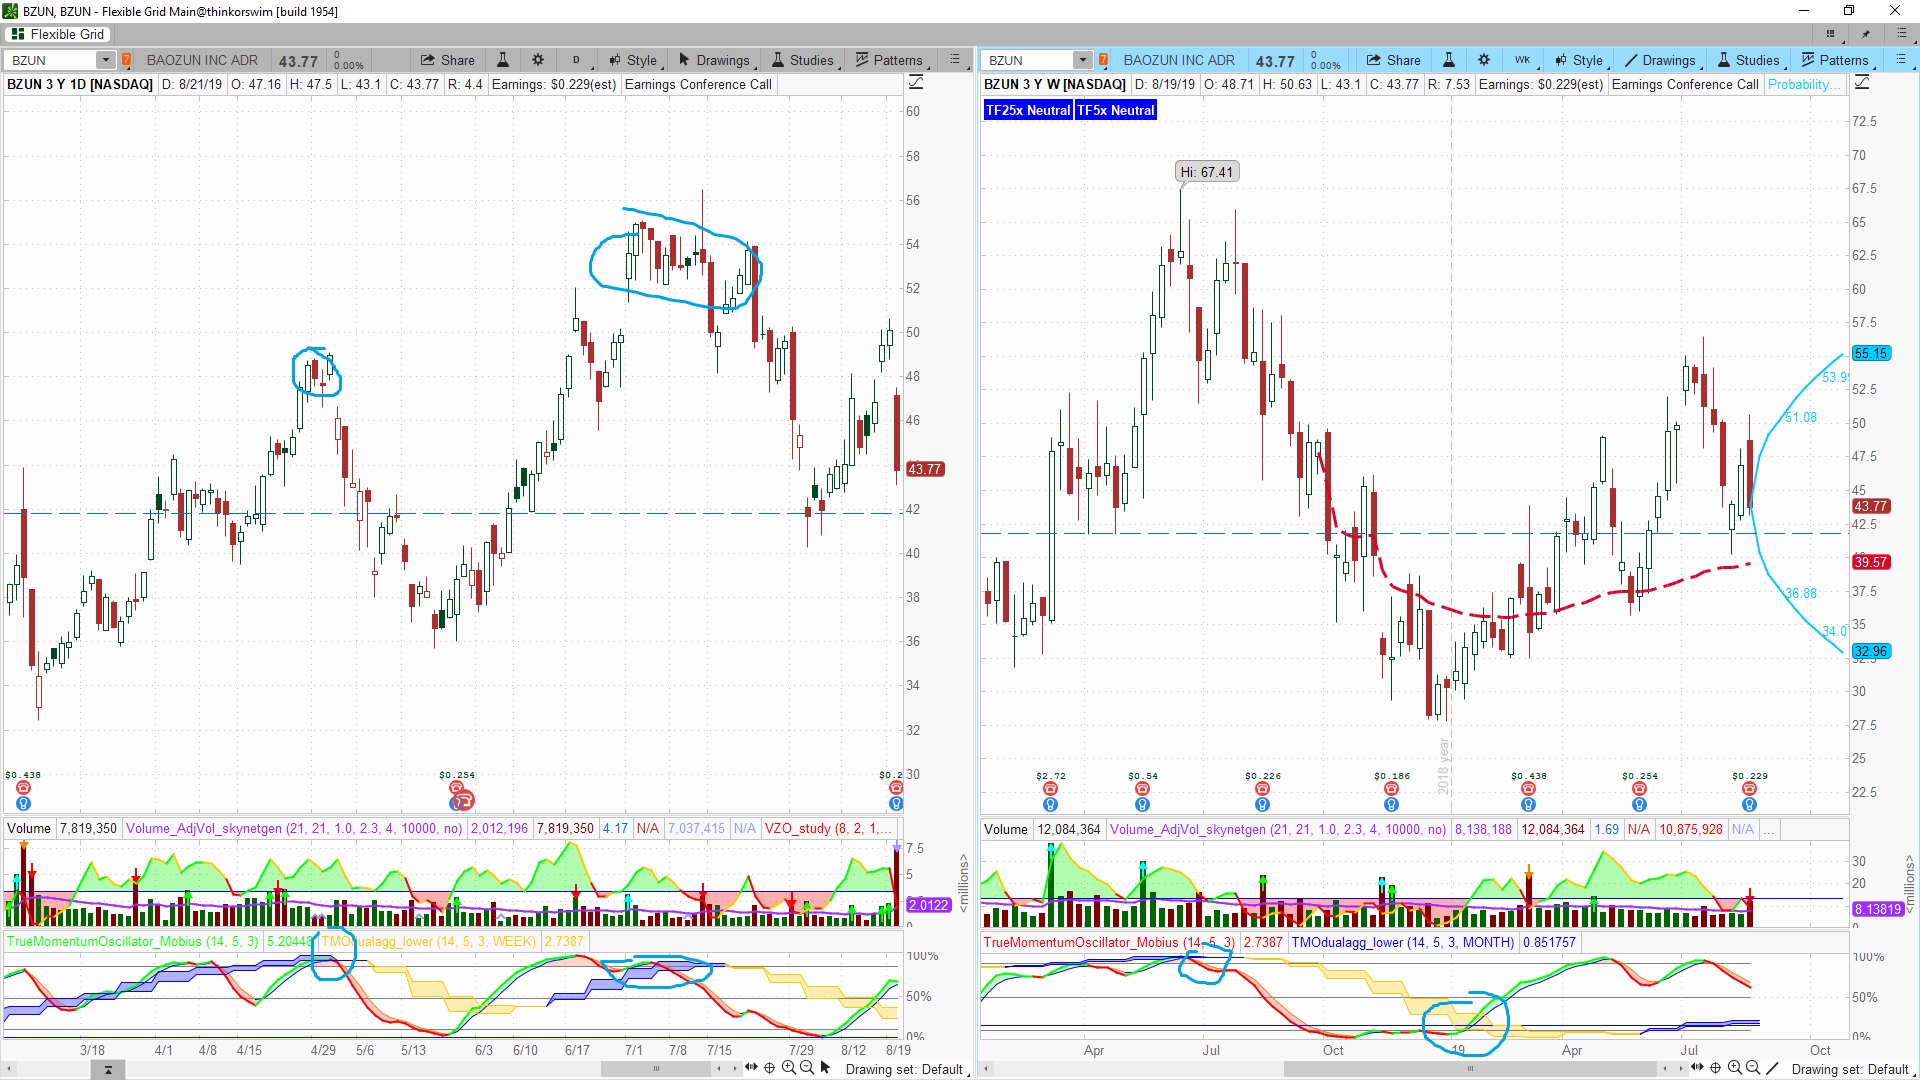
A: The idea is that markets are "Fractal". Smaller patterns are just parts of larger patterns. The thought is that one should use at least 2 if not 3 time frames to be more certain of what the trend is. To make it easier we put the weekly and the daily TMO on the same chart.
If the weekly TMO is red and sloped down, any green daily uptrend may be short-lived, and so on. I use a daily and weekly chart to watch my chart patterns.
If you use a one hour chart, use a one hour TMO and a daily chart with a daily TMO, then observe.

Q: I did observe the Daily TMO polarity change as a precursor for potential direction change, but wondered if you use RSI as the confirmation when RSI cuts below .80

A: No, with the RSI Laguerre w Fractal Energy (FE) and the TMO on the same chart it is compare and contrast only.
However, you are correct, when RSILg w FE is dropping below .80, price will most often follow.
The same is said when the RSILg w FE moves above .20, that it is a signal that price will often start moving up.
That is where price action comes in. Price is the main indicator. Compare a stock to its peers, how is it acting?
Put price together with an indicator and look on multiple time frames and plan your course of action.
And no, it’s not that easy!

Q: As a process, you have the TMO under your RSILg on the chart, I presume your focus is to first define the strength of momentum with RSI and then apply TMO as direction?

A: Not at all, they could be in any order. On my chart the Daily/Weekly TMO is above the RSI Laguerre and only to compare and contrast until a person removes one lower chart or the other. (More on that later)

Q: On RSILg: I have read the tutorial on RSI Laguerre, need a bit more time to internalise it.

Info: this study is based off of the standard RSI (14) that many use. It works and looks different because of the Laguerre Polynomials that are used.
The polynomials make the study Time Adjusting, based on the “speed” of the underlying product eg. Stocks or ETF’s, etc.

Q: One clarification on what you mentioned: If gamma is up over 60, the likelihood of the stock moving in the direction of your other indicators is more likely. May I know if the "other indicators" refers to RSILg?

A: The statement about gamma being over 60 came from user Mobius in ThinkorSwim’s thinkScript Lounge. The notes in that tutorial were taken over a number of years of conversation by user zztop in the thinkScript Lounge. Mobius, rightly, never stated specifically which indicators. We are left to our best judgment on this.

Q: You have shared CHOP indicator, is that the same as FE with different setting?

A: That is a good question. The CHOP indicator came along in the mid-nineteen sixties by a commodities trader named EW Driess. The FE came along a little bit later. They are totally different math constructs but show nearly the same results. IMO, they are interchangeable.

If you were to stop using the RSI Laguerre w Fractal Energy and just used the TMO, then you might consider using the Chop indicator.
Chop or FE tell you when an instrument is charged up with the potential to move or exhausted with little probable potential to move.
Please recall however that just like with the RSI (14), a stock can continue to be “over bought or oversold”, the FE of the RSILg can remain charged up or exhausted for a longer period of time than one might think.

The RSI Laguerre with FE and the TMO are on the same chart for training and to compare and contrast how they work.

We run a danger of Multi-collinearity. Please see the study of this in the Tutorial section.
We should only run one of a type of study on a chart. Such as the TMO on a daily and the RSI Laguerre with FE on a weekly chart.
The idea here is to decide which one you like better for your style and learn from it.
If you rely on both of them, you will have competing signals, which could just cause a paralysis in one’s ability to decide on a course of action.

Good Trading, Markos & Nick
 

Join useThinkScript to post your question to a community of 21,000+ developers and traders.

@markos, that second set up with TMO - I noticed you can't change the aggregation in the properties. I have a version that can. What is your agg setting for TMO when using the 1H chart? Is it 1D?
 
@markos, that second set up with TMO - I noticed you can't change the aggregation in the properties. I have a version that can. What is your agg setting for TMO when using the 1H chart? Is it 1D?
The numbers are always the same for any time frame. 14,5,3. Feel free to change out indicators so that you can use multiple TF's.
For a 1 hour chart, use 1 hour with 4 hours or Daily. It will be a preference thing for everyone.
I have changed the 14 to 21 to compare. The signals are later of course, but the dips below the zero line are lessened.
The learning comes from watching.
@Nick feel free to add your "2 cents" in anytime.
 
Last edited:
I was investigating oscillators heavily and came to following conclusions, if compared to Basic RSI/Stochastic

RsiLag+FE - too hard to use and counterintuitive
TMO - very visually simple,easy. works great with dual aggregation setup
TDI (RSI+2MA + Bollinger bands) - is also very interesting. If not for TMO I would probably use this.

There is also MFI and UO which can be a base for TDI like indicator. But all in all TMO is very simple to understand and to use without additional tuning (even stock interval works great).
 
Just wanted to add my 2 cents. I changed the Glength to 5 to match the speed of the older RSILaguerre. While I am subject to more false signals, TMO helps to filter those out and as a day trader, I need to get in a candle earlier to maximize profit and minimize risk.
 
I was investigating oscillators heavily and came to following conclusions, if compared to Basic RSI/Stochastic

RsiLag+FE - too hard to use and counterintuitive
TMO - very visually simple,easy. works great with dual aggregation setup
TDI (RSI+2MA + Bollinger bands) - is also very interesting. If not for TMO I would probably use this.

There is also MFI and UO which can be a base for TDI like indicator. But all in all TMO is very simple to understand and to use without additional tuning (even stock interval works great).
Hi skynetgen,

Do you mind sharing how you get your signals using the TMO? I read the tutorials but the only conclusion I can draw is to go short when it crosses below the +10 line and go long when it crosses above the -10 line. I have no idea what to do when it changes color in between these 2 signal lines. Thanks in advance!

Sure.

ne6pg2b.jpg


See I look for the cross between TMO on current and higher aggregation. This is a good place to look for reversal/change of character
I try to go when lower aggregation matches direction of higher aggregation.
And why I didnt circle (and would ignore) tmo curling up on 5/29 - because weekly TMO was still going down. But 5/6 and 7/17 were perfectly aligned signals . Also on the weekly (right chart) note that presently monthly TMO already curling up. When weekly hits bot and starts aligning up I will be looking for entry ( depending on price action it will be most likely around $40 or $35)
 
Last edited:
Can someone tell me why my TMO looks so weird.
Hi tenacity11,

I am not sure why your TMO looks strange as I'm new to this indicator and trying to understand it better. I was wondering if you wouldn't mind providing a share link or post the code for your RSI Lagg which seems to turn red and green as it crosses the signal lines? I would very much appreciate it and actually posted a thread earlier in the week asking for this very thing. Thank you tenacity!
 
Thank you tenacity. I have the TMO code already and have been trying to learn how best to use it for my trading strategy and it's nuances. I was wondering if you could share the code for your RSI Lagg indicator which looks like it turns red and green as it hits the signal lines. Thanks so much!
 
Sure.
See I look for the cross between TMO on current and higher aggregation. This is a good place to look for reversal/change of character
I try to go when lower aggregation matches direction of higher aggregation.
And why I didnt circle (and would ignore) tmo curling up on 5/29 - because weekly TMO was still going down. But 5/6 and 7/17 were perfectly aligned signals . Also on the weekly (right chart) note that presently monthly TMO already curling up. When weekly hits bot and starts aligning up I will be looking for entry ( depending on price action it will be most likely around $40 or $35)
Thanks so much skynetgen! This is very helpful!
 
Thank you tenacity. I have the TMO code already and have been trying to learn how best to use it for my trading strategy and it's nuances. I was wondering if you could share the code for your RSI Lagg indicator which looks like it turns red and green as it hits the signal lines. Thanks so much!

OOPS!! Too focused on TMO sorry.
Here's the code

## OneNote Archive Name: RSI_L_WithFE_AutoAdj_v01_07_2019_JQ
## Archive Section:
## Suggested Tos Name: RSI_L_WithFE_AutoAdj_v01_07_2019_JQ
## Archive Date: 1.07.2017
## Archive Notes:

## "##" indicates an addition or adjustment by JQ

## Modified Code Follows
## 5.15.2018 JQ added code to permit user to disable bull and or bear alerts
## 5.19.2018 JQ added AddChartBubbble code on FE plot
## 9.19.2018 JQ added color to RSI Line
## 10.9.2018 JQ added FE dots
## 10.12.2018 JQ added takevaluecolor statements
## 10.12.2018 Mobius contributed recursion example for addchartbubble code
## 10.13.2018 Nube contributed additional addchart bubble code which was easier for JQ to understand. I need to learn compoundValue.
## 1/07.2019 JQ removed dots indicating non-linearity and painted the Linearity Dots to only appear on the approprite side of the indicator

# RSI in Laguerre Time Self Adjusting With Fractal Energy
# Mobius
# V03.06.15.2016
# Both Fractal Energy and RSI are plotted. RSI in cyan and FE in yellow. Look for trend exhaustion in the FE and a reversal of RSI or Price compression in FE and an RSI reversal.

## Lounge Notes
#15:51 Mobius©: Short trade setup I look for with RSI Laguerre adjusted with FE.
#1) Polarity Change - Equity has gone from making higher highs and higher lows to making a lower high and lower low and is now putting in another lower high
#2) RSI Laguerrer is above .8 and descending from 1
#3) Fractal Energy is below .38 and nose down or above .6 and rolling over. In the first case, below .38, FE is indicating trend exahustion and RSI is likely showing as a peak and not running across pegged at 1. In the second case Price has risen to a lower resistance and has been rolling slowly over building energy.

#Mobius©: I use a very simple method – RSI Laguerre and Fractal Energy on a list of very liquid stocks. I look for polarity change and trade when both RSI and FE are in “confluence”. If volatility is high enough I sell spreads if not I buy them. Other than hedging (which I do a lot of) that's it. I like it simple.

#The typical base setting I like to use for the FE is a length of 8. If I'm trading options I like to look at it about the length of time I'm buying or selling the option for. I want to know if it's reverting and where the energy is so I'll use a longer length for reversion and a shorter length to see if energy is building or waning.

#If RSI Laguerre is descending and FE over .6, that tells me something is changing and I'm already looking at an equity I've determined is about to make a polarity change. So the worse case that happens is that the security grinds sideways for a few days.

#A reading of the FE over .6 is an indication that energy has been built up. If the FE is high (over .6) and RSI LaGuerre is breaking lower FE will follow suit. If RSI reverses and goes above .8 I'm outa there, with the assumption I have a short position.

#FE is a gauge of both mean reverting and linearity. Descending readings indicate a trend is on. A reading below .3 indicates exhaustion in trend or near exhaustion. A reading above .6 indicates moving sideways with rapid reversion and energy building for a move again.

#Above .6 - Think price compression or squeeze
#Below .3 - Think running out of gas

# Here's an example:
#FE at 60 periods is oscillating around .5 tightly while FE at 8 periods is over .6. Zscore is over 2 and is starting to roll over. That is a good short to the mean.

#Short trade setup I look for with RSI Laguerre adjusted with FE.

#1) Polarity Change - Equity has gone from making higher highs and higher lows to making a lower high and lower low and is now putting in another lower high

#2) RSI Laguerrer is above .8 and descending from 1

#3) Fractal Energy is below .38 and nose down or above .6 and rolling over. In the first case, below .38, FE is indicating trend exahustion and RSI is likely showing as a peak and not running across pegged at 1. In the second case price has risen to a lower resistance and has been rolling slowly over building energy.


declare lower;

#Inputs:
input nFE = 13;#hint nFE: length for Fractal Energy calculation.
input RSI_BullishTrigger = .1;
input RSI_BearishTrigger = .9;
input valueFElinear = .382;
input valueFEnonlinear = 0.618;
input soundBullAlerts = no; ## 5.15.2018 new code
input soundBearAlerts = no; ## 5.15.2018 new code

# Variables:
def o;
def h;
def l;
def c;
def CU1;
def CU2;
def CU;
def CD1;
def CD2;
def CD;
def L0;
def L1;
def L2;
def L3;
plot RSI;
plot OS;
plot OB;

# Calculations
o = (open + close[1]) / 2;
h = Max(high, close[1]);
l = Min(low, close[1]);
c = (o + h + l + close) / 4;

#Self adjusting Gamma code
plot gamma = Log(Sum((Max(high, close[1]) - Min(low, close[1])), nFE) /
(Highest(high, nFE) - Lowest(low, nFE)))
/ Log(nFE);
gamma.SetDefaultColor(Color.YELLOW);
gamma.hide();


L0 = (1 – gamma) * c + gamma * L0[1];
L1 = -gamma * L0 + L0[1] + gamma * L1[1];
L2 = -gamma * L1 + L1[1] + gamma * L2[1];
L3 = -gamma * L2 + L2[1] + gamma * L3[1];

if L0 >= L1
then {
CU1 = L0 - L1;
CD1 = 0;
} else {
CD1 = L1 - L0;
CU1 = 0;
}

if L1 >= L2
then {
CU2 = CU1 + L1 - L2;
CD2 = CD1;
} else {
CD2 = CD1 + L2 - L1;
CU2 = CU1;
}

if L2 >= L3
then {
CU = CU2 + L2 - L3;
CD = CD2;
} else {
CU = CU2;
CD = CD2 + L3 - L2;
}

RSI = if CU + CD <> 0 then CU / (CU + CD) else 0;

# RSI.SetDefaultColor(Color.Cyan); #JQ mobius oiginal code
# RSI Painting code by JQ 2018.07.30
RSI.AssignValueColor(
if (RSI > RSI_BearishTrigger) or ((RSI >= RSI[1]) and (RSI > RSI_BullishTrigger))
then Color.GREEN
else if (RSI < RSI_BullishTrigger) or ((RSI < RSI[1]) and (RSI < RSI_BearishTrigger))
then Color.RED
else Color.WHITE);
RSI.SetLineWeight(2);

# Plot fixed value horizontal lines
OS = if IsNaN(close) then Double.NaN else 0.2;
OS.SetDefaultColor(Color.GRAY);
OS.HideBubble();
OS.HideTitle();
OB = if IsNaN(close) then Double.NaN else 0.8;
OB.SetDefaultColor(Color.GRAY);
OB.HideBubble();
OB.HideTitle();
plot FEh = if IsNaN(close) then Double.NaN else .618;
FEh.SetStyle(Curve.LONG_DASH);
FEh.HideBubble();
FEh.SetDefaultColor(Color.DARK_GRAY);
FEh.HideTitle();
plot FEl = if IsNaN(close) then Double.NaN else .382;
FEl.SetStyle(Curve.LONG_DASH);
FEl.SetDefaultColor(Color.DARK_GRAY);
FEl.HideBubble();
FEl.HideTitle();
AddCloud(0, OS, Color.GREEN, Color.GREEN);
AddCloud(OB, 1, Color.RED, Color.RED);
Alert(soundBearAlerts and RSI crosses below .9, "", Alert.BAR, Sound.Ding); ## 5.15.2018 JQ added Boolean
Alert(soundBullAlerts and RSI crosses above .1, "", Alert.BAR, Sound.Ding) ;## 5.15.2018 JQ added Boolean

# Labels below added by Johnny Quotron based on zztop notes above 2018-04-11

def FE = gamma;
#addlabel (FE < .382, " FE is Linear (Price Trending) = " + FE, Color.light_GREEN);
#addlabel (FE > .618, " FE is Non-Linear/Random (Trendless) = " + FE, Color.Light_GRAY);
#addlabel (FE <= .618 and FE >= .382, " FE is transitioning = " + FE, Color.Light_orange);
#AddChartBubble(!IsNaN(close) and IsNaN(close[-1]), FE, if FE < .382 then "Trending" else "Not Trending", Color.WHITE, yes);
#AddChartBubble(!IsNaN(close) and IsNaN(close[-1]), FE, if FE < .382 then "Trending" else if FE < .618 then "Transitioning" else "Building Energy", gamma.#takeValueColor(), yes); ## 5.19.2018 JQ

# End Code RSI_Laguerre Self Adjusting with Fractal Energy


# Fractal Linear Energy
# Mobius
# 5.16.2016
# zztop Notes

# This indicator does NOT indicate OB or OS but linear or non-linear
# The closer to 1 the more non-linear (compressed or random) price is.
# The closer to 0 the more linear (trending) price is.

# Fractal Energy isn't an indicator - it's a way of looking at price
# to see if it's linear or random. There are NO trading signals on the
# FE study. Only signals NOT to trade.
#
# If the FE is at extremes, something is about to change. It's leading
# you to a conclusion. If the FE is below .382, price is parabolic and
# cannot maintain that. But you may not want to sell because it may
# still go further in it's trend and it may not change direction right
# away. It's telling you though that it's not going to stay trending
# at the current rate of speed. If it's over .618 it telling you price
# is compressing and going sideways rebuilding energy getting ready for
# another run one way ot the other.
#
# Using price in fractals and different times, or ORB with FE and
# supertrend or some way to measure when price expansion is contracting
# or expanding is all you need. Any more than that and you'll be
# paralyzed by information overload
#
# FE does not indicate direction at all. It simply shows linearity or
# non-linearity. Trend or non-trend. It has nothing that determines
# which way trend is going, as in up or down.
#
# Lets say you want to buy ABC company. FE on a monthly, weekly and daily
# shows values of 40, 35 and 30. Price is showing lower lows but random
# lower high. You would know ABC company is close to selling exhaustion
# and it's time to look for a few higher highs to a near term fractal
# pivot then look for short reversal to a higher low over the previous
# recent low and when the bars start setting high highs and lower lows
# again it's time to go long. The FE is what tells you to start looking
# for those signals

def dot_nFE = nFE;


# dot plots
plot pointsLinear = if FE < valueFElinear and RSI < .5
then -.05
else Double.NaN;
pointsLinear.SetPaintingStrategy(PaintingStrategy.POINTS);
pointsLinear.SetLineWeight(2);
pointsLinear.SetDefaultColor(Color.CYAN);

plot BigpointsLinear = if FE < valueFElinear *.90 and RSI < .5
then -.05
else Double.NaN;
BigpointsLinear.SetPaintingStrategy(PaintingStrategy.POINTS);
BigpointsLinear.SetLineWeight(5);
BigpointsLinear.SetDefaultColor(Color.CYAN);

plot pointsLinear2 = if FE < valueFElinear and RSI > .5
then 1.05
else Double.NaN;
pointsLinear2.SetPaintingStrategy(PaintingStrategy.POINTS);
pointsLinear2.SetLineWeight(2);
pointsLinear2.AssignValueColor(pointsLinear.TakeValueColor());

plot BigpointsLinear2 = if FE < valueFElinear * .90 and RSI > .5
then 1.05
else Double.NaN;
BigpointsLinear2.SetPaintingStrategy(PaintingStrategy.POINTS);
BigpointsLinear2.SetLineWeight(5);
BigpointsLinear2.AssignValueColor(pointsLinear.TakeValueColor());

#plot pointsNonLinear = if FE > valueFEnonlinear
# then -.05
# else Double.NaN;
#pointsNonLinear.SetPaintingStrategy(PaintingStrategy.POINTS);
#pointsNonLinear.SetLineWeight(2);
#pointsNonLinear.SetDefaultColor(Color.ORANGE);

#plot BigpointsNonLinear = if FE > (valueFEnonlinear * 1.03)
# then -.05
# else Double.NaN;
#BigpointsNonLinear.SetPaintingStrategy(PaintingStrategy.POINTS);
#BigpointsNonLinear.SetLineWeight(5);
#BigpointsNonLinear.SetDefaultColor(Color.ORANGE);

#plot pointsNonLinear2 = if FE > valueFEnonlinear
# then 1.05
# else Double.NaN;
#pointsNonLinear2.SetPaintingStrategy(PaintingStrategy.POINTS);
#pointsNonLinear2.SetLineWeight(2);
#pointsNonLinear2.AssignValueColor(pointsNonLinear.TakeValueColor());

#plot BigpointsNonLinear2 = if FE > (valueFEnonlinear * 1.03)
# then 1.05
# else Double.NaN;
#BigpointsNonLinear2.SetPaintingStrategy(PaintingStrategy.POINTS);
#BigpointsNonLinear2.SetLineWeight(5);
#BigpointsNonLinear2.AssignValueColor(pointsNonLinear.TakeValueColor());


# Mobius Chatroom Code
#def count1 = if barNumber() > 1 and FE < valueFElinear
# then compoundValue(1, count1[1] + 1, 1)
# else count1[1];
#addChartBubble(count1 == 1, 0, "Linear", color.cyan, yes);

#Mobius Bubble Code
#def count1 = if barNumber() > 1 and FE < valueFElinear
# then compoundValue(1, count1[1] + 1, 1)
# else count1[1];
#addChartBubble(count1 == 1, -0.05, "Linear -\nTrend Exhaustion", color.cyan, yes); #works fine JQ

#def count2 = if barNumber() > 1 and FE > valueFENonlinear
# then compoundValue(1, count2[1] + 1, 1)
# else count2[1];
#addChartBubble(count2 == 1, -0.05, " Non-Linear -\nRange Compression", color.orange, yes); #paints 2 bubbles. No idea why. JQ


# Nube bubble Code
#def linear = CompoundValue(1,
# if FE crosses below valueFElinear
# then 1
# else if FE crosses above valueFELinear
# then -1
# else linear[1], -1);
#def nonLinear = CompoundValue(1,
# if FE crosses above valueFENonlinear
# then 1
# else if FE crosses below valueFENonlinear
# then -1
# else nonLinear[1], -1);

#addChartBubble(linear crosses above 0, .2, "Linear - Trend Exhaustion", CreateColor(225,225,125)); # Places bubble where FE drops below exhaustion trigger
#addChartBubble(nonLinear crosses above 0, .2, "Non-Linear - Range Compression", Color.Pink); # places bubble where FE rises above compression trigger


# Nube Bubble Code #2
def bn = BarNumber();
def na = Double.NaN;
def linearBar = if FE < valueFElinear
then bn else na;
def NonLinearBar = if FE > valueFENonLinear
then bn else na;

addChartBubble(bn == LowestAll(linearBar), -.02, "Linear - " + valueFElinear + "\nTrend Exhaustion", Color.Cyan);
#addChartBubble(bn == LowestAll(NonLinearBar), -.02, "Non-Linear - " + valueFEnonlinear + "\nRange Compression", Color.Orange);

# JQ Bubble Code
#addChartBubble(BarNumber() == 1, -0.05, "Trend Exhaustion", pointslinear.takevaluecolor()); #places bubble at first bar JQ
#addChartBubble(BarNumber() == 1, -0.05, "Price Compression",pointsNonLinear.takevaluecolor()); #places bubble at first bar JQ

#addChartBubble( if FE == LowestAll(FE) then 1 else 0 , -0.05, "Trend Exhaustion", pointslinear.takevaluecolor()); #places bubble at LowestAll(FE) JQ
#AddChartBubble( if FE == HighestAll(FE) then 1 else 0 , -0.05, "Price Compression", pointsNonLinear.TakeValueColor()); # places bubble at HighestAll(FE) JQ


# JQ Label Code
#addlabel(1,"valueFELinear: " + valueFElinear, color.WHITE);
#addlabel(1,"valueFENonLinear: " + valueFEnonlinear, color.WHITE);
#addlabel(1,"count1: " + count1, color.WHITE);
#addlabel(1,"count2: " + count2, color.WHITE);


# End of Fractal Linear Energy Dot Code
 
Thank you tenacity. I have the TMO code already and have been trying to learn how best to use it for my trading strategy and it's nuances. I was wondering if you could share the code for your RSI Lagg indicator which looks like it turns red and green as it hits the signal lines. Thanks so much!
@David45 That RSILg is from JohhnyQuotron, he is the keeper of the Onenote. It's in there. Look for Tab#14 JQ's Workbench.
https://usethinkscript.com/threads/the-universe-of-thinkscript-your-one-stop-research-shop.300/
 
Last edited:
If you are perplexed about the difference between RSI Laguerre with time adjusting Fractal Energy and TMO, here's a way for a quick comparison:

Put both studies on your lower chart AND Drag one into the same box with the other. Boom, Done!
 
Tried to show a comparison of signals that might be used by three different momentum studies. Gray squares possible trades. Cyan circles possible false signals. Just highlighting the main signal line so you can decide yourself how the FE or MTF might influence a trade decision.

2019-11-22-TOS-CHARTS2.png
 
Is their a way to make the RSI Laguerre and True Momentum indicators to coincide with one another to further confirm each other ? Ive noticed that the True momentum will move a step ahead of RSI Laguerre . Its not a huge deal but if they moved more in unison I feel they would confirm one another.
 
Thread starter Similar threads Forum Replies Date
markos RSI in Laguerre Time Self Adjusting With Fractal Energy Usage Notes Tutorials 76

Similar threads

Not the exact question you're looking for?

Start a new thread and receive assistance from our community.

87k+ Posts
513 Online
Create Post

Similar threads

Similar threads

The Market Trading Game Changer

Join 2,500+ subscribers inside the useThinkScript VIP Membership Club
  • Exclusive indicators
  • Proven strategies & setups
  • Private Discord community
  • ‘Buy The Dip’ signal alerts
  • Exclusive members-only content
  • Add-ons and resources
  • 1 full year of unlimited support

Frequently Asked Questions

What is useThinkScript?

useThinkScript is the #1 community of stock market investors using indicators and other tools to power their trading strategies. Traders of all skill levels use our forums to learn about scripting and indicators, help each other, and discover new ways to gain an edge in the markets.

How do I get started?

We get it. Our forum can be intimidating, if not overwhelming. With thousands of topics, tens of thousands of posts, our community has created an incredibly deep knowledge base for stock traders. No one can ever exhaust every resource provided on our site.

If you are new, or just looking for guidance, here are some helpful links to get you started.

What are the benefits of VIP Membership?
VIP members get exclusive access to these proven and tested premium indicators: Buy the Dip, Advanced Market Moves 2.0, Take Profit, and Volatility Trading Range. In addition, VIP members get access to over 50 VIP-only custom indicators, add-ons, and strategies, private VIP-only forums, private Discord channel to discuss trades and strategies in real-time, customer support, trade alerts, and much more. Learn all about VIP membership here.
How can I access the premium indicators?
To access the premium indicators, which are plug and play ready, sign up for VIP membership here.
Back
Top