ThinkScript Alert and Plot Statement.

JoseManuel

New member
Plus
New to the forum and to TOS.
So pardon my ignorance.
First question.
In coding ThinkScript how does one code for conditional groups, All of the following, None of the following , Any of the following..or sort of exclusions..
Second question.
The Alert Stament, ex Alert.ONCE has a text and sound..Where is the text displayed?. In the message center Or how do I send a message to myself (if condition triggers) to display in my message center.
Final question.
I wrote a Script and it displays a triangular yellow signal similar to yield sign with exclamation. It states "complex script you may experience greater load times"
I went through the whole Script and it is related to the Calculation of the Fibonacci expansion.
My question is
Does THINKSCRIPT have the ability to call like another Script wherein I can Calculate the Fibonacci expansion and just call it when needed?
How do to do it?
 
I am new to forum , and to ThinkScript.
I wrote a Script for a Custom Column.
Essentially the Script tells me when SMA crosses below EMA and the Close is above Fibonacci line 2.
This is def as Cond1.
Plot Scan = Cond1 gives either 0/1.
But my Alert(Cond1," ",Alert.Bar,Sound.Ring);
does not work.
What am I doing wrong?
Otherwise I have to look at the columns for 0/1.
 
I am new to the forum and to ThinkScript..
I have a custom column on my portfolio watchlist.
The Script places either a 0.0 or 1 in the Stock Ticker Symbol column for the Script.
A One (1.0) the the Conditions are True, 0.0 False.
I have been unable to get a sound alert from the Script.
The Script
Cond 1= (Cosses(Sma1,Ema1).CrossingDirection.BELOW) and Close > Fibo1 ;
plot Scan = Cond1 ;

Alert ( Cond1 == 1 and Cond1[1] !=1,"Sell Now_15_Min",Alert.BAR,Sound.RING);
Does not work.
Also tried
def test1 = if Cond1 > Cond1[1] then Cond1 else Double.NaN;
Input alertOn = yes;
Alert( alert On and !IsNaN(test1) and IsNaN(test1[1]),"Sell Now",Alert.BAR,Sound.RING);

Thanks for your Help

Thank you for your reply...Does it support adding Labels?
(AddLabel.BooleanArrow.Down),etc..

Sorry, I thinkbookstores. Not express myself correctly..I meant to ask if the AddLabel statement within a watchlist custom column Script could possible add a down arrow to the corresponding ticker Symbol chart since it does not provide a sound alert.
Thank you So much for your patience I am trying to learn ThinkScript and as far as I know there are no books.
Any suggested reading??
No, the watchlists are for numbers
No, graphics such as arrows are not supported.
Yes, you can make a text with the words "down" or any other words that you want.
It is not 'standard'. Generally, a bright red or bright lime or any other background color is used to visually alert.

Numbers in the columns are preferred as they are sortable.
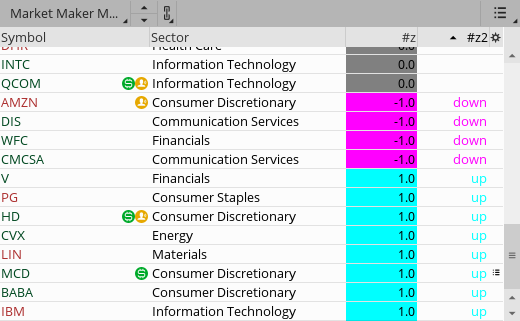
Here are two examples. One uses words, one with numbers
No, suggested reading for ThinkScript.
Most of us, learned by following examples posted on the forum.
Here is how to search the forum:
https://usethinkscript.com/threads/search-the-forum.12626/
0G3CNPR.png

Here is an example of a numerical column:
Ruby:
plot Cond1= if close crosses above expAverage(close,9) within 3 bars then 1 else
            if close crosses below expAverage(close,9)  within 3 bars then -1 else 0;

AssignBackgroundColor(
if cond1==1 then Color.CYAN else
if cond1==-1 then Color.MAGENTA else color.gray);
A text column:
Ruby:
def Cond1= if close crosses above expAverage(close,9) within 3 bars then 1 else
            if close crosses below expAverage(close,9)  within 3 bars then -1 else 0;

addlabel(yes,
if cond1==1 then "up" else
if cond1==-1 then "down" else " ",
if cond1==1 then Color.CYAN else
if cond1==-1 then Color.MAGENTA else color.gray);
 
Last edited:
New to the forum and to TOS.
So pardon my ignorance.
First question.
In coding ThinkScript how does one code for conditional groups, All of the following, None of the following , Any of the following..or sort of exclusions..
Second question.
The Alert Stament, ex Alert.ONCE has a text and sound..Where is the text displayed?. In the message center Or how do I send a message to myself (if condition triggers) to display in my message center.
Final question.
I wrote a Script and it displays a triangular yellow signal similar to yield sign with exclamation. It states "complex script you may experience greater load times"
I went through the whole Script and it is related to the Calculation of the Fibonacci expansion.
My question is
Does THINKSCRIPT have the ability to call like another Script wherein I can Calculate the Fibonacci expansion and just call it when needed?
How do to do it?

i took fortran in college, a long time ago,... never used it.

load this study to see some examples to answer your questions

Code:
#Qs_cond_alert_

#https://usethinkscript.com/threads/thinkscript-alert-and-plot-statement.17983/
#ThinkScript Alert and Plot Statement.
#JoseManuel  Feb 17, 2024

#First question.
#In coding ThinkScript how does one code for conditional groups, All of the following, None of the following , Any of the following..or sort of exclusions..

#Second question.
#The Alert Stament, ex Alert.ONCE has a text and sound..Where is the text displayed?. In the message center Or how do I send a message to myself (if condition triggers) to display in my message center.

#Final question.
#I wrote a Script and it displays a triangular yellow signal similar to yield sign with exclamation. It states "complex script you may experience greater load times"
#I went through the whole Script and it is related to the Calculation of the Fibonacci expansion.

#My question is
#Does THINKSCRIPT have the ability to call like another Script wherein I can Calculate the Fibonacci expansion and just call it when needed?
#How do to do it?


#1.  All of the following,
# join conditions with AND.
# this will be true ( equal to 1 ) when all 3 conditions are true
def bn = BarNumber();
def a = 2;
def b = 4;
def c = 6;
def r = (a == 2) and (b == 4) and (c == 6);
addlabel(1, "R " + r, color.yellow);


# None of the following ,
# true when any condition doesn't match  (c)
def s = (a != 2) or (b != 4) or (c != 7);
addlabel(1, "S " + s, color.yellow);


# Any of the following
# true when any condition is true  (b)
def T = (a == 2) or (b == 11) or (c == 6);
addlabel(1, "T " + t, color.yellow);


#..or sort of exclusions..  ?
# define a range of numbers. put ! infront of it to inverse the logic value
# true when b is not in the range
def u = !(b > 1 and b < 3);
addlabel(1, "U " + u, color.yellow);


#2. alerts


#3. call another study ?
# yes , if it is a built in study. custom studies can't be referenced by other studies.

# functions
# functions exist so you don't have to create the code to do common tasks.  like highest()
# can specify data to be used as input parameters to a function
# you can look up the function to know what the inputs are
input price1 = high;
input length1 = 10;
def h = highest(price1, length1);
addchartbubble(1, low*0.998,
"highest\n" +
"in past\n" + length1 + " bars\n" +
h
, color.yellow, no);
# \n  starts a new line in a bubble


# built in studies are similar to functions, in that they can referenced in other studies by their name.
# start by searching for the study and looking at the code to see what the input names and types are ( these are the parameters)
# the plots are what sends data out of the called study. when a study is called, it only reads 1 number.

# look at a study and copy the input code lines
# find the desired plot output and use that name at the end of the study name

# MovAvgExponential
input price2 = close;
input length2 = 9;
input displace2 = 0;
input showBreakoutSignals2 = no;
def avg = MovAvgExponential(price = price2, length = length2, displace = displace2, showBreakoutSignals = showBreakoutSignals2).avgexp;
plot z = avg;
#

#as far as fibonacci lines, that is a drawing tool. you can't reference them with thinkscript.
#there are many studies on here that draw fib lines.
#


logic
https://tlc.thinkorswim.com/center/reference/thinkScript/Operators/Logical

alerts
https://usethinkscript.com/threads/questions-about-alerts-in-thinkorswim.337/

highest
https://tlc.thinkorswim.com/center/reference/thinkScript/Functions/Tech-Analysis/Highest

MovAvgExponential
https://tlc.thinkorswim.com/center/reference/Tech-Indicators/studies-library/M-N/MovAvgExponential
 

Join useThinkScript to post your question to a community of 21,000+ developers and traders.

Similar threads

Not the exact question you're looking for?

Start a new thread and receive assistance from our community.

87k+ Posts
404 Online
Create Post

Similar threads

Similar threads

The Market Trading Game Changer

Join 2,500+ subscribers inside the useThinkScript VIP Membership Club
  • Exclusive indicators
  • Proven strategies & setups
  • Private Discord community
  • ‘Buy The Dip’ signal alerts
  • Exclusive members-only content
  • Add-ons and resources
  • 1 full year of unlimited support

Frequently Asked Questions

What is useThinkScript?

useThinkScript is the #1 community of stock market investors using indicators and other tools to power their trading strategies. Traders of all skill levels use our forums to learn about scripting and indicators, help each other, and discover new ways to gain an edge in the markets.

How do I get started?

We get it. Our forum can be intimidating, if not overwhelming. With thousands of topics, tens of thousands of posts, our community has created an incredibly deep knowledge base for stock traders. No one can ever exhaust every resource provided on our site.

If you are new, or just looking for guidance, here are some helpful links to get you started.

What are the benefits of VIP Membership?
VIP members get exclusive access to these proven and tested premium indicators: Buy the Dip, Advanced Market Moves 2.0, Take Profit, and Volatility Trading Range. In addition, VIP members get access to over 50 VIP-only custom indicators, add-ons, and strategies, private VIP-only forums, private Discord channel to discuss trades and strategies in real-time, customer support, trade alerts, and much more. Learn all about VIP membership here.
How can I access the premium indicators?
To access the premium indicators, which are plug and play ready, sign up for VIP membership here.
Back
Top