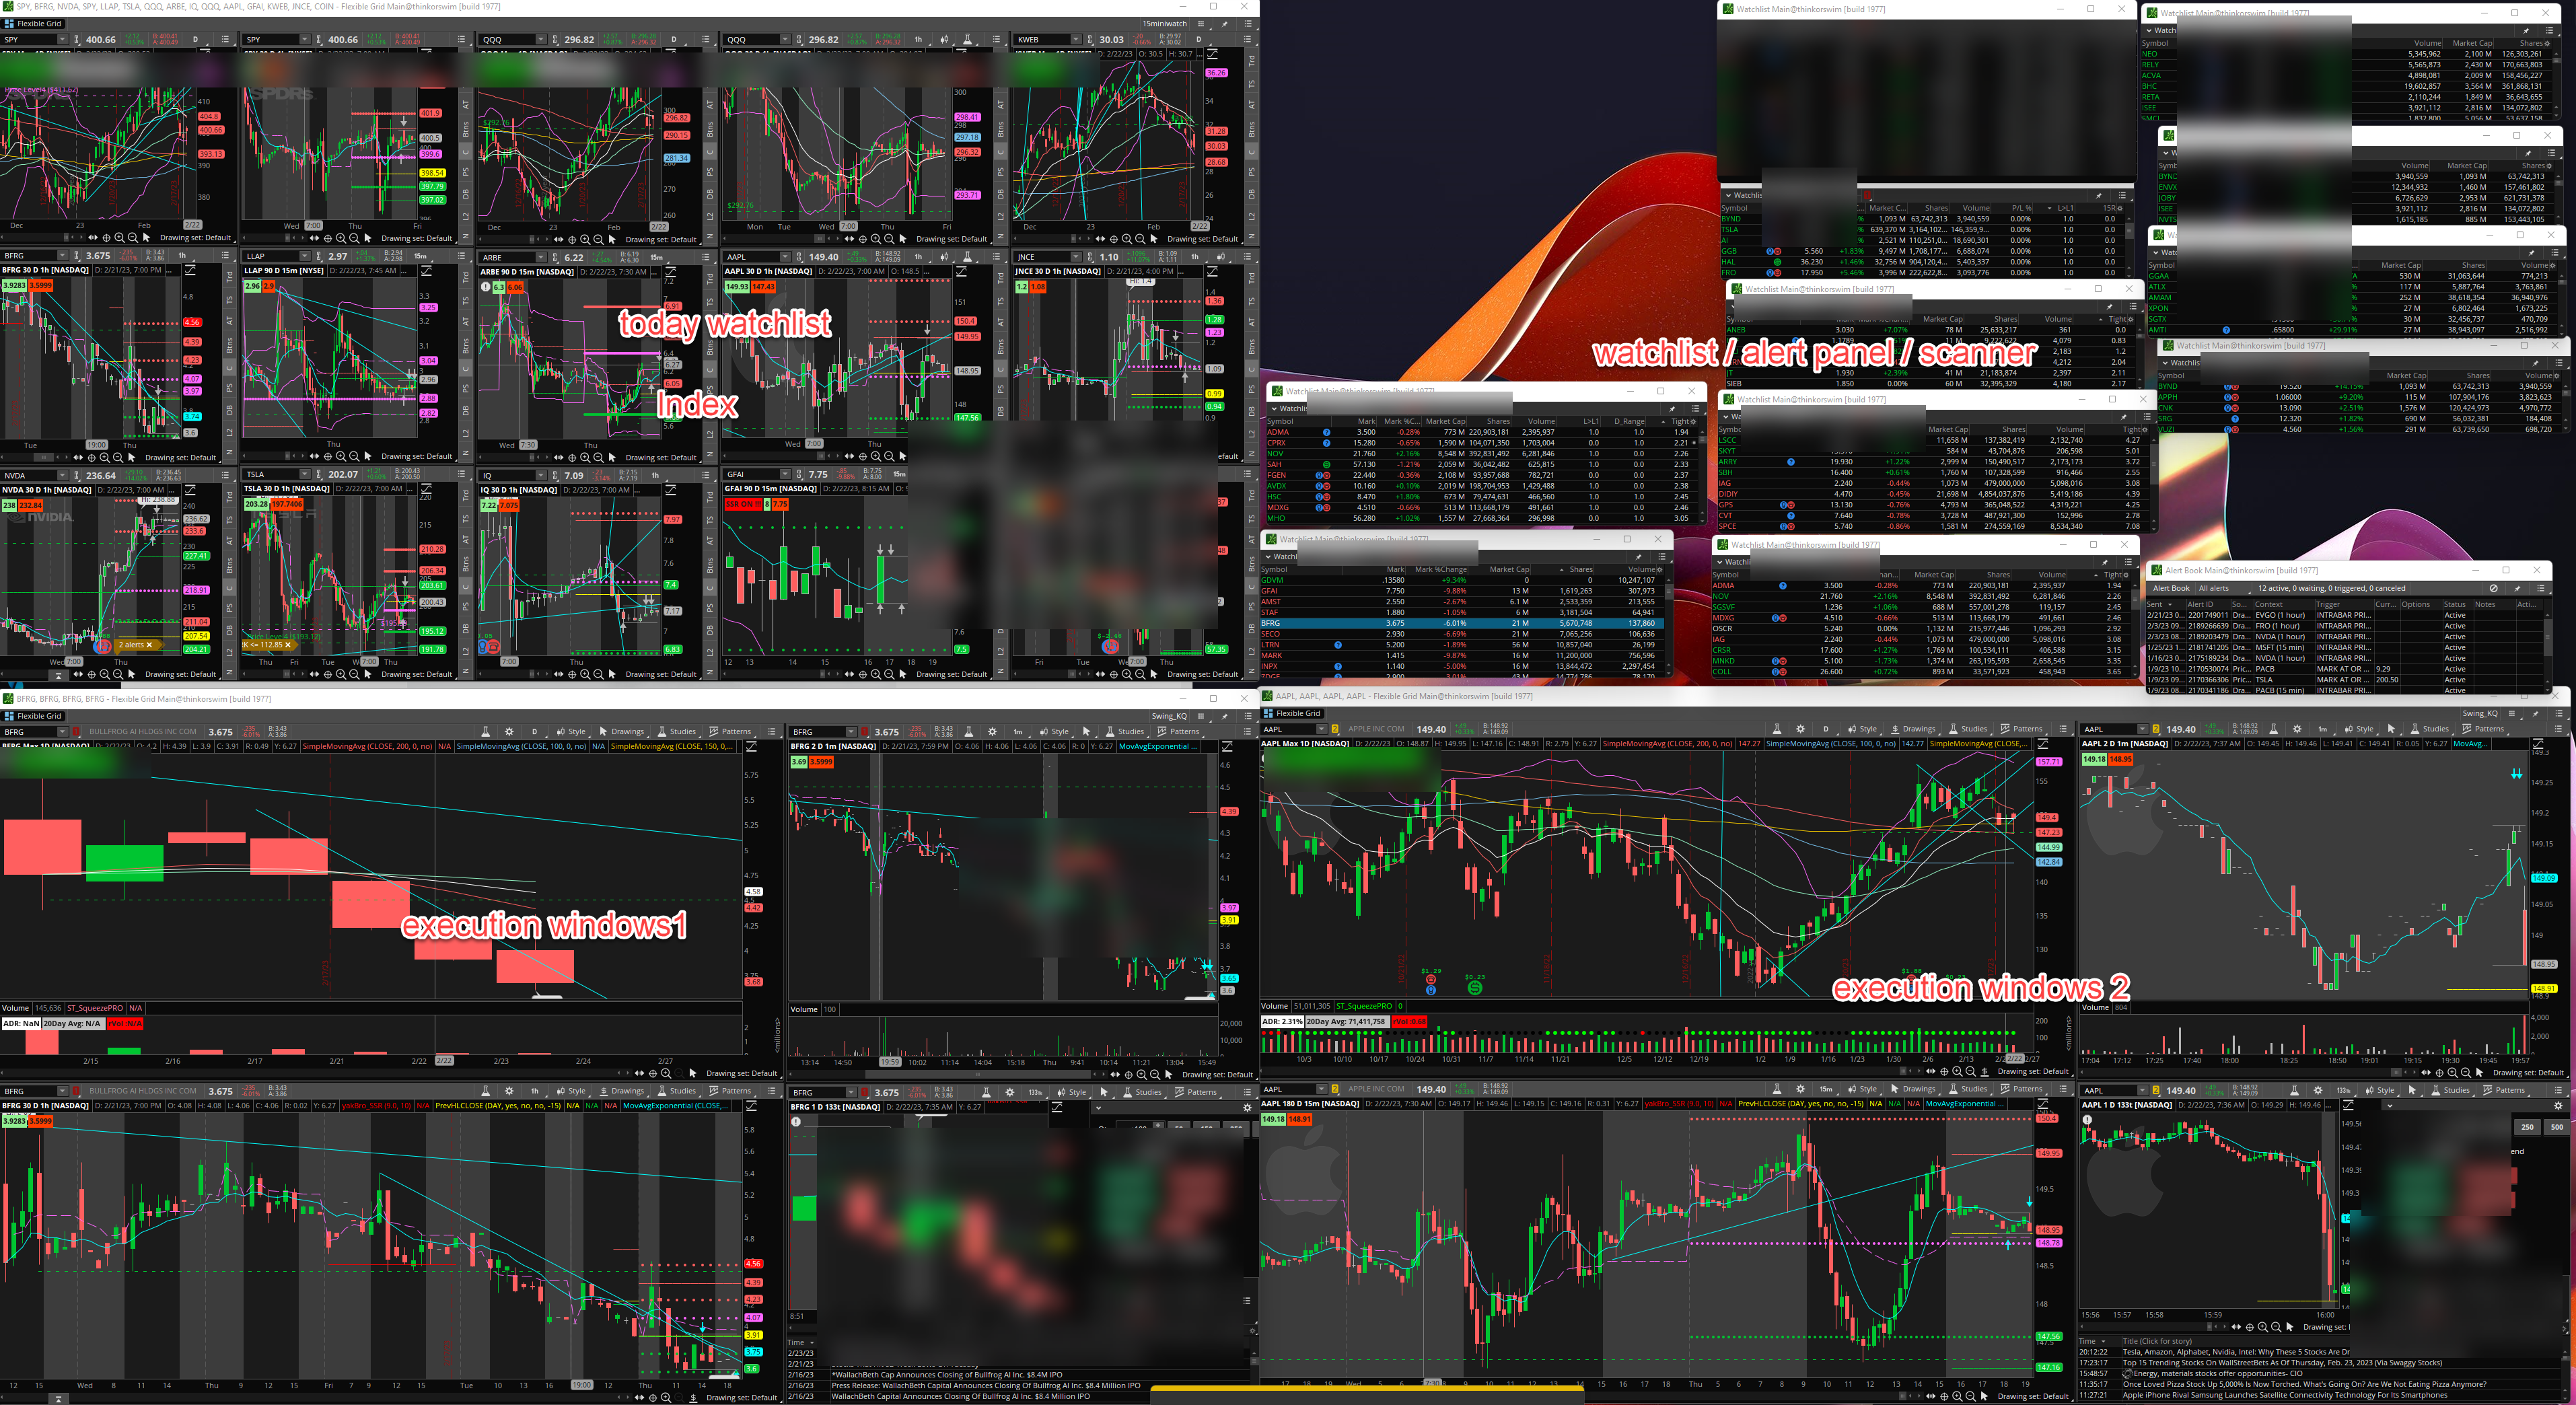
ThinkorSwim App System Lag

A lot of those are the same between the two sources. Some are different keys and some are the same keys with conflicting values. I don't have any insider information to tell us which is really better. I doubt any of them will impact crashing, though. And for modern hardware I doubt any of them really make much difference, though I think the charts look a little less nice with those settings. I actually might put my settings back to the default now the I switched my quote speed from real-time to 1 second.

For the first two, starting with -Xmx and -Xms, those are just how much memory you're allowing TOS. When you set it using the dropdowns in the config menu from the login prompt this is where that gets stored. So it'll be different for everyone depending on what they select there. And the best values for your computer will depend on how much memory your computer has as well as if you're trying to run other memory-hog apps, like TradeStation, at the same time.

For -Dsun.java2d.opengl=false, I believe it's false by default. Meaning if it's not specified in the file it will automatically be false. And the opposite one, -Dsun.java2d.d3d, is true by default. They don't need to exist in the file unless you want to override the defaults. If you're running on Windows you definitely want the default (Direct3D and not OpenGL). Direct3D is a Windows-only thing, though it partially exists in Linux under Wine which is a like a Windows emulator that allows some Windows software to run on Linux. On Mac or Linux I presume these settings will be different.

I had crashing issues at one point with TOS. I was getting occasional blue screens of death also but TOS crashing was by far my most common problem. It turned out one of the sticks of memory in the brand new laptop I bought was no good. Sometimes, after a crash, TOS was somehow corrupted and when I'd launch it the main window would appear but watchlists and charts would never load.

I learned that under C:\Program Files\thinkorswim is a usergui folder that, if you delete it, TOS will just recreate it and download the files it needs again. This also seems to be where patches are downloaded and applied every time you start TOS. After my crashes broke TOS, deleting the usergui folder and letting TOS rebuild it solved that problem. You might want to try that in case it can solve your crashes. I'm guessing it won't but it's easy to try. If you're fearful about deleting it, just rename the folder so you can rename it back. That's what I did the first time.

Secondly, I'd recommend running a memory diagnostic. If you're running Windows 10 there' s a built in tool for that. Just open the Start menu and start typing "memory" and you should see the Windows Memory Diagnostic app. It quickly found my problem running only the basic test but there's more complete and time-consuming tests you can run if the basic test finds nothing. If you're not on Windows 10, you can probably find a free utility for it on the web.
 
I've never seen any benefit in tweaking the vmoptions file manually... I have an older (by todays standards) laptop with about 8 - 9 TOS windows open at all times and each of those has roughly a dozen indicators... Most windows have 3 - 4 panels running... If my system gets slow I click on Help to see what the broadband throughput looks like... If it looks like a jumbled rats nest in the middle of the chart, or goes from top to bottom, then you may have a corrupt chart panel that needs to be deleted and recreated... That is the main culprit for ongoing or repeated performance issues, from my experience... Finding the corrupt chart panel can be a daunting task at times, however...
 
1. Delete all unused custom studies & strategies.
2. Occasionally delete the UserGUI folder in Windows
3. Keep your PC and Windows in good shape and run at least 8GB of RAM ( preferably more) and go with fastest RAM avaliable.

I havn’t had any performance issues in quite a while now. Everything runs smoothly here.
 
Last edited:
Hi folks,

I am new here.

I would like to address TOS performance on my MacBook.

Does anyone know how to run multiple instances of TOS on MacOS?

Thanks!
HedgePlay
 
@HedgePlay By multiple instances, do you mean different accounts running at the same time or different chart screens?
 
@BenTen Thanks for the reply.

I mean launching 2 or 3 instances of TOS at the same time. A method I see posted various places as means to improve TOS performance. On Windows it is easy, just click the TOS icon and login again to open another instance.

I am new to MacOS. I am wondering if there is a way to do the same on my MacBook Pro? Googling around this example of setting separate distinct profiles for Chrome was the closest search result I found but really would like to share the same profile like TOS does on my PC

https://diegocarrasco.com/how-to-rum-multiple-instances-of-google-chrome-on-mac/

HedgePlay
 
not sure if you already used the instructions in the video but I sued number 4 listed from this website: https://www.makeuseof.com/tag/run-multiple-copies-app-mac/

currently running 2 instances. the only gripes I have is that the workspace and if you save anything can sometimes get wonky so if I'm ever modifying scripts or workspaces, I make sure to only use 1 instance.

@eluciano530 Glad you found a viable solution...

I also run into minor issues when doing script modifications between PC's... I rarely run two instances on one machine but do have three systems running most of the time and when I make major edits I logout on the other two systems and login again... I just ran into issues on my three-display two-PC trading station due to forgetting to follow this practice... I tried cutting corners because I just walked in from dropping my truck off for state inspection and sat down a few minutes before the markets opened and it came back to bite me due to lagging and some components not working... I ended up going through the process and everything was back to normal although I did miss out on the morning move I was originally attempting to profit from...

Good luck...
 
I haven't noticed any change in performance except as of late it's getting slower switching symbols after I've had it open for a few hours and run through 100+ symbols, mostly just in a daily chart. Closing/re-opening fixes it. Forcing garbage collection doesn't. This is a fairly new problem.

Additionally, I've had some alerts I set on trendlines shift position when I load the stock into a chart again in a later session. The alert line correctly overlaps the trendline when created but the next time I see it on a different day it has shifted quite far away but at the correct angle. All on the same 1Y 1D chart.
 
My windows desktop processor is C2Q Q9400 and 4GB ram.
It runs smooth as silk. You really don't need a super fast processor and huge ram.
Here's my thinkorswim.vmoptions file entries:

-Xms256m
-Xmx1536m
-Djava.util.Arrays.useLegacyMergeSort=true
-Djava.net.preferIPv4stack=true
-Dsun.net.http.allowRestrictedHeaders=true
-Djxbrowser.logging.level=INFO
-Dsun.java2d.uiScale.enabled=false
-Dsun.java2d.xrender=False
-Dsun.java2d.noddraw=true
-Dsun.java2d.d3d=false
-XX:-UseConcMarkSweepGC
-Dsun.awt.disableMixing=true
-Dawt.useSystemAAFontSettings=lcd_hrgb
-classpath/p launcher-first.jar
-XX:MaxPermSize=256m

Hope this fixes the lag in your TOS.
 
Last edited:
My windows desktop processor is C2Q Q9400 and 4GB ram.
It runs smooth as silk. You really don't need a super fast processor and huge ram.
Here's my thinkorswim.vmoptions file entries:

-Xms256m
-Xmx1536m
-Djava.util.Arrays.useLegacyMergeSort=true
-Classpath/p launcher-first.jar
-Djava.net.preferIPv4stack=true
-Dsun.net.http.allowRestrictedHeaders=true
-Djxbrowser.logging.level=INFO
-Dsun.java2d.uiScale.enabled=false
-Dsun.java2d.xrender=False
-Dsun.java2d.noddraw=true
-Dsun.java2d.d3d=false
-XX:-UseConcMarkSweepGC
-Dsun.awt.disableMixing=true
-Dawt.useSystemAAFontSettings=lcd_hrgb
-classpath/p launcher-first.jar
-XX:MaxPermSize=256m

Hope this fixes the lag in your TOS.

We've already discussed that the settings in vmoptions have little to no impact.

Your memory settings (the first two settings at the top of the file) are very low which makes sense for your 4GB machine. It's not helpful for anyone with more memory to copy that.

The processing power and memory needed to run TOS smoothly varies widely based on a lot of factors. TOS needs more power while the market is open than off hours because data is constantly updating. High volume symbols require more than lower volume. Number of charts on screen, number of studies on those charts and number of plots drawn by those studies. Lower timeframes use more resources than higher. Number of secondary timeframes accessed by studies. More watchlists, Active Trader windows and other such things on the screen all require more resources. OnDemand is additionally taxing. There's a setting in Application Settings -> System called Quote speed which controls how fast TOS attempts to update everything on screen with new data and this setting has a big impact on performance during market hours. The less delay between updates the more processing power is needed.

Your machine for my trading, since I switched to swing trading and primarily trade outside of market hours, would probably work fine. For my workspace when I was day trading even my expensive Razer Blade 15 2019 Advanced gaming laptop was a little sluggish with the quote speed set to real-time. Your machine would likely be unusable.

My experience does point to desktop hardware having an advantage, though. Back in 2015 I bought a 2015 Lenovo desktop with a high-end (for 2015) CPU and I can't remember if it's 8GB or 16GB. I added a GeForce 1080 to make it an entertainment PC (gaming, home theater) connected to my big screen TV and surround sound system. TOS performs better on that than on my much newer and more expensive laptop even though benchmarks I ran show the laptop is faster. It probably comes down to single-core CPU performance for reasons we've already discussed in this thread.
 
TOS, being a Java based app the Swing UI, can't scale more than one single core, for TOS it's not the number of cores how much Ghz a single core can do. Find a CPU with bigger Ghz, and good Turbo Boost.

alternative to that run more that one instance of TOS, with each instance with a different Workspace and split your indicators between them.

I run 3 - 4 instances on my Ryzen 5800-X, 1 instance with a total of 6 Grids across 3 windows, 2nd instance a 16 Grid with different tickers and same set of indicators, 3rd mostly for scanners, give or take about 6 - 8 different scanners, 4th instance just news and cnbc videos.

Apart from this I run a bunch of other apps, like chrome browsers, etrade and TW.

-s
 
We've already discussed that the settings in vmoptions have little to no impact.

Your memory settings (the first two settings at the top of the file) are very low which makes sense for your 4GB machine. It's not helpful for anyone with more memory to copy that.

The processing power and memory needed to run TOS smoothly varies widely based on a lot of factors. TOS needs more power while the market is open than off hours because data is constantly updating. High volume symbols require more than lower volume. Number of charts on screen, number of studies on those charts and number of plots drawn by those studies. Lower timeframes use more resources than higher. Number of secondary timeframes accessed by studies. More watchlists, Active Trader windows and other such things on the screen all require more resources. OnDemand is additionally taxing. There's a setting in Application Settings -> System called Quote speed which controls how fast TOS attempts to update everything on screen with new data and this setting has a big impact on performance during market hours. The less delay between updates the more processing power is needed.

Your machine for my trading, since I switched to swing trading and primarily trade outside of market hours, would probably work fine. For my workspace when I was day trading even my expensive Razer Blade 15 2019 Advanced gaming laptop was a little sluggish with the quote speed set to real-time. Your machine would likely be unusable.

My experience does point to desktop hardware having an advantage, though. Back in 2015 I bought a 2015 Lenovo desktop with a high-end (for 2015) CPU and I can't remember if it's 8GB or 16GB. I added a GeForce 1080 to make it an entertainment PC (gaming, home theater) connected to my big screen TV and surround sound system. TOS performs better on that than on my much newer and more expensive laptop even though benchmarks I ran show the laptop is faster. It probably comes down to single-core CPU performance for reasons we've already discussed in this thread.
Sure top of the line hardware is preferable, as I mentioned in my post my machine runs smooth as silk; meaning I am not seeing any lag at all even with several windows detached and some 10 charts open concurrently with @6 Indicators/studies per chart. Whereas, before I edited my vmoptions file I was experiencing horrendous lag. So I assume the huge improvement must have been because of the edit on the vmoptions settings. Just saying.
 
Sure top of the line hardware is preferable, as I mentioned in my post my machine runs smooth as silk; meaning I am not seeing any lag at all even with several windows detached and some 10 charts open concurrently with @6 Indicators/studies per chart. Whereas, before I edited my vmoptions file I was experiencing horrendous lag. So I assume the huge improvement must have been because of the edit on the vmoptions settings. Just saying.

I'm glad to hear those settings improved your experience. Perhaps some people reading are also using older machines and can benefit. With 4GB of RAM, I'm guessing your hardware may be from the same time period when those settings first appeared online so it makes sense you'd see some benefit. It may also help people to know, which operating system are you running?

All of your settings, except uiScale, were discussed on page 1 of this thread and those of us who tried these settings, and in my case some others from various online sources, on newer and reasonably powerful hardware found no detectable benefit. Either they aren't relevant on modern hardware or uiScale is the one that makes a difference.
O OK, Desktop PC processor C2Q Q9400, RAM 4gb, GPU 2gb, OS Windows 10 with the latest updates, Monitor is 27"(I can display 6 charts @6grids in one window). Also I disabled/stopped about half of windows services that I don't need. This gives my PC more RAM for running apps. My quotes settings is set to no delay(real time). When I say I don't see any lag, that is both for OnDemand and during regular session.
 
Hi everyone, this is just a general question, but is anyone having any issues with chart lag over the past few days? I've made no new systems or changes to my chart, and I am finding that the charting is lagging more so than usual since the opening of the futures market on Sunday evening.

I have reset my charts back to factory settings, reloaded codes, changed the memory allocation before opening the program, I am kind of at a loss.

Not expecting a solution, just wondering if anybody is dealing with the same.

Thanks.
Your question was move here. This thread discusses what other members have attempted.
 
for people using multiple instances of TOS.
how do you manage the mutiple chart settings?

I'm currently like this. with 4 monitors. so with 1 instance of TOS I login everything will be in place.
for multiple instances i imaging it would be splitting the 4 monitors of layer into each instances and save them each as a workspace itself.
any open 1 by 1.
any short cut to reduce the time on it?


image.png
 
The visual latency is unbearable!
For me, MTF analysis usually makes it worse. At the moment though, even charts with single time frame analysis aren't moving. They just look frozen.

Edited to add: It looks like new candle formations aren't shown while they are forming. Only closed candles are displaying. Lower indicators also don't update until after the candle has closed.
 
Last edited:
Good Afternoon Traders! I've read a lot of posts around the web about how to speed up TOS but still looking for some answers.

Four main questions:
1) Does referencing built-in TOS studies in User Defined studies slow things down? (I reference SequenceCounter in one of my studies)

2) Does the AddCloud function slow things down? (I have a study that plots several different clouds simultaneously)

3) I have a study that is about 1500 lines long. It has references to TOS built-ins, uses several instances of ATR, EMA, Fibs, etc. It seems to really bog down TOS. Does anyone know if I separated out some of the sections into individual studies and then stacked them on a chart if that would improve performance? (I've heard TOS is a single-core/thread application so I'm guessing this won't help because there's still only one core doing the same amount of work...)

4) Does anyone know how to reference a TOS built-in study but also have that reference address a higher time-frame? In other words, if I wanted to see SequenceCounter values from a 15Min time frame but have them plotted on a 5Min chart is that possible?

Some traders run multiple instances of TOS on their systems - that's not going to help me if I want mostly everything on a single chart.
However, I have been running multiple instances lately and have allocated a minimum of 24GB of RAM to each instance. Can't quite tell if that's helping.

Thank you, folks, for any input you may have!
 

Join useThinkScript to post your question to a community of 21,000+ developers and traders.

Similar threads

Not the exact question you're looking for?

Start a new thread and receive assistance from our community.

87k+ Posts
446 Online
Create Post

Similar threads

Similar threads

The Market Trading Game Changer

Join 2,500+ subscribers inside the useThinkScript VIP Membership Club
  • Exclusive indicators
  • Proven strategies & setups
  • Private Discord community
  • ‘Buy The Dip’ signal alerts
  • Exclusive members-only content
  • Add-ons and resources
  • 1 full year of unlimited support

Frequently Asked Questions

What is useThinkScript?

useThinkScript is the #1 community of stock market investors using indicators and other tools to power their trading strategies. Traders of all skill levels use our forums to learn about scripting and indicators, help each other, and discover new ways to gain an edge in the markets.

How do I get started?

We get it. Our forum can be intimidating, if not overwhelming. With thousands of topics, tens of thousands of posts, our community has created an incredibly deep knowledge base for stock traders. No one can ever exhaust every resource provided on our site.

If you are new, or just looking for guidance, here are some helpful links to get you started.

What are the benefits of VIP Membership?
VIP members get exclusive access to these proven and tested premium indicators: Buy the Dip, Advanced Market Moves 2.0, Take Profit, and Volatility Trading Range. In addition, VIP members get access to over 50 VIP-only custom indicators, add-ons, and strategies, private VIP-only forums, private Discord channel to discuss trades and strategies in real-time, customer support, trade alerts, and much more. Learn all about VIP membership here.
How can I access the premium indicators?
To access the premium indicators, which are plug and play ready, sign up for VIP membership here.
Back
Top