
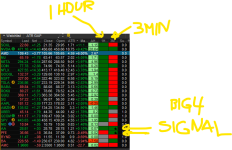
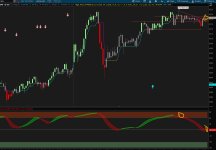
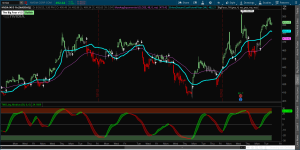
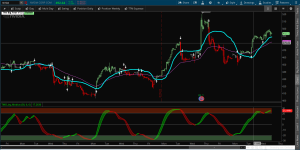
You need to change the "strategy hold trend" to NO.Thank you @HODL-Lay-HE-hoo! I will copy your watchlist column. I have another question about Big 4, every time I log in on Tos the colored candles is not working correctly on some charts, I don't know if the indicator can only be open once or not I'm going to share a screen of spy and qqq with Big 4, so you can see the issue with Big 4 (QQQ is not changing the color of the candles). @HODL-Lay-HE-hoo! I'm going to add @TradingNumbers on my post maybe he knows what I need to change on my setup to eliminate the issue with Big 4.
thanks again.
The Big Four Chart SetUp For ThinkOrSwim
- Thread starter TradingNumbers
- Start date
")
Similar threads
-
AGAIG SwingTrading Ichimoku with Stop and Reverse-8 D Chart For ThinkOrSwim
- Started by csricksdds
- Replies: 1
-
 Value Area, Pullback, Trade Chart Setup For ThinkOrSwim
- Started by clatham
- Replies: 4
-
Repaints AGAIG Confluence – The Co-Pilot (My Best Trading Chart Ever) For ThinkOrSwim
- Started by csricksdds
- Replies: 26
-
Repaints AGAIG Follow The Money - Command Options Trading Chart For ThinkOrSwim
- Started by csricksdds
- Replies: 9
-
Repaints AGAIG A Choice Chart Setup for Trading or Scalping with ThinkOrSwim
- Started by csricksdds
- Replies: 141
Similar threads
-
AGAIG SwingTrading Ichimoku with Stop and Reverse-8 D Chart For ThinkOrSwim
- Started by csricksdds
- Replies: 1
-
Value Area, Pullback, Trade Chart Setup For ThinkOrSwim
- Started by clatham
- Replies: 4
-
Repaints AGAIG Confluence – The Co-Pilot (My Best Trading Chart Ever) For ThinkOrSwim
- Started by csricksdds
- Replies: 26
-
Repaints AGAIG Follow The Money - Command Options Trading Chart For ThinkOrSwim
- Started by csricksdds
- Replies: 9
-
Repaints AGAIG A Choice Chart Setup for Trading or Scalping with ThinkOrSwim
- Started by csricksdds
- Replies: 141
The Market Trading Game Changer
Join 2,500+ subscribers inside the useThinkScript VIP Membership Club
- Exclusive indicators
- Proven strategies & setups
- Private Discord community
- ‘Buy The Dip’ signal alerts
- Exclusive members-only content
- Add-ons and resources
- 1 full year of unlimited support
Frequently Asked Questions
What is useThinkScript?
useThinkScript is the #1 community of stock market investors using indicators and other tools to power their trading strategies. Traders of all skill levels use our forums to learn about scripting and indicators, help each other, and discover new ways to gain an edge in the markets.
How do I get started?
We get it. Our forum can be intimidating, if not overwhelming. With thousands of topics, tens of thousands of posts, our community has created an incredibly deep knowledge base for stock traders. No one can ever exhaust every resource provided on our site.
If you are new, or just looking for guidance, here are some helpful links to get you started.
- The most viewed thread:
https://usethinkscript.com/threads/repainting-trend-reversal-for-thinkorswim.183/ - Our most popular indicator:
https://usethinkscript.com/threads/buy-the-dip-indicator-for-thinkorswim.3553/ - Answers to frequently asked questions:
https://usethinkscript.com/threads/answers-to-commonly-asked-questions.6006/
What are the benefits of VIP Membership?
VIP members get exclusive access to these proven and tested premium indicators: Buy the Dip, Advanced Market Moves 2.0, Take Profit, and Volatility Trading Range. In addition, VIP members get access to over 50 VIP-only custom indicators, add-ons, and strategies, private VIP-only forums, private Discord channel to discuss trades and strategies in real-time, customer support, trade alerts, and much more. Learn all about VIP membership here.
How can I access the premium indicators?
To access the premium indicators, which are plug and play ready, sign up for VIP membership here.