
May I know which version of the Big Four study you using? Pls share the TOS study if possible. I got the alert at a different period in the hourly chart, hence the ask.. Thanks!big4 trigered a signal yesterday, bought a July 21 $60 C. Thoughts from users of this strategy? The white arrow is big4 buy alert, price above supertrend (purple) View attachment 19129
Still testing the strategy I had some 200-300% killers this week, 1 looser TMUS put stopped out at 30% loss.
-
Happy Father's Day! For a limited time: take $50 off VIP Membership with code DAD50 Claim Discount
You are using an out of date browser. It may not display this or other websites correctly.
You should upgrade or use an alternative browser.
You should upgrade or use an alternative browser.
The Big Four Chart SetUp For ThinkOrSwim
- Thread starter TradingNumbers
- Start date
- Status
- Not open for further replies.
Join useThinkScript to post your question to a community of 21,000+ developers and traders.
garythomas44
New member
Hello @cocojumbo , As you have mentioned i looked into my chart and i see signal on 12th not on 11th. wondering what is the difference between your code and mine. do you mind sharing your version ?big4 trigered a signal yesterday, bought a July 21 $60 C. Thoughts from users of this strategy? The white arrow is big4 buy alert, price above supertrend (purple) View attachment 19129
Still testing the strategy I had some 200-300% killers this week, 1 looser TMUS put stopped out at 30% loss.
Ebay is down $3 in pre-mkt after earnings. Should pay today. I don't like to play before earnings because the premiums are jacked...often you will get a volatility crush if the stock doesn't move drastically above /below the expected move. Ebay's expected move after earnings was +/- $3.still in googl and syna. googl pumped +10 AH, wonder what my 123 calls will be worth at open. syna up 47%. bought ebay 18 aug 47 put. Slow week very busy at work.
It was on the 1st 1H candle on the 12th.Hello @cocojumbo , As you have mentioned i looked into my chart and i see signal on 12th not on 11th. wondering what is the difference between your code and mine. do you mind sharing your version ?
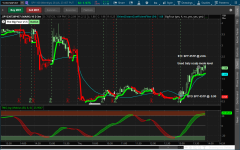
I thought I would share a 3 min SPY trade I did today. I am home today...so I can do these 3 min trades. I have the 3 min chart of SPY and the 3 min chart of SPY 28-JUL (1dte) 457P. As you can see the Big 4 signaled bearish just after 1:00EST. It then retested the 48 EMA (purple). The TMO was well ABOVE zero for PUTS. As you look at the chart of SPY 457P...the same thing is occuring. The Big 4 confirmed with the TMO well BELOW zero. It will be inverse to the equity.
I bought the puts @ 0.90. I closed the trade out @ 2.04 (126%)
My exit was based off using Saty's scalp mode level. 455.74. It was within 0.10 of this level and I decided to close it out as his levels are on point and I figured it would bounce within 0.10...which it did. Plus this was near y'days closing price for a gap fill.
If you're not familiar with Saty....his levels are on this website and they are free. He has a website that you can download his levels and pivot ribbons at satyland dot com. His levels are for different timeframes. I was using the scalp mode level on 3 min timeframe. There are morning scalp mode levels and then at 1:30 they change for the afternoon session. That's why you'll notice the lines adjust at 1:30. The red lines are the ultimate targets which represent +1ATR. Above the blue line is entry for calls. Below the Yellow line is entry for puts. I used the Yellow line as my target for this trade. The faded grey lines are some fib levels that he has in the indicator. The purple lines are the previous sessions closing price.
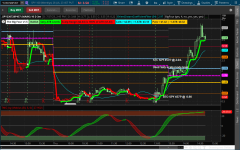
The 3rd chart attached is the SPY 457P with Saty's levels for the option I traded. Very powerful stuff....as you can see I left $200/contract on the table.
2 things I would recommend to improve your entries and exits:
1) copy and paste the options strike price into a separate chart with the Big 4, Supertrend, TMO on the chart just like you have on the equity chart.
2) Add Saty's levels to the both the equity and options chart. If the options are very liquid (high volume) such as SPY it will look just like the stock chart.
I bought the puts @ 0.90. I closed the trade out @ 2.04 (126%)
My exit was based off using Saty's scalp mode level. 455.74. It was within 0.10 of this level and I decided to close it out as his levels are on point and I figured it would bounce within 0.10...which it did. Plus this was near y'days closing price for a gap fill.
If you're not familiar with Saty....his levels are on this website and they are free. He has a website that you can download his levels and pivot ribbons at satyland dot com. His levels are for different timeframes. I was using the scalp mode level on 3 min timeframe. There are morning scalp mode levels and then at 1:30 they change for the afternoon session. That's why you'll notice the lines adjust at 1:30. The red lines are the ultimate targets which represent +1ATR. Above the blue line is entry for calls. Below the Yellow line is entry for puts. I used the Yellow line as my target for this trade. The faded grey lines are some fib levels that he has in the indicator. The purple lines are the previous sessions closing price.
The 3rd chart attached is the SPY 457P with Saty's levels for the option I traded. Very powerful stuff....as you can see I left $200/contract on the table.
2 things I would recommend to improve your entries and exits:
1) copy and paste the options strike price into a separate chart with the Big 4, Supertrend, TMO on the chart just like you have on the equity chart.
2) Add Saty's levels to the both the equity and options chart. If the options are very liquid (high volume) such as SPY it will look just like the stock chart.
Attachments
Last edited:
Can you show your settings for Saty's Scalp levels? I just downloaded it and my levels aren't matching yours.I thought I would share a 3 min SPY trade I did today. I am home today...so I can do these 3 min trades. I have the 3 min chart of SPY and the 3 min chart of SPY 28-JUL (1dte) 457P. As you can see the Big 4 signaled bearish just after 1:00EST. It then retested the 48 EMA (purple). The TMO was well ABOVE zero for PUTS. As you look at the chart of SPY 457P...the same thing is occuring. The Big 4 confirmed with the TMO well BELOW zero. It will be inverse to the equity.
I bought the puts @ 0.90. I closed the trade out @ 2.04 (126%)
My exit was based off using Saty's scalp mode level. 455.74. It was within 0.10 of this level and I decided to close it out as his levels are on point and I figured it would bounce within 0.10...which it did. Plus this was near y'days closing price for a gap fill.
If you're not familiar with Saty....his levels are on this website and they are free. He has a website that you can download his levels and pivot ribbons at satyland dot com. His levels are for different timeframes. I was using the scalp mode level on 3 min timeframe. There are morning scalp mode levels and then at 1:30 they change for the afternoon session. That's why you'll notice the lines adjust at 1:30. The red lines are the ultimate targets which represent +1ATR. Above the blue line is entry for calls. Below the Yellow line is entry for puts. I used the Yellow line as my target for this trade. The faded grey lines are some fib levels that he has in the indicator. The purple lines are the previous sessions closing price.
The 3rd chart attached is the SPY 457P with Saty's levels for the option I traded. Very powerful stuff....as you can see I left $200/contract on the table.
2 things I would recommend to improve your entries and exits:
1) copy and paste the options strike price into a separate chart with the Big 4, Supertrend, TMO on the chart just like you have on the equity chart.
2) Add Saty's levels to the both the equity and options chart. If the options are very liquid (high volume) such as SPY it will look just like the stock chart.
Attachments
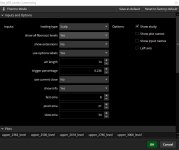
The only difference in mine versus yours is:Can you show your settings for Saty's Scalp levels? I just downloaded it and my levels aren't matching yours.
1) I have changed the colors of the levels to my color preferences
2) Show all fib levels (No) --- makes it a little cleaner
3) Show extensions (yes) --- having this on will show you up to +2ATR which SPY hit today to the penny. See the 2nd red line (slightly lighter color red).
4) use option labels (yes)
Attachments
The only difference in mine versus yours is:
1) I have changed the colors of the levels to my color preferences
2) Show all fib levels (No) --- makes it a little cleaner
3) Show extensions (yes) --- having this on will show you up to +2ATR which SPY hit today to the penny. See the 2nd red line (slightly lighter color red).
4) use option labels (yes)
Can you show how to make a red lines which represent +1ATR ?. I also downloaded Saty's script.Can you show your settings for Saty's Scalp levels? I just downloaded it and my levels aren't matching yours.
CaseyPlays_
New member
Here is my Chart setup
2 TMO(30,6,6) 1min/3min
50 channel ema (High, Low, Close)
Working on Scalping /ES /MES
Fairly new to trading but this seems to be making sense. Levels predetermined by myself. Scalp when you get a signal and both TMOs are green/red. Hold until level. Entry is on cross of 50ema.
google and ebay paid out ~200-300%. I closed each at market order @ open... I need to figure out a better exit plan. I see my profit at 200% but when I close it captures 167% for example. Not complaining but it would be nice to keep more profit lol. My account doubled ~4 weeks of trial and error with big4 I am trilled, anyone on the edge I’d say give this a shot. How do you experienced option trades close your positons to max profit??Ebay is down $3 in pre-mkt after earnings. Should pay today. I don't like to play before earnings because the premiums are jacked...often you will get a volatility crush if the stock doesn't move drastically above /below the expected move. Ebay's expected move after earnings was +/- $3.
My biggest issue is staying in the trade. I FOMO out almost every time. When I decide to stay in, I end up taking a loos and I know that is why I FOMO. I am trying to work on it. For example, I got in LULU Swing trade which I am new to (Very New). Today I had a loss of about 173.00. I was risking 430.0 But when I got back into profit, only 92.00, I decided to take it to reduce risk as it appeared as though the market was going to keep going up today. As soon as I got out the entire market went down. I had until Aug. 4th but decided to take what I could get. I would be up around 400.00 right now and it may go even lower. On the bright side the Big 4 system worked (I believe) May have been lucky due to the crazy drop today.google and ebay paid out ~200-300%. I closed each at market order @ open... I need to figure out a better exit plan. I see my profit at 200% but when I close it captures 167% for example. Not complaining but it would be nice to keep more profit lol. My account doubled ~4 weeks of trial and error with big4 I am trilled, anyone on the edge I’d say give this a shot. How do you experienced option trades close your positons to max profit??
My 2 cents when you close a option trade check the final value ( tos) shows that on limit and market and choose which one you want hope that helpsgoogle and ebay paid out ~200-300%. I closed each at market order @ open... I need to figure out a better exit plan. I see my profit at 200% but when I close it captures 167% for example. Not complaining but it would be nice to keep more profit lol. My account doubled ~4 weeks of trial and error with big4 I am trilled, anyone on the edge I’d say give this a shot. How do you experienced option trades close your positons to max profit??
I enjoy reading all the comments of how this indicator has been helping people in real time. That's awesome! I'm also glad how some have used their own tweaks and tricks to make the indicator perform better like adding the super trend. I solely trade this with SPY on a 3-minute time frame and still do but will try to start swing trading using higher timeframes that you guys have been using. However, it takes a bit of time to switch to different timeframes because you will need to backtest which parameters generate the best win rate %. The one's I posted worked best for the 3-minute timeframe but judging from the posts here they apparently work for higher timeframes as well. My account is finally big enough where I can actually afford to buy option contracts that are far out lol. If you guys want, I can add the supertrend as a 5th indicator and see how it does during back testing. If performed well, we can add it as a 5th condition.
I also see that recently you guys have been asking about exits and I use my own support and resistance lines but another thing that can be helpful is using the TMO with parameters that are a little different. For example, I have the parameters set to 20,4,2 and whenever it reaches the oversold or overbought areas I will look to exit IF ONLY price is near a support/resistance zone. I have noticed that with these parameters TMO can stay overbought/oversold for a quite a while and the trend continues. It is not possible to capture the entire move. You never will. Your job is to secure profit whether that's in seconds or hours. Try to sell your position by splitting it. For example, when I first started to use this strategy, I would exit half my position once I secured $500 in profit. I would then let the rest of my position run until my exit criteria was met. That way if the position turned against me, I would not lose as much. That basically kept me alive.
I also see that recently you guys have been asking about exits and I use my own support and resistance lines but another thing that can be helpful is using the TMO with parameters that are a little different. For example, I have the parameters set to 20,4,2 and whenever it reaches the oversold or overbought areas I will look to exit IF ONLY price is near a support/resistance zone. I have noticed that with these parameters TMO can stay overbought/oversold for a quite a while and the trend continues. It is not possible to capture the entire move. You never will. Your job is to secure profit whether that's in seconds or hours. Try to sell your position by splitting it. For example, when I first started to use this strategy, I would exit half my position once I secured $500 in profit. I would then let the rest of my position run until my exit criteria was met. That way if the position turned against me, I would not lose as much. That basically kept me alive.
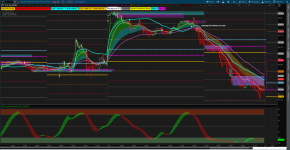
@GiantBull Good to hear from you. Adding the SuperTrend might be a good idea. I have been trying to figure out how to create a scan when a stock previously signaled bullish on the 1H breaks below the SuperTrend but then recaptures and gets back above the SuperTrend. Here is an example trade I was in:I enjoy reading all the comments of how this indicator has been helping people in real time. That's awesome! I'm also glad how some have used their own tweaks and tricks to make the indicator perform better like adding the super trend. I solely trade this with SPY on a 3-minute time frame and still do but will try to start swing trading using higher timeframes that you guys have been using. However, it takes a bit of time to switch to different timeframes because you will need to backtest which parameters generate the best win rate %. The one's I posted worked best for the 3-minute timeframe but judging from the posts here they apparently work for higher timeframes as well. My account is finally big enough where I can actually afford to buy option contracts that are far out lol. If you guys want, I can add the supertrend as a 5th indicator and see how it does during back testing. If performed well, we can add it as a 5th condition.
I also see that recently you guys have been asking about exits and I use my own support and resistance lines but another thing that can be helpful is using the TMO with parameters that are a little different. For example, I have the parameters set to 20,4,2 and whenever it reaches the oversold or overbought areas I will look to exit IF ONLY price is near a support/resistance zone. I have noticed that with these parameters TMO can stay overbought/oversold for a quite a while and the trend continues. It is not possible to capture the entire move. You never will. Your job is to secure profit whether that's in seconds or hours. Try to sell your position by splitting it. For example, when I first started to use this strategy, I would exit half my position once I secured $500 in profit. I would then let the rest of my position run until my exit criteria was met. That way if the position turned against me, I would not lose as much. That basically kept me alive.
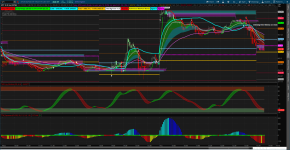
KO --- It signaled bullish on the 1H on Wednesday July 12th on the 1st 1H candle. Later that day it fell below the SuperTrend only to go back above it at EOD. Then it stays above it the rest of the week. On Monday it fell below it in the afternoon session and then regains it Tuesday morning for only 2 candles...and Big 4 triggered Bullish again BUT TMO (30,6,6) and (20,4,2) were in the overbought territory >0. Then later that day Big 4 signaled bearish and I closed out the last 2 of my 16 contracts that I had. Wednesday morning 19-July...Big 4 Signaled Bullish but TMO (30,6,6) was still overbought and it was above the SuperTrend. This would have been a good entry even though TMO (30,6,6) was >0. But since you have just revealed TMO (20,4,2) that was below zero on this 1H candle 19-July. KO went from 60.60 to 63.00...which was an even bigger move that the one I captured from 59.75 to 61.
I was trying to create a scan where the stock recaptures the SuperTrend when Big 4 was already bullish or below goes back below the SuperTrend for an already bearish Big 4.
How many trades do you get per day using only SPY on 3 Min? What would you say your winning % is?
Thanks!
This is what I mean when I say it's a bit hard to transition to another timeframe because most of the time almost all the parameters will change to be suitable for that specific timeframe and even security. For the TMO (30,6,6) those parameters are a bit high because the TF was for the 3 minute. So, when using it on the hourly TF it won't give you optimal signals as it will be a bit late. You could try changing it to 20,4,2 as that would give you signals faster. Just keep in mind you will have to sacrifice some moves due to the TMO now being faster. I think the scan might be easier to make once the Super trend is added to the code. I will do that in a bit.@GiantBull Good to hear from you. Adding the SuperTrend might be a good idea. I have been trying to figure out how to create a scan when a stock previously signaled bullish on the 1H breaks below the SuperTrend but then recaptures and gets back above the SuperTrend. Here is an example trade I was in:
KO --- It signaled bullish on the 1H on Wednesday July 12th on the 1st 1H candle. Later that day it fell below the SuperTrend only to go back above it at EOD. Then it stays above it the rest of the week. On Monday it fell below it in the afternoon session and then regains it Tuesday morning for only 2 candles...and Big 4 triggered Bullish again BUT TMO (30,6,6) and (20,4,2) were in the overbought territory >0. Then later that day Big 4 signaled bearish and I closed out the last 2 of my 16 contracts that I had. Wednesday morning 19-July...Big 4 Signaled Bullish but TMO (30,6,6) was still overbought and it was above the SuperTrend. This would have been a good entry even though TMO (30,6,6) was >0. But since you have just revealed TMO (20,4,2) that was below zero on this 1H candle 19-July. KO went from 60.60 to 63.00...which was an even bigger move that the one I captured from 59.75 to 61.
I was trying to create a scan where the stock recaptures the SuperTrend when Big 4 was already bullish or below goes back below the SuperTrend for an already bearish Big 4.
How many trades do you get per day using only SPY on 3 Min? What would you say your winning % is?
Thanks!
The trades I make on the 3-minute TF usually average to about 2-3. I love that the TMO acts as a great filter to take trades. If you don't use that your trades would go up to 7-8 probably and the win % goes down drastically. I need to calculate my win % but when I first started to use it the % was up to 70%. Obviously, it will be a lot different now.
lolreconlol
Active member
Cool! What's your win percentage with the strat?Created a small strat , let me seeView attachment 19160
Thanks a lot!!!
Back Testing looks good
View attachment 19161
Here is the code with the CCI Supertrend. Turn strategy confirmation factor to 5 and strategy hold trend to "NO". See some good results. Will backtest this and post the results soon.
# AK Trend
input aktrend_input1 = 3;
input aktrend_input2 = 8;
input aktrend_price = close;
def aktrend_fastmaa = MovAvgExponential(aktrend_price, aktrend_input1);
def aktrend_fastmab = MovAvgExponential(aktrend_price, aktrend_input2);
def aktrend_bspread = (aktrend_fastmaa - aktrend_fastmab) * 1.001;
def cond1_UP = if aktrend_bspread > 0 then 1 else 0;
def cond1_DN = if aktrend_bspread <= 0 then -1 else 0;
# ZSCORE
def zscore_price = close;
def zscore_length = 20;
def zscore_ZavgLength = 20;
def zscore_oneSD = StDev(zscore_price, zscore_length);
def zscore_avgClose = SimpleMovingAvg(zscore_price, zscore_length);
def zscore_ofoneSD = zscore_oneSD * zscore_price[1];
def zscore_Zscorevalue = ((zscore_price - zscore_avgClose) / zscore_oneSD);
def zscore_avgZv = Average(zscore_Zscorevalue, 20);
def zscore_Zscore = ((zscore_price - zscore_avgClose) / zscore_oneSD);
def zscore_avgZscore = Average(zscore_Zscorevalue, zscore_ZavgLength);
def cond2_UP = if zscore_Zscore > 0 then 1 else 0;
def cond2_DN = if zscore_Zscore <= 0 then -1 else 0;
# Ehlers
input ehlers_length = 34;
def ehlers_price = (high + low) / 2;
def ehlers_coeff = ehlers_length * ehlers_price * ehlers_price - 2 * ehlers_price * Sum(ehlers_price, ehlers_length)[1] + Sum(ehlers_price * ehlers_price, ehlers_length)[1];
def ehlers_Ehlers = Sum(ehlers_coeff * ehlers_price, ehlers_length) / Sum(ehlers_coeff, ehlers_length);
def cond3_UP = if close > ehlers_Ehlers then 1 else 0;
def cond3_DN = if close <= ehlers_Ehlers then -1 else 0;
# Anchored Momentum
input amom_src = close;
input amom_MomentumPeriod = 10;
input amom_SignalPeriod = 8;
input amom_SmoothMomentum = no;
input amom_SmoothingPeriod = 7;
def amom_p = 2 * amom_MomentumPeriod + 1;
def amom_t_amom = if amom_SmoothMomentum == yes then ExpAverage(amom_src, amom_SmoothingPeriod) else amom_src;
def amom_amom = 100 * ( (amom_t_amom / ( Average(amom_src, amom_p)) - 1));
def amom_amoms = Average(amom_amom, amom_SignalPeriod);
def cond4_UP = if amom_amom > 0 then 1 else 0;
def cond4_DN = if amom_amom <= 0 then -1 else 0;
# Supertrend, extracted from Mobius original code
input ST_Atr_Mult = 1.0; # was .70
input ST_nATR = 4;
input ST_AvgType = AverageType.HULL;
def ATR = MovingAverage(ST_AvgType, TrueRange(high, close, low), ST_nATR);
def UP = HL2 + (ST_Atr_Mult* ATR);
def DN = HL2 + (-ST_Atr_Mult * ATR);
def ST = if close < ST[1] then UP else DN;
# CCI_ATR measures distance from the mean. Calculates a trend
# line based on that distance using ATR as the locator for the line.
# Credit goes to Mobius for the underlying logic
input lengthCCI = 50; # Was 20
input lengthATR = 21; # Was 4
input AtrFactor = 1.0; # Was 0.7
def ATRCCI = Average(TrueRange(high, close, low), lengthATR) * AtrFactor;
def prrice = close + low + high;
def linDev = LinDev(prrice, lengthCCI);
def CCI = if linDev == 0
then 0
else (prrice - Average(prrice, lengthCCI)) / linDev / 0.015;
def MT1 = if CCI > 0
then Max(MT1[1], HL2 - ATRCCI)
else Min(MT1[1], HL2 + ATRCCI);
# Alignment of Supertrend and CCI ATR indicators
def Pos_State = close > ST and close > MT1;
def Neg_State = close < ST and close < MT1;
# Combined Signal Approach - Supertrend and ATR CCI
plot CSA = MT1;
CSA.AssignValueColor(if Pos_State then Color.CYAN
else if Neg_State then Color.MAGENTA
else Color.YELLOW);
# Buy/Sell Signals using state transitions
def BuySignal = (!Pos_State[1] and Pos_State);
def SellSignal = !Neg_State[1] and Neg_State;
# Buy/Sell Arrows
plot BuySignalArrow = if BuySignal then 0.995 * MT1 else Double.NaN;
BuySignalArrow.SetPaintingStrategy(PaintingStrategy.ARROW_UP);
BuySignalArrow.SetDefaultColor(Color.CYAN);
BuySignalArrow.SetLineWeight(5);
plot SellSignalArrow = if SellSignal then 1.005 * MT1 else Double.NaN;
SellSignalArrow.SetPaintingStrategy(PaintingStrategy.ARROW_DOWN);
SellSignalArrow.SetDefaultColor(Color.PINK);
SellSignalArrow.SetLineWeight(5);
def cond5_UP = if Pos_State then 1 else 0;
def cond5_DN = if Neg_State then -1 else 0;
# End SuperTrend CCI ATR Trend
# Strategy
input Strategy_Confirmation_Factor = 3;
input Strategy_ColoredCandlesOn = yes;
input Strategy_VerticalLinesOn = no;
input Strategy_HoldTrend = yes;
def cond_UP = cond1_UP + cond2_UP + cond3_UP + cond4_UP + cond5_UP;
def cond_DN = cond1_DN + cond2_DN + cond3_DN + cond4_DN + cond5_DN;
def direction = if cond_UP >= Strategy_Confirmation_Factor then 1
else if cond_DN <= -Strategy_Confirmation_Factor then -1
else if !Strategy_HoldTrend and direction[1] == 1 and cond_UP < Strategy_Confirmation_Factor and cond_DN > -Strategy_Confirmation_Factor then 0
else if !Strategy_HoldTrend and direction[1] == -1 and cond_DN > -Strategy_Confirmation_Factor and cond_UP < Strategy_Confirmation_Factor then 0
else direction[1];
plot signal_up = direction == 1 and direction[1] < 1;
signal_up.SetPaintingStrategy(PaintingStrategy.BOOLEAN_ARROW_UP);
signal_up.SetDefaultColor(Color.WHITE);
signal_up.Hide();
signal_up.HideBubble();
signal_up.HideTitle();
plot signal_dn = direction == -1 and direction[1] > -1;
signal_dn.SetPaintingStrategy(PaintingStrategy.BOOLEAN_ARROW_DOWN);
signal_dn.SetDefaultColor(Color.WHITE);
signal_dn.Hide();
signal_dn.HideBubble();
signal_dn.HideTitle();
AssignPriceColor(if Strategy_ColoredCandlesOn then if direction == 1 then Color.LIGHT_GREEN else if direction == -1 then Color.RED else Color.GRAY else Color.CURRENT);
AddVerticalLine(Strategy_VerticalLinesOn and signal_up, "Buy", Color.LIGHT_GREEN);
AddVerticalLine(Strategy_VerticalLinesOn and signal_dn, "Sell", Color.RED);
Alert(signal_up, "Buy", Alert.BAR, Sound.DING);
Alert(signal_dn, "Sell", Alert.BAR, Sound.DING);
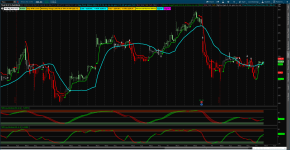
@GiantBull Take a look at this TSLA 1H chart. I have both TMO (30,6,6) and (20,4,2). On 28-June it confirmed bullish @ 9:30. The TMO 30,6,6 was below zero but TMO (20,4,2) was just slightly above zero. Same thing when it confirmed bullish 13-July. I would keep the 30,6,6, settings for now as it may be a little slower to react but can still give you great entries on some of these pullbacks.This is what I mean when I say it's a bit hard to transition to another timeframe because most of the time almost all the parameters will change to be suitable for that specific timeframe and even security. For the TMO (30,6,6) those parameters are a bit high because the TF was for the 3 minute. So, when using it on the hourly TF it won't give you optimal signals as it will be a bit late. You could try changing it to 20,4,2 as that would give you signals faster. Just keep in mind you will have to sacrifice some moves due to the TMO now being faster. I think the scan might be easier to make once the Super trend is added to the code. I will do that in a bit.
The trades I make on the 3-minute TF usually average to about 2-3. I love that the TMO acts as a great filter to take trades. If you don't use that your trades would go up to 7-8 probably and the win % goes down drastically. I need to calculate my win % but when I first started to use it the % was up to 70%. Obviously, it will be a lot different now.
So on longer pullbacks the 30,6,6 will still be under zero for bullish signals. The shorter the pullback the 20,4,2 TMO will be under zero and 30,6,6 will not be. Refer to my KO scenario above. When it re-confirmed bullish on the 19-July the TMO 30,6,6 didn't have time pullback but the faster 20,4,2 TMO had dropped below zero.
Attachments
Last edited:
I believe he is using the 20,4,2 to get out of trades and not to take them. I may be wrong but that is what I understood. I have been testing with 2 TMO's and it does help you get out a better timing sometimes but also will make you miss a larger move. It may be best to get out with profit instead of getting a reversal for potential loss. For me this has been my biggest obstacle. I leave profit on the table by a lot most of the time. The funny/sad part is when I make myself stay in to achieve a greater profit based on the indicators, I lose.@GiantBull Take a look at this TSLA 1H chart. I have both TMO (30,6,6) and (20,4,2). On 28-June it confirmed bullish @ 9:30. The TMO 30,6,6 was below zero but TMO (20,4,2) was just slightly above zero. Same thing when it confirmed bullish 13-July. I would keep the 30,6,6, settings for now as it may be a little slower to react but can still give you great entries on some of these pullbacks.
So on longer pullbacks the 30,6,6 will still be under zero for bullish signals. The shorter the pullback the 20,4,2 TMO will be under zero and 30,6,6 will not be. Refer to my KO scenario above. When it re-confirmed bullish on the 19-July the TMO 30,6,6 didn't have time pullback but the faster 20,4,2 TMO had dropped below zero.
@GiantBull Does the CCI SuperTrend replace the Ehler's DCF? I am noticing signals before the stock closes above the Ehler's DCF.Here is the code with the CCI Supertrend. Turn strategy confirmation factor to 5 and strategy hold trend to "NO". See some good results. Will backtest this and post the results soon.
# AK Trend
input aktrend_input1 = 3;
input aktrend_input2 = 8;
input aktrend_price = close;
def aktrend_fastmaa = MovAvgExponential(aktrend_price, aktrend_input1);
def aktrend_fastmab = MovAvgExponential(aktrend_price, aktrend_input2);
def aktrend_bspread = (aktrend_fastmaa - aktrend_fastmab) * 1.001;
def cond1_UP = if aktrend_bspread > 0 then 1 else 0;
def cond1_DN = if aktrend_bspread <= 0 then -1 else 0;
# ZSCORE
def zscore_price = close;
def zscore_length = 20;
def zscore_ZavgLength = 20;
def zscore_oneSD = StDev(zscore_price, zscore_length);
def zscore_avgClose = SimpleMovingAvg(zscore_price, zscore_length);
def zscore_ofoneSD = zscore_oneSD * zscore_price[1];
def zscore_Zscorevalue = ((zscore_price - zscore_avgClose) / zscore_oneSD);
def zscore_avgZv = Average(zscore_Zscorevalue, 20);
def zscore_Zscore = ((zscore_price - zscore_avgClose) / zscore_oneSD);
def zscore_avgZscore = Average(zscore_Zscorevalue, zscore_ZavgLength);
def cond2_UP = if zscore_Zscore > 0 then 1 else 0;
def cond2_DN = if zscore_Zscore <= 0 then -1 else 0;
# Ehlers
input ehlers_length = 34;
def ehlers_price = (high + low) / 2;
def ehlers_coeff = ehlers_length * ehlers_price * ehlers_price - 2 * ehlers_price * Sum(ehlers_price, ehlers_length)[1] + Sum(ehlers_price * ehlers_price, ehlers_length)[1];
def ehlers_Ehlers = Sum(ehlers_coeff * ehlers_price, ehlers_length) / Sum(ehlers_coeff, ehlers_length);
def cond3_UP = if close > ehlers_Ehlers then 1 else 0;
def cond3_DN = if close <= ehlers_Ehlers then -1 else 0;
# Anchored Momentum
input amom_src = close;
input amom_MomentumPeriod = 10;
input amom_SignalPeriod = 8;
input amom_SmoothMomentum = no;
input amom_SmoothingPeriod = 7;
def amom_p = 2 * amom_MomentumPeriod + 1;
def amom_t_amom = if amom_SmoothMomentum == yes then ExpAverage(amom_src, amom_SmoothingPeriod) else amom_src;
def amom_amom = 100 * ( (amom_t_amom / ( Average(amom_src, amom_p)) - 1));
def amom_amoms = Average(amom_amom, amom_SignalPeriod);
def cond4_UP = if amom_amom > 0 then 1 else 0;
def cond4_DN = if amom_amom <= 0 then -1 else 0;
# Supertrend, extracted from Mobius original code
input ST_Atr_Mult = 1.0; # was .70
input ST_nATR = 4;
input ST_AvgType = AverageType.HULL;
def ATR = MovingAverage(ST_AvgType, TrueRange(high, close, low), ST_nATR);
def UP = HL2 + (ST_Atr_Mult* ATR);
def DN = HL2 + (-ST_Atr_Mult * ATR);
def ST = if close < ST[1] then UP else DN;
# CCI_ATR measures distance from the mean. Calculates a trend
# line based on that distance using ATR as the locator for the line.
# Credit goes to Mobius for the underlying logic
input lengthCCI = 50; # Was 20
input lengthATR = 21; # Was 4
input AtrFactor = 1.0; # Was 0.7
def ATRCCI = Average(TrueRange(high, close, low), lengthATR) * AtrFactor;
def prrice = close + low + high;
def linDev = LinDev(prrice, lengthCCI);
def CCI = if linDev == 0
then 0
else (prrice - Average(prrice, lengthCCI)) / linDev / 0.015;
def MT1 = if CCI > 0
then Max(MT1[1], HL2 - ATRCCI)
else Min(MT1[1], HL2 + ATRCCI);
# Alignment of Supertrend and CCI ATR indicators
def Pos_State = close > ST and close > MT1;
def Neg_State = close < ST and close < MT1;
# Combined Signal Approach - Supertrend and ATR CCI
plot CSA = MT1;
CSA.AssignValueColor(if Pos_State then Color.CYAN
else if Neg_State then Color.MAGENTA
else Color.YELLOW);
# Buy/Sell Signals using state transitions
def BuySignal = (!Pos_State[1] and Pos_State);
def SellSignal = !Neg_State[1] and Neg_State;
# Buy/Sell Arrows
plot BuySignalArrow = if BuySignal then 0.995 * MT1 else Double.NaN;
BuySignalArrow.SetPaintingStrategy(PaintingStrategy.ARROW_UP);
BuySignalArrow.SetDefaultColor(Color.CYAN);
BuySignalArrow.SetLineWeight(5);
plot SellSignalArrow = if SellSignal then 1.005 * MT1 else Double.NaN;
SellSignalArrow.SetPaintingStrategy(PaintingStrategy.ARROW_DOWN);
SellSignalArrow.SetDefaultColor(Color.PINK);
SellSignalArrow.SetLineWeight(5);
def cond5_UP = if Pos_State then 1 else 0;
def cond5_DN = if Neg_State then -1 else 0;
# End SuperTrend CCI ATR Trend
# Strategy
input Strategy_Confirmation_Factor = 3;
input Strategy_ColoredCandlesOn = yes;
input Strategy_VerticalLinesOn = no;
input Strategy_HoldTrend = yes;
def cond_UP = cond1_UP + cond2_UP + cond3_UP + cond4_UP + cond5_UP;
def cond_DN = cond1_DN + cond2_DN + cond3_DN + cond4_DN + cond5_DN;
def direction = if cond_UP >= Strategy_Confirmation_Factor then 1
else if cond_DN <= -Strategy_Confirmation_Factor then -1
else if !Strategy_HoldTrend and direction[1] == 1 and cond_UP < Strategy_Confirmation_Factor and cond_DN > -Strategy_Confirmation_Factor then 0
else if !Strategy_HoldTrend and direction[1] == -1 and cond_DN > -Strategy_Confirmation_Factor and cond_UP < Strategy_Confirmation_Factor then 0
else direction[1];
plot signal_up = direction == 1 and direction[1] < 1;
signal_up.SetPaintingStrategy(PaintingStrategy.BOOLEAN_ARROW_UP);
signal_up.SetDefaultColor(Color.WHITE);
signal_up.Hide();
signal_up.HideBubble();
signal_up.HideTitle();
plot signal_dn = direction == -1 and direction[1] > -1;
signal_dn.SetPaintingStrategy(PaintingStrategy.BOOLEAN_ARROW_DOWN);
signal_dn.SetDefaultColor(Color.WHITE);
signal_dn.Hide();
signal_dn.HideBubble();
signal_dn.HideTitle();
AssignPriceColor(if Strategy_ColoredCandlesOn then if direction == 1 then Color.LIGHT_GREEN else if direction == -1 then Color.RED else Color.GRAY else Color.CURRENT);
AddVerticalLine(Strategy_VerticalLinesOn and signal_up, "Buy", Color.LIGHT_GREEN);
AddVerticalLine(Strategy_VerticalLinesOn and signal_dn, "Sell", Color.RED);
Alert(signal_up, "Buy", Alert.BAR, Sound.DING);
Alert(signal_dn, "Sell", Alert.BAR, Sound.DING);
- Status
- Not open for further replies.
Similar threads
-
 Value Area, Pullback, Trade Chart Setup For ThinkOrSwim
- Started by clatham
- Replies: 2
-
Repaints AGAIG Confluence – The Co-Pilot (My Best Trading Chart Ever) For ThinkOrSwim
- Started by csricksdds
- Replies: 12
-
Repaints AGAIG Follow The Money - Command Options Trading Chart For ThinkOrSwim
- Started by csricksdds
- Replies: 11
-
Repaints AGAIG A Choice Chart Setup for Trading or Scalping with ThinkOrSwim
- Started by csricksdds
- Replies: 141
-
Repaints AGAIG Visual Options Trading Chart for ThinkOrSwim
- Started by csricksdds
- Replies: 70
Not the exact question you're looking for?
Start a new thread and receive assistance from our community.
87k+
Posts
883
Online
Similar threads
-
Value Area, Pullback, Trade Chart Setup For ThinkOrSwim
- Started by clatham
- Replies: 2
-
Repaints AGAIG Confluence – The Co-Pilot (My Best Trading Chart Ever) For ThinkOrSwim
- Started by csricksdds
- Replies: 12
-
Repaints AGAIG Follow The Money - Command Options Trading Chart For ThinkOrSwim
- Started by csricksdds
- Replies: 11
-
Repaints AGAIG A Choice Chart Setup for Trading or Scalping with ThinkOrSwim
- Started by csricksdds
- Replies: 141
-
Repaints AGAIG Visual Options Trading Chart for ThinkOrSwim
- Started by csricksdds
- Replies: 70
The Market Trading Game Changer
Join 2,500+ subscribers inside the useThinkScript VIP Membership Club
- Exclusive indicators
- Proven strategies & setups
- Private Discord community
- ‘Buy The Dip’ signal alerts
- Exclusive members-only content
- Add-ons and resources
- 1 full year of unlimited support
Frequently Asked Questions
What is useThinkScript?
useThinkScript is the #1 community of stock market investors using indicators and other tools to power their trading strategies. Traders of all skill levels use our forums to learn about scripting and indicators, help each other, and discover new ways to gain an edge in the markets.
How do I get started?
We get it. Our forum can be intimidating, if not overwhelming. With thousands of topics, tens of thousands of posts, our community has created an incredibly deep knowledge base for stock traders. No one can ever exhaust every resource provided on our site.
If you are new, or just looking for guidance, here are some helpful links to get you started.
- The most viewed thread:
https://usethinkscript.com/threads/repainting-trend-reversal-for-thinkorswim.183/ - Our most popular indicator:
https://usethinkscript.com/threads/buy-the-dip-indicator-for-thinkorswim.3553/ - Answers to frequently asked questions:
https://usethinkscript.com/threads/answers-to-commonly-asked-questions.6006/
What are the benefits of VIP Membership?
VIP members get exclusive access to these proven and tested premium indicators: Buy the Dip, Advanced Market Moves 2.0, Take Profit, and Volatility Trading Range. In addition, VIP members get access to over 50 VIP-only custom indicators, add-ons, and strategies, private VIP-only forums, private Discord channel to discuss trades and strategies in real-time, customer support, trade alerts, and much more. Learn all about VIP membership here.
How can I access the premium indicators?
To access the premium indicators, which are plug and play ready, sign up for VIP membership here.