Extreme Engulfing Reversal Pattern for ThinkorSwim

BenTen

Administrative
Staff member
Staff
VIP
Lifetime
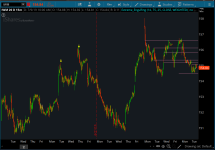
The Engulfing candlestick is considered to be a reliable pattern for reversal trading. This indicator will give you a buy and sell signal based on the Engulfing pattern combining with the RSI (Relative Strength Index) indicator.

When a bullish or bearish Engulfing candle is identified we also look at the Overbought and Oversold levels. If they match up then a signal is alerted.
  • Buy signal: Bullish Engulfing Candlestick is detected while the RSI is below 25 (extremely oversold level) then we get a sense that a bullish reversal may happen here.
  • Sell signal: The same goes for bearish Engulfing candles. It has to be detected while the RSI is in extreme overbought level (75 and over).
ARhBL7i.png

Vu7ks34.png

HaHI2Ti.png

BSZo9SX.png


thinkScript Code

Code:
# Bullish/ Bearish Engulfing Alerts (Oversold/ Overbought)

# Use with caution and in context of market.
# Make sure to adjust settings that fits you best.

# By Confluence Capital Group @ConfluenceCptl - 2017-12-04
# Addendum & thanks from @M0101X

input length = 14;
input over_Bought = 75;
input over_Sold = 25;
input price = close;
input averageType = AverageType.WEIGHTED;

#defining engulfing bars
def BodyMax = Max(open, close);
def BodyMin = Min(open, close);
def IsEngulfing = BodyMax > BodyMax[1] and
BodyMin < BodyMin[1];

#defining the bullish / bearish signals

def bullish_signal = RSI(length = length, averageType = averageType) < over_Sold and Isengulfing and close > open;

def bearish_signal = RSI(length = length, averageType = averageType) > over_Bought and Isengulfing and close < open;

#plotting the bullish / bearish signals
plot bullish = bullish_signal;
bullish.SetPaintingStrategy(PaintingStrategy.BOOLEAN_ARROW_UP);
bullish.SetDefaultColor(Color.CYAN);
bullish.SetLineWeight(2);

plot bearish = bearish_signal;
bearish.SetPaintingStrategy(PaintingStrategy.BOOLEAN_ARROW_DOWN);
bearish.SetDefaultColor(Color.YELLOW);
bearish.SetLineWeight(2);

Shareable Link

https://tos.mx/zRwh2h
 

Attachments

  • ARhBL7i.png
    ARhBL7i.png
    79 KB · Views: 208
  • Vu7ks34.png
    Vu7ks34.png
    84.4 KB · Views: 193
  • HaHI2Ti.png
    HaHI2Ti.png
    84.8 KB · Views: 168
  • BSZo9SX.png
    BSZo9SX.png
    87.2 KB · Views: 231

Join useThinkScript to post your question to a community of 21,000+ developers and traders.

Code:
input length = 14;
input over_Bought = 75;
input over_Sold = 25;
input price = close;
input averageType = AverageType.WEIGHTED;

#defining engulfing bars
def BodyMax = Max(open, close);
def BodyMin = Min(open, close);
def IsEngulfing = BodyMax > BodyMax[1] and
BodyMin < BodyMin[1];

#defining the bullish / bearish signals

def bullish_signal = RSI(length = length, averageType = averageType) < over_Sold and Isengulfing and close > open;

def bearish_signal = RSI(length = length, averageType = averageType) > over_Bought and Isengulfing and close < open;

#plotting the bullish / bearish signals
plot bullish = bullish_signal;
bullish.SetPaintingStrategy(PaintingStrategy.BOOLEAN_ARROW_UP);
bullish.SetDefaultColor(Color.CYAN);
bullish.SetLineWeight(2);

plot bearish = bearish_signal;
bearish.SetPaintingStrategy(PaintingStrategy.BOOLEAN_ARROW_DOWN);
bearish.SetDefaultColor(Color.YELLOW);
bearish.SetLineWeight(2);

@spencepuppy try it now
 
I am trying to figure out how to code in assignpricecolor to color the candles green when a bullish signal happens, the candles then stay green until a bearish signal and then the candles turn red and stay red until the next bull signal. All I am getting at the moment is the candle on which the signal happens is being painted. Ideas please.
 
Thank you for the code. It is super useful! I am trying to make this code work for the watchlist, so I can scan multiple stocks by receiving a color indicator if there is an engulfing bar. Is it possible to implement this on the watchlist? Or the code is too complicated for the watchlist to execute? I am very new to this thinkscript and glad to find this forum.
 
Thank you for the code. It is super useful! I am trying to make this code work for the watchlist, so I can scan multiple stocks by receiving a color indicator if there is an engulfing bar. Is it possible to implement this on the watchlist? Or the code is too complicated for the watchlist to execute? I am very new to this thinkscript and glad to find this forum.

# Bullish/ Bearish Engulfing Alerts (Oversold/ Overbought)

# Use with caution and in context of market.
# Make sure to adjust settings that fits you best.

# By Confluence Capital Group @ConfluenceCptl - 2017-12-04
# Addendum & thanks from @M0101X

input length = 14;
input over_Bought = 75;
input over_Sold = 25;
input price = close;
input averageType = AverageType.WEIGHTED;

#defining engulfing bars
def BodyMax = Max(open, close);
def BodyMin = Min(open, close);
def IsEngulfing = BodyMax > BodyMax[1] and
BodyMin < BodyMin[1];

#defining the bullish / bearish signals

def bullish_signal = RSI(length = length, averageType = averageType) < over_Sold and Isengulfing and close > open;

def bearish_signal = RSI(length = length, averageType = averageType) > over_Bought and Isengulfing and close < open;

#plotting the bullish / bearish signals
plot bullish = bullish_signal;
bullish.SetPaintingStrategy(PaintingStrategy.BOOLEAN_ARROW_UP);
bullish.SetDefaultColor(Color.CYAN);
bullish.SetLineWeight(2);

plot bearish = bearish_signal;
bearish.SetPaintingStrategy(PaintingStrategy.BOOLEAN_ARROW_DOWN);
bearish.SetDefaultColor(Color.YELLOW);
bearish.SetLineWeight(2);


AddLabel(yes, if bearish then "Bearish Engulf" else if bullish then "Bullish Engulf" else ".", if bearish then color.red else if bullish then color.green else color.black);


3jbGako.png
 

Similar threads

Not the exact question you're looking for?

Start a new thread and receive assistance from our community.

87k+ Posts
531 Online
Create Post

Similar threads

Similar threads

The Market Trading Game Changer

Join 2,500+ subscribers inside the useThinkScript VIP Membership Club
  • Exclusive indicators
  • Proven strategies & setups
  • Private Discord community
  • ‘Buy The Dip’ signal alerts
  • Exclusive members-only content
  • Add-ons and resources
  • 1 full year of unlimited support

Frequently Asked Questions

What is useThinkScript?

useThinkScript is the #1 community of stock market investors using indicators and other tools to power their trading strategies. Traders of all skill levels use our forums to learn about scripting and indicators, help each other, and discover new ways to gain an edge in the markets.

How do I get started?

We get it. Our forum can be intimidating, if not overwhelming. With thousands of topics, tens of thousands of posts, our community has created an incredibly deep knowledge base for stock traders. No one can ever exhaust every resource provided on our site.

If you are new, or just looking for guidance, here are some helpful links to get you started.

What are the benefits of VIP Membership?
VIP members get exclusive access to these proven and tested premium indicators: Buy the Dip, Advanced Market Moves 2.0, Take Profit, and Volatility Trading Range. In addition, VIP members get access to over 50 VIP-only custom indicators, add-ons, and strategies, private VIP-only forums, private Discord channel to discuss trades and strategies in real-time, customer support, trade alerts, and much more. Learn all about VIP membership here.
How can I access the premium indicators?
To access the premium indicators, which are plug and play ready, sign up for VIP membership here.
Back
Top