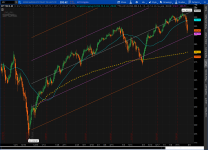
Takes the sum of the vwap over the period set in the indicator. User can set the date to start the study and it goes till present time. Posting as a request from a member. Never used it. No idea how it works. Anyone testing it please report results.

Yellow dashed line set to start 1/1/2019.
Code:
# TS_PERIOD_VWAP

# http://www.thinkscripter.com

# [email protected]

# Last Update 19 OCT 2011


# Daily Charts and up only


input startDateYyyyMmDd = 20090309;

def beyondStartDate = if getYyyyMmDd()>= startDateYyyyMmDd then 1 else 0;


plot VWAP = TotalSum(if beyondStartDate then (((high+low+close)/3)*volume) else 0)/TotalSum(if beyondStartDate then volume else 0);


VWAP.SetDefaultColor(color.orange);

VWAP.SetStyle(curve.SHORT_DASH);

VWAP.SetLineWeight(2);
Yellow dashed line set to start 1/1/2019.

