Strategy Based on EMAs, TSI, MACD, and Premarket Highs/Lows For ThinkOrSwim

Join useThinkScript to post your question to a community of 21,000+ developers and traders.

This is also in Post 1 but wanted everyone to see it. Version 6. Earlier entry.

chotPBc.png
 
Last edited:
What can go wrong....?

If you see this buy signal (1.) and then the price get so extended from the EMAs (circle) that is a red flag for me. It is almost certainly going to drop right back to where it was (2.) and then possibly continue lower (3.) I think this is what the market makers do to trap the longs and people who have FOMO. Don't buy at (2.) if the price action looks like that prior. Just wait for a better opportunity.

I didn't just pull that over extended cloud out of nowhere. That was me looking at multiple charts and coming up with the best number (probably has something to do with other algos).

To the right is what it's supposed to look like.

Em5Im29.png
 
@a1cturner I have extended your idea to a scan in a very simple easy to follow steps. Can you take a look and make sure I haven't screwed it up :)

I was able to make a scan out of this strategy to scan for the "Get Ready" yellow/golden candles. You can follow steps below to create one. Use at your own risk/discretion.


1. Copy the code of the Strategy and save as a Study.

2. Replace the following

#GET READY
def GetReadyBull = TradingDay and BothEMASBullish and PreMarketBull;
def GetReadyBear = TradingDay and BothEMASBearish and PreMarketBear;

WITH

#GET READY
plot GetReadyBull = TradingDay and BothEMASBullish and PreMarketBull;
GetReadyBull.Hide();
plot GetReadyBear = TradingDay and BothEMASBearish and PreMarketBear;
GetReadyBear.Hide();
plot GetReady = GetReadyBull or GetreadyBear;
GetReady.Hide();


3. Delete everything starting from the following and below.
Doing this to keep the code small otherwise TOS starts complaining about complex scripts.....

##################################################################
# ADDED FAST EMA PCT HERE BASED OFF BUY SIGNAL #
##################################################################

4. Save the study.

5. Create a scan using this updated study. You will be able to scan for Get Ready for Bullish action or Bearish action or general get ready and you can then look at the strategy chart to figure out if it is a bullish action or bearish....

Be forewarned, I am not a programmer and this study may not be usable by itself. I have set it up in the above manner so I can scan for the "Get Ready" signal. So, once again, this is what I did, use at your own discretion,

Hope this helps someone out there

Thanks for posting this scan. I'm able to follow your instructions until I get to 5. Create a scan using this updated study.

I'm not clear on how to create a scan from a study. How do I go about doing that?
 
Last edited:
I know some folks are interested in options and to see how this scales with contracts. I haven't done much of a manual back test but if you have time, feel free to do more by looking at the options charts and prices from the date and strike during that timeframe.

A few things to note:
-I selected the option price that was in the middle of the options chart candle during the time of a buy/sell indicator, so prices aren't 100% accurate due you get a good idea.
-The HD trades are from last week and the options exp date is this week, due to the strat not providing any signals this week and me not really noticing.

Screenshot-2022-04-13-203124.png

Excuse my grammar lmao


I will be testing this out tomorrow for live trades and will document them if I get any. I am used to minute trading to this 10 minute wait will be brutal hahaha.
 
How to create a scan from a study:
I am sure there are better instructions somewhere on this forum that @MerryDay might be able to point to

In the mean time here is something that might help...

https://intercom.help/simpler-tradi...ilter-from-a-study-using-the-condition-wizard

Thanks for posting this scan. I'm able to follow your instructions until I get to 5. Create a scan using this updated study.

I'm not clear on how to create a scan from a study. How do I go about doing that?
Here you go with how I have set it up .....

Study as I have modified it: https://tos.mx/Btag1uB

Scan as I have set it up: https://tos.mx/olNoqKS
 
Last edited by a moderator:
Having loading issues with the watchlist. Gonna have to mess with it later unless it decides to start working in a little bit.
 
I just ran the scan (11:00 AM EST) that I had posted earlier and it returned 1000+ "Get Ready" hits 800+ Get ready bullish hits and 4 Call buy indicators.... You could test it out with the scanner till the time you are able to figure out the issue with the watchlist.....


My scan filters for last price over 10.00 and a 50 day average trading volume min of 100K .... You could increase this or add other filters to fine tune the list

I just ran your scanner and it's working really well!
 
@Babaji Ka Thullu Scanner is killing it. Made it into a watchlist scanner.

With all these results does anyone have thoughts on whittling it down? Get the scanner down to only those currently showing a buy/sell signals! 🚀 Perfect world only, please. 😉
 
@Babaji Ka Thullu Scanner is killing it. Made it into a watchlist scanner.

With all these results does anyone have thoughts on whittling it down? Get the scanner down to only those currently showing a buy/sell signals! 🚀 Perfect world only, please. 😉
I updated the scan with "BuySomething" that will list tickers with either a buy call or buy put signal. You can figure out the direction from the chart. The call buy and put buy selections were already there.....


Updated scan with "BuySomething": https://tos.mx/OQeyBiV

Updated Study with "BuySomething": https://tos.mx/zhQ3jkf

If you want to reduce the number of hits, you can increase the volume avg to 500K or more. I have not tried adding any Options filters but you can give that a shot too....

Hope this helps...
Thank you, @Babaji Ka Thullu! I will play around with the options filters too and see what that gets me.
 
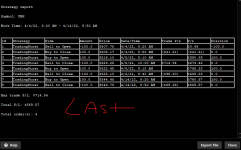
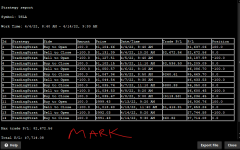
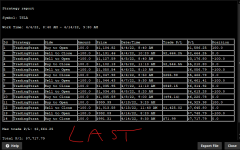
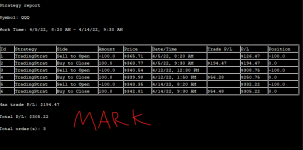
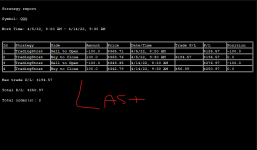
Ran some backtests on QQQ, UNH, & TSLA - 10d 10m.
More tests would have to be ran. Unfortunately it doesn't seem like MARK allows the chart to go back 180 days? My charts wouldn't for some reason..

But it does seem like MARK allows for better "Max Trade P/L."
lastQQQ.png
markQQQ.png
lastTSLA.png
markTSLA.png
lastUNH.png
markUNH.png
 

Attachments

  • lastUNH.png
    lastUNH.png
    36.5 KB · Views: 599
  • markTSLA.png
    markTSLA.png
    51.5 KB · Views: 612
  • lastTSLA.png
    lastTSLA.png
    50.5 KB · Views: 631
  • markQQQ.png
    markQQQ.png
    29 KB · Views: 624
  • lastQQQ.png
    lastQQQ.png
    23.4 KB · Views: 628
Need everyone's opinion. Do you like the "ema sep thr hld" at 0.3 or 0.25? I have noticed much earlier entries at 0.25 vs 0.3 but didn't know if anything anyone would have played today or otherwise would have lost if they had changed that to 0.25.

If y'all agree I will change it to 0.25 in the next update. Of course you can change it now until the new update comes out.

That and changing the price to Mark would have given much better entries on AMD today.
 
oops.png

TradingStratBuy to Open
100​
$109.00​
8/3/21, 8:55 AM
TradingStratSell to Close
-100​
$109.04​
8/3/21, 9:15 AM

I have noticed an error in the backtesting. There are a lot of times the green buy indicator is priced way below the actual candle, which results in inaccurate backtesting. It seems as if all the sell signals are correct and match the sell candle, but not for the buy signal and buy candles.

As you can see in the picture, the green arrow is point to a candle that is priced at 109.64 - whereas the buy indicator is priced at 109.00.

I understand that strategy is just a tool - but it would be cool if the backtesting indicators are accurate. Is there maybe something coded wrong?
 
Last edited:
So I started reading the code and whatnot - the buy indicator was set to the fastEMA - instead of a candle open/close/low/high which is throwing off the backtest results.
 
oops.png

TradingStratBuy to Open
100​
$109.00​
8/3/21, 8:55 AM
TradingStratSell to Close
-100​
$109.04​
8/3/21, 9:15 AM

I have noticed an error in the backtesting. There are a lot of times the green buy indicator is priced way below the actual candle, which results in inaccurate backtesting. It seems as if all the sell signals are correct and match the sell candle, but not for the buy signal and buy candles.

As you can see in the picture, the green arrow is point to a candle that is priced at 109.64 - whereas the buy indicator is priced at 109.00.

I understand that strategy is just a tool - but it would be cool if the backtesting indicators are accurate. Is there maybe something coded wrong?
The original strategy would only give you a dark green candle if the low was <= 5EMA or for short a dark blue candle if the high was >= 5EMA. I took that part out of the code to allow for more signals. You are right though, this does throw off the backtesting. Not real sure how to fix that since you aren’t supposed to buy anyway until the price comes back to the 5EMA. I will play with it this weekend. Thanks for noticing!
 
Lets say I see the dark green bar close and so I purchase a call. It stays green again, then light green twice then red. I don't sell after the closing red bar. Then it goes back to light green a few times. Does this mean that I'm still ok even though i didn't sell on the red bar? or does the subsequent light green bars mean nothing until a dark green bar shows again, starting the cycle over again. I have been skipping over some red bars and I've been getting lucky as it continues to go up but I have also had bad luck doing this. So does a red sell bar complete that round, even if it continues light green?
It was built to get in on or just after a dark green candle or dark blue candle only once the price touches the 5EMA and sell at the close of a red candle and then repeat only on another dark green or dark blue candle.
 

Not the exact question you're looking for?

Start a new thread and receive assistance from our community.

87k+ Posts
353 Online
Create Post

The Market Trading Game Changer

Join 2,500+ subscribers inside the useThinkScript VIP Membership Club
  • Exclusive indicators
  • Proven strategies & setups
  • Private Discord community
  • ‘Buy The Dip’ signal alerts
  • Exclusive members-only content
  • Add-ons and resources
  • 1 full year of unlimited support

Frequently Asked Questions

What is useThinkScript?

useThinkScript is the #1 community of stock market investors using indicators and other tools to power their trading strategies. Traders of all skill levels use our forums to learn about scripting and indicators, help each other, and discover new ways to gain an edge in the markets.

How do I get started?

We get it. Our forum can be intimidating, if not overwhelming. With thousands of topics, tens of thousands of posts, our community has created an incredibly deep knowledge base for stock traders. No one can ever exhaust every resource provided on our site.

If you are new, or just looking for guidance, here are some helpful links to get you started.

What are the benefits of VIP Membership?
VIP members get exclusive access to these proven and tested premium indicators: Buy the Dip, Advanced Market Moves 2.0, Take Profit, and Volatility Trading Range. In addition, VIP members get access to over 50 VIP-only custom indicators, add-ons, and strategies, private VIP-only forums, private Discord channel to discuss trades and strategies in real-time, customer support, trade alerts, and much more. Learn all about VIP membership here.
How can I access the premium indicators?
To access the premium indicators, which are plug and play ready, sign up for VIP membership here.
Back
Top