
Author Message:
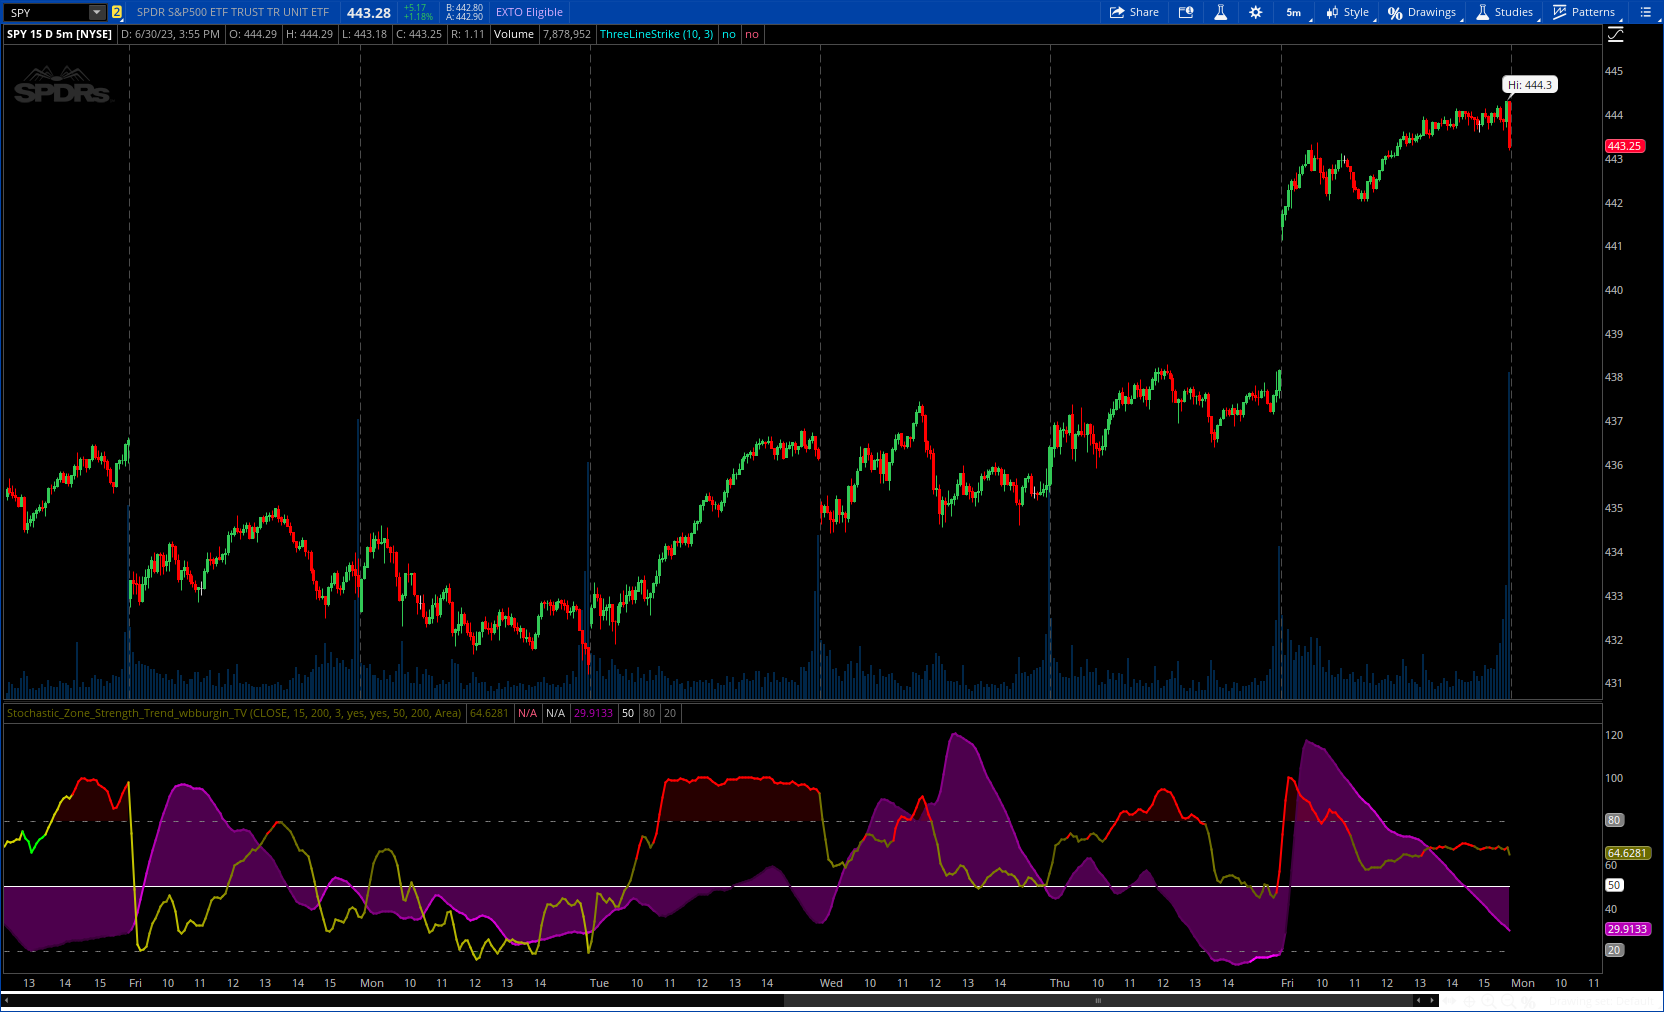
The Stochastic Zone Strength Trend indicator is a very powerful momentum and trend indicator that 1) identifies trend direction and strength, 2) determines pullbacks and reversals (including oversold and overbought conditions), 3) identifies divergences, and 4) can filter out ranges. I have some examples below on how to use it to its full effectiveness. It is composed of two components: Stochastic Zone Strength and Stochastic Trend Strength.
More details : https://www.tradingview.com/v/KBgIgpIN/
CODE:
CSS:
#https://www.tradingview.com/v/KBgIgpIN/
#// © wbburgin
#indicator('Stochastic Zone Strength Trend [wbburgin]', overlay=false)
# Converted by Sam4Cok@Samer800    - 07/2023
declare lower;
#rescale(series float src, float oldMin, float oldMax, float newMin, float newMax) =>
script rescale {
    input src = close;
    input waveLength = 200;
    input newMin = 0;
    input newMax = 100;
    def oldMin = if src == lowest(src, waveLength) then src else oldMin[1];
    def oldMax = if src == highest(src, waveLength) then src else oldMax[1];
    def rescale = newMin + (newMax - newMin) * (src - oldMin) / Max(oldMax - oldMin, 0.000001);
    plot out = rescale;
}
# stoch(source, high, low, length) =>
script stoch {
    input src = close;
    input len = 200;
    def lowest_k = Lowest(src, len);
    def c1 = src - lowest_k;
    def c2 = Highest(src, len) - lowest_k;
    def FastK = if c2 != 0 then c1 / c2 * 100 else 0;
    plot return = FastK;
}
#anysource_zonestrength(int amplitude, simple int wavelength, float source) =>
script anysource_zonestrength {
    input amplitude = 15;
    input wavelength = 200;
    input source = close;
    def hx = Highest(source, amplitude);
    def lx = Lowest(source, amplitude);
    def HLA = 0.25 * ((2 * source) + hx + lx);
    def OCP = source[1];
    def g = (HLA + OCP) / 2;
    def stringer_prerun = if HLA > OCP then
                          if hx > HLA then hx - HLA + hx - OCP else hx - OCP else
                          if lx < HLA then lx - OCP - HLA + lx else lx - OCP;
    def h = g * (1 + (stringer_prerun) * -1 / g);
    def amp_highest = Highest(h, amplitude);
    def amp_lowest = Lowest(h, amplitude);
    def s = ExpAverage(amp_lowest, wavelength);
    def t = ExpAverage(amp_highest, wavelength);
    def u = (HLA - s) / (t - s) - 0.5;
    plot out = u;
}
#anysource_str(int amplitude, float source)=>
script anysource_str {
    input amplitude = 15;
    input source = close;
    def hx = Highest(source, amplitude);
    def lx = Lowest(source, amplitude);
    def ha_close =  0.25 * ((2 * source) + hx + lx);
    def ha_open = source[1];
    def haAVG = (ha_close + ha_open) / 2;
    def stringer_prerun = if ha_close > ha_open then
                          if hx > ha_close then hx - ha_close + hx - ha_open else hx - ha_open else
                          if lx < ha_close then lx - ha_open - ha_close + lx else lx - ha_open;
    def str = AbsValue(stringer_prerun);
    plot out = str;
}
#stochzonestrength(float source, string form,simple int amplitude,simple int wavelength,simple int smoothing=3)=>
script stochzonestrength {
    input source = close;
    input form = 0;
    input amplitude = 15;
    input wavelength = 200;
    input smoothing = 3;
    def zs = anysource_zonestrength(amplitude, wavelength, source);
    def k2 = Average(stoch(zs, wavelength), smoothing);
    def zsp = ExpAverage(anysource_str(amplitude, source), wavelength);
    def k4 = Average(stoch(zsp, wavelength), smoothing);
    def szs = if form==0 then k2 else k4;#if form!=0 then k4 else Double.NaN;
    plot out = szs;
}
input src = close;
input amplitude = 15;        # 'Amplitude'
input waveLength = 200;      # 'Wavelength'
input SmoothingFactor = 3;           # "Smoothing Factor"
input showZoneStrength = yes;        # "Show Zone Strength"
input showTrendStrength = yes;       # "Show Trend Strength"
input TrendAnchor = {"0", default "50"};           # "Trend Anchor"
input trendTransformLength = 200;                  # "Trend Transform MA Length"
input trendPlotType = {default "Area", "Line"};    # "Trend Plot Type"

def na = Double.NaN;
def last = isNaN(close);
def "0" = TrendAnchor==TrendAnchor."0";
def "50" = TrendAnchor==TrendAnchor."50";
#//Zone Strength
def zs = anysource_zonestrength(amplitude,wavelength,src);
def zs_Color = rescale(zs, wavelength);
#//Stochastic Zone Strength - Normal
def stoch = stochzonestrength(src,0,amplitude,wavelength,SmoothingFactor);
#//Stochastic Zone Strength - Trend Strength
def trend = stochzonestrength(src,1,amplitude,wavelength,SmoothingFactor);
def trend_form2 = (trend - ExpAverage(trend, trendTransformLength)) + 50;
def color_trend = rescale(stoch,wavelength);# (AbsValue(floor(stoch));

plot ZoneStrength = if showZoneStrength then stoch else na;    # "Zone Strength"
ZoneStrength.AssignValueColor(if zs_Color > 80 then Color.RED else
                              if zs_Color < 20 then Color.GREEN else
                              CreateColor(255-zs_Color * 2,255-zs_Color * 2, 0));
ZoneStrength.SetLineWeight(2);

plot TrendStrReg = if showTrendStrength and "0" and trendPlotType == trendPlotType."Area"
                   then trend else na;    # "Trend Strength - Regular - Area"
TrendStrReg.AssignValueColor(CreateColor(255-color_trend * 2, 0,255- color_trend*2));
TrendStrReg.SetPaintingStrategy(PaintingStrategy.SQUARED_HISTOGRAM);

plot TrendStrLin = if showTrendStrength and "0" and trendPlotType == trendPlotType."Line"
                   then trend else na;    # "Trend Strength - Regular - Line"
TrendStrLin.AssignValueColor(CreateColor(255-color_trend * 2, 0,255- color_trend*2));
TrendStrLin.SetLineWeight(2);

plot tf2 = if showTrendStrength and "50" then trend_form2 else na;#, "Trend Transform"
tf2.AssignValueColor(CreateColor(255-color_trend * 2, 0,255- color_trend*2));
tf2.SetLineWeight(2);

plot midline = if last then na else 50;
midline.SetDefaultColor(Color.WHITE);

plot overbought = if last then na else 80;
plot oversold = if last then na else 20;
overbought.SetDefaultColor(Color.GRAY);
oversold.SetDefaultColor(Color.GRAY);
overbought.SetStyle(Curve.SHORT_DASH);
oversold.SetStyle(Curve.SHORT_DASH);
#fill(overbought,oversold,color.new(color.purple,95))
#-- Clouds

AddCloud(tf2,midline, Color.MAGENTA, Color.MAGENTA);
AddCloud(TrendStrReg,0, Color.MAGENTA, Color.MAGENTA);

AddCloud(if stoch>= 80 then stoch else na,80, Color.DARK_RED);
AddCloud(if stoch<= 20 then 20 else na,stoch, Color.DARK_GREEN);

#--- END of CODE