RSI and Stochastic Probability Based Price Target For ThinkOrSwim

praveen.poonia

New member
The author states:
This is an indicator that combines RSI and Stochastics with probability levels.

How it works?
This works by applying a regression based analysis on both Stochastics and RSI to attempt to predict a likely close price of the stock.
It also assesses the normal distribution range the stock is trading in. With this information, it does the following:

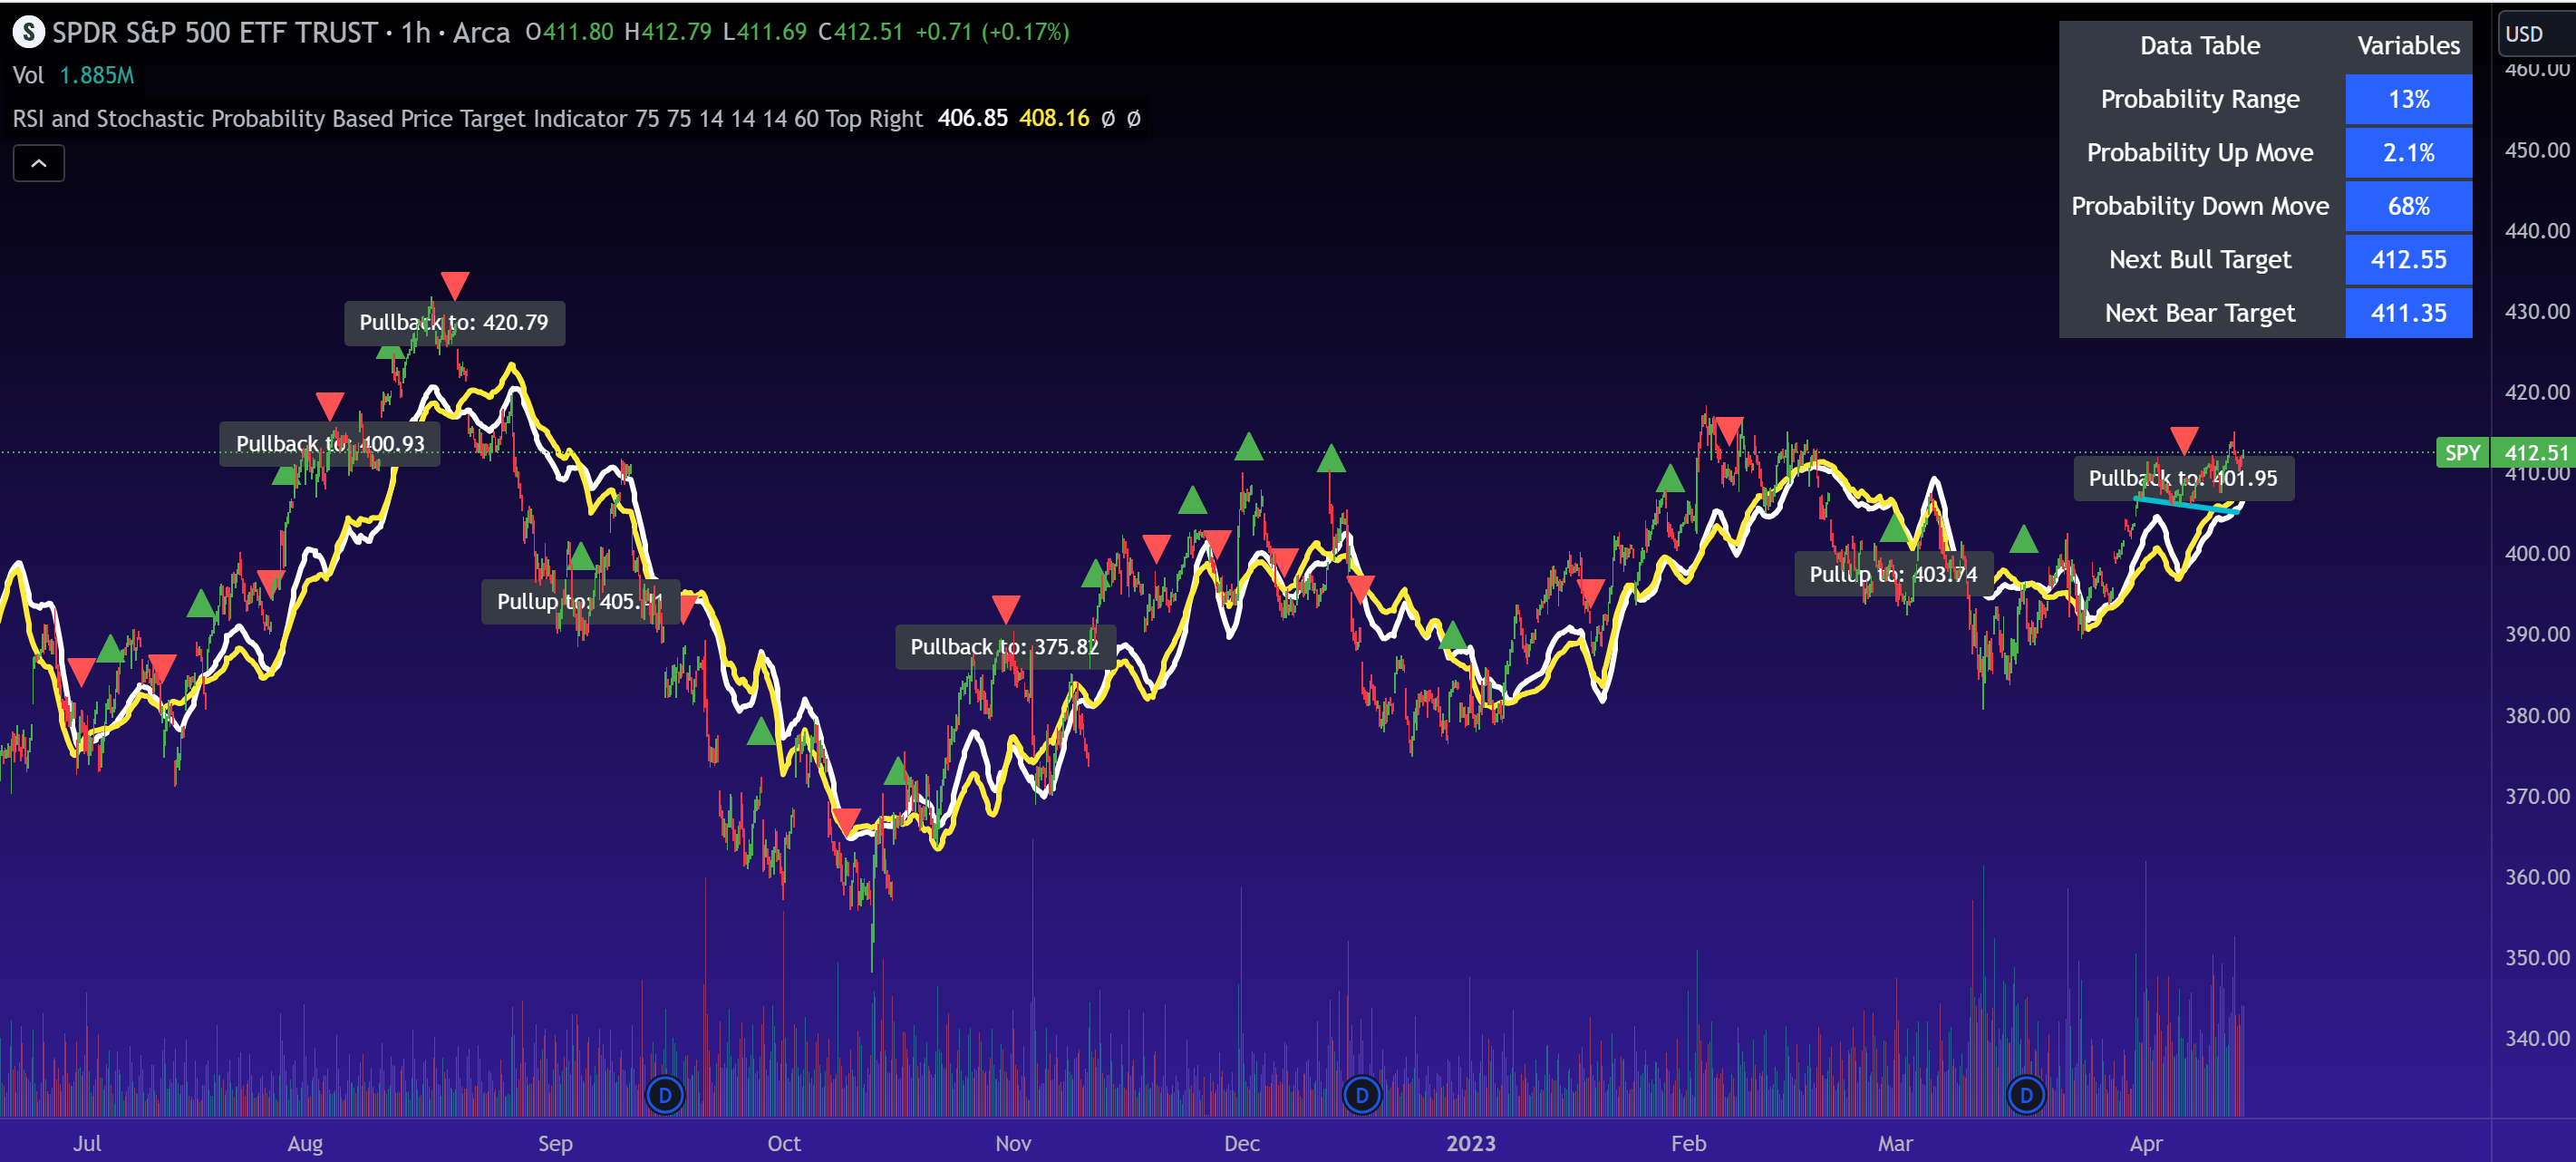
2 lines are plotted:
Yellow line: This is the stochastic line. This represents the smoothed version of the stochastic price prediction of the most likely close price.

White Line: This is the RSI line. It represents the smoothed version of the RSI price prediction of the most likely close price.

When the Yellow Line (Stochastic Line) crosses over the White Line (the RSI line), this is a bearish indication. It will signal a bearish cross (red arrow) to signal that some selling or pullback may follow.

IF this bearish cross happens while the stock is trading in a low probability upper zone (anything 13% or less), it will trigger a label to print with a pullback price. The pullback price is the "regression to the mean" assumption price. Its the current mean at the time of the bearish cross.

The inverse is true if it is a bullish cross. If the stock has a bullish cross and is trading in a low probability bearish range, it will print the price target for a regression back to the upward mean.
Qvg1dN7.png


@samer800 or someone Just wondering if you can convert this?
https://www.tradingview.com/script/...tic-Probability-Based-Price-Target-Indicator/
 
Last edited by a moderator:

Join useThinkScript to post your question to a community of 21,000+ developers and traders.

check the below:

CSS:
#/ This source code is subject to the terms of the Mozilla Public License 2.0 at
#// © Steversteves
#indicator("RSI and Stochastic Probability Based Price Target Indicator",
#Hint RegressionLookback: This is the lookback period for price prediction. Reccomended to leave at no less than 75 for best results.
#Hint StochasticSmoothing: This will smooth the price prediction for stochastics. Unsmoothing will help you identify divergences but is not reccomended as default.
# Converted by Sam4Cok@Samer800    - 01/2024
input showLabels = yes;                 # "Show Table"
input showNextBullBearLines = yes;
input showPullupPullbackBubbles = yes;
input BellCurveLookbackPeriod = 75;     # "Bell Curve Lookback Period"
input RegressionLookback = 75;
input SmoothingLength = 14;             # "Smoothing Length"
input rsiLength = 14;                   # "RSI Length"
input StochasticLength = 14;            # "Stochastic Length"
input rsiAndStochasticTimeframe = {Default "Chart", "Custom"};
input customTimeframe = AggregationPeriod.DAY;    # "RSI and Stochastic Timeframe"
input StochasticSmoothing = yes;        # "Stochastic Smoothing?"
input rsiSmoothing = yes;               # "RSI Smoothing"


def na = Double.NaN;
def last = isNaN(Close);
def length = BellCurveLookbackPeriod;
def len = RegressionLookback;
def chart = rsiAndStochasticTimeframe==rsiAndStochasticTimeframe."Chart";
def srcHTF = close(Period = customTimeframe);
script linregs {
    input y = close;
    input x = close;
    input len = 75;
    def ybar = Sum(y, len) / len;
    def xbar = Sum(x, len) / len;
    def b = Sum((x - xbar) * (y - ybar), len) / Sum((x - xbar) * (x - xbar), len);
    def a = ybar - b * xbar;
    plot aa = a;
    plot bb = b;
}
# stoch(source, high, low, length) =>
script stoch {
    input src = close;
    input h = high;
    input l = low;
    input len = 14;
    def hh = Highest(h, len);
    def ll = Lowest(l, len);
    def stoch = 100 * (src - ll) / (hh - ll);
    plot return = stoch;
}
#// Calculation
def basis = Average(close, length);
def dev = StDev(close, length);
def upper1 = basis + 3 * dev;
def upper2 = basis + 2 * dev;
def upper13 = basis + 1.5 * dev;
def upper68 = basis + dev;
def lower1 = basis - 3 * dev;
def lower2 = basis - 2 * dev;
def lower13 = basis - 1.5 * dev;
def lower68 = basis - dev;

def u12 = close < upper1 and close > upper2;
def u13 = close > upper13 and close < upper2;
def u3 = close < upper13 and close > upper68;
def neut = close >= lower68 and close <= upper68;
def l13 = close < lower68 and close > lower13;
def l2 = close < lower13 and close > lower2;
def l1 = close < lower2;

#// Bear Target
def beartarget = if l2 then lower2 else
                 if l13 then lower13 else
                 if neut then lower68 else
                 if u3 then upper68 else
                 if u13 then upper13 else
                 if u12 then upper2 else beartarget[1];
#// Bull target
def bulltarget = if l1 then lower2 else
                 if l2 then lower13 else
                 if l13 then lower68 else
                 if u12 then upper1 else
                 if u13 then upper2 else
                 if u3 then upper13 else
                 if neut then upper68 else bulltarget[1];
#// Range assessment
def rng = if u12 or l1 then 0.1 else
          if u13 or l2 then 2.1 else
          if u3 or l13 then 13 else
          if neut then 68 else 0;
#// Probability up
def uprng = if neut then 13 else
            if u3 then 2.1 else
            if u13 or u12 then 0.1 else
            if l13 or l2 or l1 then 68 else 0;
#// Probability Down
def downrng = if neut then 13 else
              if l13 then 2.1 else
              if l2 or l1 then 0.1 else
              if u3 or u13 or u12 then 68 else 0;
#// Historical stock price data
def today_close = if chart then close else srcHTF;
def o = RSI(Price = close, Length = rsiLength);
def s = stoch(close, high, low, StochasticLength);
def l = today_close;
#// Calculate linear regression for stock price based on open price
def a = linregs(l, o, len).aa;
def b = linregs(l, o, len).bb;
def c = linregs(l, s, len).aa;
def d = linregs(l, s, len).bb;
def rsiprice = a + b * o;
def stoprice = c + d * s;
#// Smoothing
def rsism = Average(rsiprice, SmoothingLength);
def stosm = Average(stoprice, SmoothingLength);
#// Conditions
def rsicross = (rsism crosses above stosm);
def stocross = (stosm crosses above rsism);

#// Assessments
def label_time;def rsilabel;def dir;
if stocross and close > upper68 and label_time[1] >= 10 {
    label_time = 0;
    dir = if showPullupPullbackBubbles then -1 else 0;
    rsilabel = Round(basis, 2);
    } else
if rsicross and (label_time[1]) >= 10 and close < lower68 {
    label_time = 0;
    dir = if showPullupPullbackBubbles then 1 else 0;
    rsilabel = Round(basis, 2);
    } else {
    label_time = label_time[1] + 1;
    dir = 0;
    rsilabel = 0;
}

AddChartBubble(dir > 0, rsilabel, "Pullup to: \n$" + rsilabel, Color.WHITE);
AddChartBubble(dir < 0 , rsilabel,"Pullback to: \n$" + rsilabel, Color.WHITE, no);

def sto = if StochasticSmoothing then stosm else stoprice;
def rsi = if rsiSmoothing then rsism else rsiprice;

#// plot functions
plot rsiLine = rsi;    # "RSI Line"
plot stoLine = sto;    # "Stochastic line"
rsiLine.SetDefaultColor(Color.WHITE);
stoLine.SetDefaultColor(Color.YELLOW);

AddChartBubble(rsicross, low, "Bull", color.green, no);
AddChartBubble(stocross, high, "Bear", color.red);

#// Data Table
def bTgt = Round(bulltarget,2);
def sTgt = Round(beartarget,2);
def lastbTgt = if showNextBullBearLines then highestAll(InertiaAll(bTgt, 2)) else na;
def lastsTgt = if showNextBullBearLines then highestAll(InertiaAll(sTgt, 2)) else na;
plot btgtLine = if last[-5] and !last[5] then InertiaAll(lastbTgt, 5, extendToRight = yes) else na;
plot stgtLine = if last[-5] and !last[5] then InertiaAll(lastsTgt, 5, extendToRight = yes) else na;
btgtLine.SetDefaultColor(Color.CYAN);
stgtLine.SetDefaultColor(Color.MAGENTA);

AddLabel(showLabels, "Probability Range(" + rng + "%)", Color.WHITE);
AddLabel(showLabels, "Probability Up Move(" + uprng + "%)", Color.WHITE);
AddLabel(showLabels, "Probability Down Move(" + downrng + "%)", Color.WHITE);
AddLabel(showLabels, "Next Bull Target($" + bTgt + ")", Color.WHITE);
AddLabel(showLabels, "Next Bear Target($" + sTgt + ")", Color.WHITE);

#-- ENd of CODE
 

Similar threads

Not the exact question you're looking for?

Start a new thread and receive assistance from our community.

87k+ Posts
325 Online
Create Post

Similar threads

Similar threads

The Market Trading Game Changer

Join 2,500+ subscribers inside the useThinkScript VIP Membership Club
  • Exclusive indicators
  • Proven strategies & setups
  • Private Discord community
  • ‘Buy The Dip’ signal alerts
  • Exclusive members-only content
  • Add-ons and resources
  • 1 full year of unlimited support

Frequently Asked Questions

What is useThinkScript?

useThinkScript is the #1 community of stock market investors using indicators and other tools to power their trading strategies. Traders of all skill levels use our forums to learn about scripting and indicators, help each other, and discover new ways to gain an edge in the markets.

How do I get started?

We get it. Our forum can be intimidating, if not overwhelming. With thousands of topics, tens of thousands of posts, our community has created an incredibly deep knowledge base for stock traders. No one can ever exhaust every resource provided on our site.

If you are new, or just looking for guidance, here are some helpful links to get you started.

What are the benefits of VIP Membership?
VIP members get exclusive access to these proven and tested premium indicators: Buy the Dip, Advanced Market Moves 2.0, Take Profit, and Volatility Trading Range. In addition, VIP members get access to over 50 VIP-only custom indicators, add-ons, and strategies, private VIP-only forums, private Discord channel to discuss trades and strategies in real-time, customer support, trade alerts, and much more. Learn all about VIP membership here.
How can I access the premium indicators?
To access the premium indicators, which are plug and play ready, sign up for VIP membership here.
Back
Top