
If you want to know how your favorite watchlist stands in relation to your favorite upper chart indicator, here is how to do it.
You need to replace the def trigger.
Use whatever you are keeping an eye on: moving average? support/resistance? atr? Feel free to plug in whatever you want.
What does the watchlist column tell you?
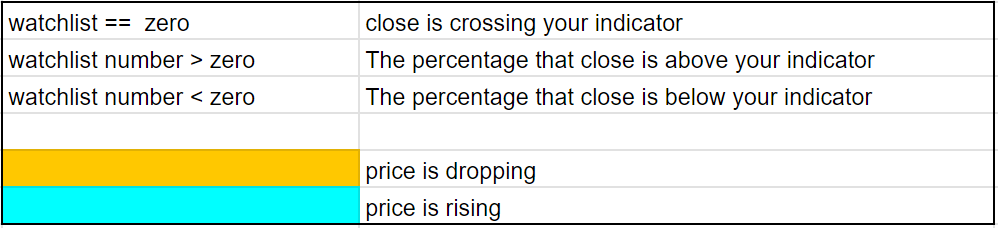
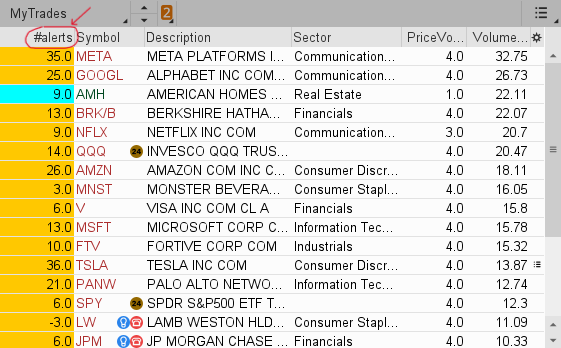
So @pegasis watches when SPY and other stocks are above their 200sma.
The above watchlist shows that all but one are greater than zero.
That means all but one are above the 200sma.
Let's look at the details:
SPY is 6% over its 200sma, but the price is dropping (colored orange) so not sure if it will stay above.
$LW is below the 200sma but within 3%. However, the price is dropping (colored orange), so it will be falling further away.
$AMH is 9% above its 200sma and is the only stock whose price was rising (color.cyan) .
@whoof watches for when his stocks cross above the DEMA200.
So he would change this line in the script:
Feel free to cut & paste your favorite upper indicator into this watchlist.
Change the def trigger to whatever is the name of upper chart plot.
Hope This Helps.
Ruby:
# Watchlist

def trigger = average(close,200);
plot pct = round((close / trigger)-1,2)*100;

assignBackgroundColor(
if close>close[1] then color.cyan else
color.orange);Use whatever you are keeping an eye on: moving average? support/resistance? atr? Feel free to plug in whatever you want.
What does the watchlist column tell you?
So @pegasis watches when SPY and other stocks are above their 200sma.
The above watchlist shows that all but one are greater than zero.
That means all but one are above the 200sma.
Let's look at the details:
SPY is 6% over its 200sma, but the price is dropping (colored orange) so not sure if it will stay above.
$LW is below the 200sma but within 3%. However, the price is dropping (colored orange), so it will be falling further away.
$AMH is 9% above its 200sma and is the only stock whose price was rising (color.cyan) .
@whoof watches for when his stocks cross above the DEMA200.
So he would change this line in the script:
to:def trigger = average(close,200);
def trigger = DEMA("length" = 200);
Feel free to cut & paste your favorite upper indicator into this watchlist.
Change the def trigger to whatever is the name of upper chart plot.
Hope This Helps.
Last edited: