
Author Message:
Description:
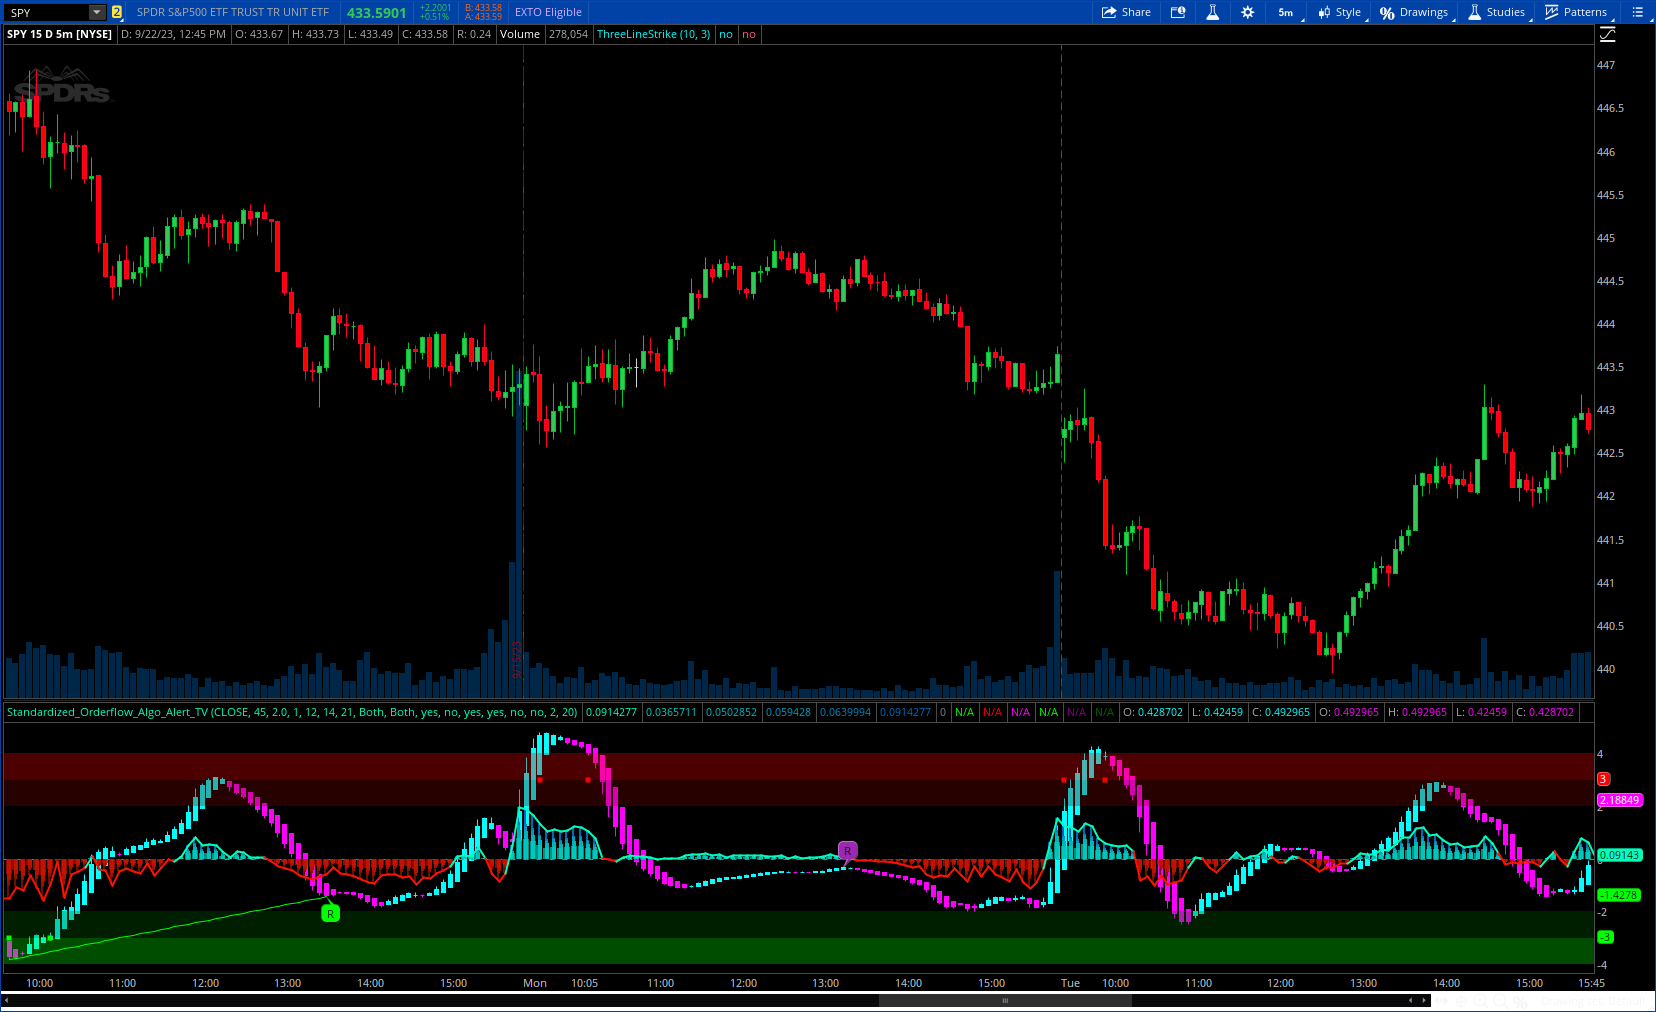
The "⨊ Standardized Orderflow" indicator is a powerful tool designed to enhance your technical analysis and trading strategies. This script brings together several unique features such as divergences, order flow, and volume-based sentiment analysis to provide traders with valuable insights into trend direction and reversal points.
More Details : https://www.tradingview.com/v/W8eyLpnK/
CODE:
CSS:
# https://www.tradingview.com/v/W8eyLpnK/
#// © Algo_Alert
#indicator(title='Standardized Orderflow [Algo Alert]', overlay=false)
# Converted by Sam4Cok@Samer800 - 09/2023
declare lower;

#// Input parameters
input source = close;
input standardDeviationPeriod = 45;
input standardDeviationMulti  = 2.0;
input momentumLength  = 1;
input orderFlowPeriod = 12;            # 'Order Flow Period'
input VelocitySignalLength = 14;       # "Velocity Signal Length"
input VelocityCalculationLength = 21;  # "Velocity Calculation Length"
input DisplayMode = {default "Both", "Order Flow", "Order Velocity"};  # "Display Mode"
input ReversalType = {default "Both", "Order Flow", "Order Velocity"}; # "Reversal Type"

def na = Double.NaN;
def last = isNaN(close);
def pos = Double.POSITIVE_INFINITY;
def neg = Double.NEGATIVE_INFINITY;
def emalen = VelocitySignalLength;
def emalen1 = VelocityCalculationLength;
def ofdispcon = DisplayMode != DisplayMode."Order Velocity";
def hadispcon = DisplayMode != DisplayMode."Order Flow";
def disOrderFlow = DisplayMode == DisplayMode."Order Flow";
def revOrderFlow = ReversalType == ReversalType."Order Flow";
def revOrderVelo = ReversalType == ReversalType."Order Velocity";
#--Color
DefineGlobalColor("green",  CreateColor(0, 255, 187));
DefineGlobalColor("red",    CreateColor(255, 17, 0));
DefineGlobalColor("green1", CreateColor(0, 255-150, 187));
DefineGlobalColor("red1",   CreateColor(255-150, 17, 0));
DefineGlobalColor("green2", CreateColor(0, 255-125, 187));
DefineGlobalColor("red2",   CreateColor(255-125, 17, 0));
DefineGlobalColor("green3", CreateColor(0, 255-100, 187));
DefineGlobalColor("red3",   CreateColor(255-100, 17, 0));
DefineGlobalColor("green4", CreateColor(0, 255-75, 187));
DefineGlobalColor("red4",   CreateColor(255-75, 17, 0));
DefineGlobalColor("green5", CreateColor(0, 255-50, 187));
DefineGlobalColor("red5",   CreateColor(255-50, 17, 0));
#/Order Flow
def sumCond = if source > source[momentumLength] then volume else
             (if source < source[momentumLength] then -volume else 0.00001);
def orderFlow_ = Sum(sumCond, orderFlowPeriod);

def orderFlow = orderFlow_ / 1000;

def stdev = StDev(orderFlow, standardDeviationPeriod);
def orderFlowX = orderFlow / (stdev * standardDeviationMulti);
def chg1 = orderFlowX * 0.70;
def chg2 = orderFlowX * 0.65;
def chg3 = orderFlowX * 0.55;
def chg4 = orderFlowX * 0.40;

def diff = ExpAverage((orderFlowX - ExpAverage(orderFlowX, emalen)) * 10, emalen1);

#//plot(orderFlowX)
plot ofxX = if ofdispcon then orderFlowX else na;
plot ofx4 = if ofdispcon then chg4 else na;
plot ofx3 = if ofdispcon then chg3 else na;
plot ofx2 = if ofdispcon then chg2 else na;
plot ofx1 = if ofdispcon then chg1 else na;
plot OFX  = if ofdispcon then orderFlowX else na;

ofxX.SetLineWeight(2);
ofxX.AssignValueColor(if orderFlowX > 0 then GlobalColor("green") else GlobalColor("red"));
ofx.AssignValueColor(if orderFlowX > 0 then GlobalColor("green1") else GlobalColor("red1"));
ofx1.AssignValueColor(if orderFlowX > 0 then GlobalColor("green2") else GlobalColor("red2"));
ofx2.AssignValueColor(if orderFlowX > 0 then GlobalColor("green3") else GlobalColor("red3"));
ofx3.AssignValueColor(if orderFlowX > 0 then GlobalColor("green4") else GlobalColor("red4"));
ofx4.AssignValueColor(if orderFlowX > 0 then GlobalColor("green5") else GlobalColor("red5"));

OFX4.SetPaintingStrategy(PaintingStrategy.SQUARED_HISTOGRAM);
OFX3.SetPaintingStrategy(PaintingStrategy.HISTOGRAM);
OFX2.SetPaintingStrategy(PaintingStrategy.HISTOGRAM);
OFX1.SetPaintingStrategy(PaintingStrategy.HISTOGRAM);
OFX.SetPaintingStrategy(PaintingStrategy.HISTOGRAM);

#OFX4.SetLineWeight(1);
OFX3.SetLineWeight(4);
OFX2.SetLineWeight(3);
OFX1.SetLineWeight(2);
#OFX.SetLineWeight(1);
plot z = if last then na else 0;#, color = color.gray, style = plot.style_cross)
z.SetDefaultColor(Color.GRAY);
z.SetStyle(Curve.SHORT_DASH);

def post = if last then na else 3;
def negt = if last then na else -3;
def onepntf =  if last then na else 2;#(1, color = red, display = display.none)
def negonepntf =  if last then na else -2;#plot(-1, color = green, display = display.none)

AddCloud(4, post, Color.RED);
AddCloud(post, onepntf, Color.DARK_RED);
AddCloud(negt, -4, Color.GREEN);
AddCloud(negonepntf, negt, Color.DARK_GREEN);


def bullrevcon = if revOrderFlow then (orderFlowX Crosses Above -1.5) else
                (if revOrderVelo then (diff Crosses Above -4) else
                ((diff Crosses Above -4) or (orderFlowX Crosses Above -1.5)));
def bearrevcon = if revOrderFlow then (orderFlowX Crosses Below 1.5) else
                (if revOrderVelo then (diff Crosses Below 4) else
                ((diff Crosses Below 4) or (orderFlowX Crosses Below 1.5)));

plot BullSig = if bullrevcon then -3 else na;
plot BearSig = if bearrevcon then  3 else na;
BullSig.SetLineWeight(2);
BearSig.SetLineWeight(2);
BullSig.SetPaintingStrategy(PaintingStrategy.SQUARES);
BullSig.SetDefaultColor(Color.GREEN);
BearSig.SetPaintingStrategy(PaintingStrategy.SQUARES);
BearSig.SetDefaultColor(Color.RED);

def o = diff[1];
def h = max(diff, diff[1]);
def l = min(diff, diff[1]);
def c = diff;

def haClose = (o + h + l + c) / 4;
def haOpen_ = CompoundValue(1, (haOpen_[1] + haClose[1]) / 2, (o + c) / 2);
def haOpen = if isNaN(haOpen_) then (o + c) / 2 else haOpen_;
def haHigh = max(h, max(haOpen, haClose));
def haLow = min(l, min(haOpen, haClose));

def up = haClose > haOpen and hadispcon;

# Plot the new Chart

AddChart(high = if up then haHigh else na , low = haLow , open = haClose,  close = haOpen,
         type = ChartType.CANDLE, growcolor =  Color.CYAN);

AddChart(high = if up or !hadispcon then na else haHigh , low = haLow , open = haOpen,  close = haClose,
         type = ChartType.CANDLE, growcolor =  Color.MAGENTA);

#----Div-----------
input ShowLastDivLines = yes;
input ShowLastHiddenDivLines = no;
input DivBull = yes;      # "Plot Bullish"
input DivBear = yes;      # "Plot Bearish"
input DivHiddenBull = no; # "Plot Hidden Bullish"
input DivHiddenBear = no; # "Plot Hidden Bearish"
input LookBackRight = 2; # "Pivot Lookback Right"
input LookBackLeft  = 20; # "Pivot Lookback Left"
def MaxLookback = 80;   # "Max of Lookback Range"
def MinLookback = -80;    # "Min of Lookback Range"

def divSrc = diff;

def divHi = high;
def divLo = low;

script FindPivots {
    input dat = close; # default data or study being evaluated
    input HL  = 0;    # default high or low pivot designation, -1 low, +1 high
    input lbL  = 5;    # default Pivot Lookback Left
    input lbR  = 1;    # default Pivot Lookback Right
    ##############
    def _nan;    # used for non-number returns
    def _BN;     # the current barnumber
    def _VStop;  # confirms that the lookforward period continues the pivot trend
    def _V;      # the Value at the actual pivot point
    ##############
    _BN  = BarNumber();
    _nan = Double.NaN;
    _VStop = if !isNaN(dat) and lbr > 0 and lbl > 0 then
                fold a = 1 to lbR + 1 with b=1 while b do
                    if HL > 0 then dat > GetValue(dat,-a) else dat < GetValue(dat,-a) else _nan;
   if (HL > 0) {
        _V = if _BN > lbL + 1 and dat == Highest(dat, lbL + 1) and _VStop
            then dat else _nan;
    } else {
        _V = if _BN > lbL + 1 and dat == Lowest(dat, lbL + 1) and _VStop
            then dat else _nan;
    }
    plot result = if !IsNaN(_V) and _VStop then _V else _nan;
}
#_inRange(cond) =>
script _inRange {
    input cond = yes;
    input rangeUpper = 60;
    input rangeLower = 5;
        def bars = if cond then 0 else bars[1] + 1;
        def inrange =  (rangeLower <= bars) and (bars <= rangeUpper);
plot retrun = inRange;
}
def pl_ = if hadispcon then findpivots(divSrc,-1, LookBackLeft, LookBackRight) else na;
def ph_ = if hadispcon then findpivots(divSrc, 1, LookBackLeft, LookBackRight) else na;
def pl = !isNaN(pl_);
def ph = !isNaN(ph_);
def pll = lowest(divSrc,LookBackLeft);
def phh = highest(divSrc,LookBackLeft);
def sll = lowest(divLo, LookBackLeft);
def shh = highest(divHi, LookBackLeft);
#-- Pvt Low
def plStart  = if pl then yes else plStart[1];
def plFound  = if (plStart and pl) then 1 else 0;
def vlFound1 = if plFound then divSrc else vlFound1[1];
def vlFound_ = if vlFound1!=vlFound1[1] then vlFound1[1] else vlFound_[1];
def vlFound  = if !vlFound_ then pll else vlFound_;
def plPrice1 = if plFound then divLo else plPrice1[1];
def plPrice_ = if plPrice1!=plPrice1[1] then plPrice1[1] else plPrice_[1];
def plPrice  = if !plPrice_ then sll else plPrice_;
#-- Pvt High
def phStart = if ph then yes else phStart[1];
def phFound = if (phStart and ph) then 1 else 0;
def vhFound1 = if phFound then divSrc else vhFound1[1];
def vhFound_ = if vhFound1!=vhFound1[1] then vhFound1[1] else vhFound_[1];
def vhFound = if !vhFound_ then phh else vhFound_;
def phPrice1 = if phFound then divHi else phPrice1[1];
def phPrice_ = if phPrice1!=phPrice1[1] then phPrice1[1] else phPrice_[1];
def phPrice = if !phPrice_ then sll else phPrice_;
#// Regular Bullish
def inRangePl = _inRange(plFound[1],MaxLookback,MinLookback);
def oscHL = divSrc > vlFound and inRangePl;
def priceLL = divLo < plPrice;
def bullCond = plFound and oscHL and priceLL;
#// Hidden Bullish
def oscLL = divSrc < vlFound and inRangePl;
def priceHL = divLo > plPrice;
def hiddenBullCond = plFound and oscLL and priceHL;
#// Regular Bearish
def inRangePh = _inRange(phFound[1],MaxLookback,MinLookback);
def oscLH   = divSrc < vhFound and inRangePh;
def priceHH = divHi > phPrice;
def bearCond = phFound and oscLH and priceHH;
#// Hidden Bearish
def oscHH = divSrc > vhFound and inRangePh;
def priceLH = divHi < phPrice;
def hiddenBearCond = phFound and oscHH and priceLH;

#------ Bubbles
def bullBub  = DivBull and bullCond;
def HbullBub = DivHiddenBull and hiddenBullCond;
def bearBub  = DivBear and bearCond;
def HbearBub = DivHiddenBear and hiddenBearCond;

addchartbubble(bullBub, divSrc, "R", color.GREEN, no);
addchartbubble(bearBub, divSrc, "R", CreateColor(156,39,176), yes);
addchartbubble(HbullBub, divSrc, "H", color.DARK_green, no);
addchartbubble(HbearBub, divSrc, "H", color.DARK_red, yes);

##### Lines
def bar = BarNumber();
#-- Bear Line
def lastPhBar = if ph then bar else lastPhBar[1];
def prePhBar = if lastPhBar!=lastPhBar[1] then lastPhBar[1] else prePhBar[1];
def priorPHBar = if bearCond then prePhBar else priorPHBar[1];
#-- Bull Line
def lastPlBar = if pl then bar else lastPlBar[1];
def prePlBar = if lastPlBar!=lastPlBar[1] then lastPlBar[1] else prePlBar[1];
def priorPLBar = if bullCond then prePlBar else priorPLBar[1];

def lastBullBar = if bullCond then bar else lastBullBar[1];
def lastBearBar = if bearCond then bar else lastBearBar[1];

def HighPivots = ph and bar >= HighestAll(priorPHBar) and bar <= HighestAll(lastBearBar);
def LowPivots  = pl and bar >= HighestAll(priorPLBar) and bar <= HighestAll(lastBullBar);

def pivotHigh = if HighPivots then divSrc else na;
def pivotLow  = if LowPivots  then divSrc else na;

plot PlotHline = if ShowLastDivLines then pivotHigh else na;
PlotHline.EnableApproximation();
PlotHline.SetDefaultColor(Color.MAGENTA);

plot PlotLline = if ShowLastDivLines then pivotLow else na;
PlotLline.EnableApproximation();
PlotLline.SetDefaultColor(Color.GREEN);

#--- Hidden Lines
#-- Bear Line
def priorHPHBar = if hiddenBearCond then prePhBar else priorHPHBar[1];
#-- Bull Line
def priorHPLBar = if hiddenBullCond then prePlBar else priorHPLBar[1];

def lastHBullBar = if hiddenBullCond then bar else lastHBullBar[1];
def lastHBearBar = if hiddenBearCond then bar else lastHBearBar[1];

def HighHPivots = ph and bar >= HighestAll(priorHPHBar) and bar <= HighestAll(lastHBearBar);
def LowHPivots  = pl and bar >= HighestAll(priorHPLBar) and bar <= HighestAll(lastHBullBar);

def pivotHidHigh = if HighHPivots then divSrc else na;
def pivotHidLow  = if LowHPivots  then divSrc else na;

plot PlotHBearline = if ShowLastHiddenDivLines then pivotHidHigh else na;
PlotHBearline.EnableApproximation();
PlotHBearline.SetDefaultColor(Color.PLUM);

plot PlotHBullline = if ShowLastHiddenDivLines then pivotHidLow else na;
PlotHBullline.EnableApproximation();
PlotHBullline.SetDefaultColor(Color.DARK_GREEN);

#-- END of CODE