Moderation
New member
Hi can one scan to see stocks that cross below and above SDC bars multiple times per day or week? Meaning, a stock were to cross below 1 SD and cross above 1 SD and if possible repeat in the same time period of either a day or week? When I currently create a scan using one SDC criteria I get many results. When I add a second SDC criteria for the opposite SD, I always get zero results, no matter how many days I look back. That being said, when I chart the stocks of the single SDC scan many of these stocks did cross both SDC bars.
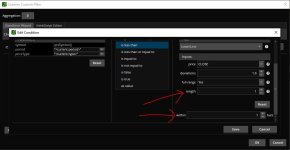
Lastly, can you clarify what these fields are in the attached pic? Also, there is a field called "offset".
Thanks!!!
Lastly, can you clarify what these fields are in the attached pic? Also, there is a field called "offset".
Thanks!!!