Standard Deviation Bands on Slow RSI

hectorgasm

Member
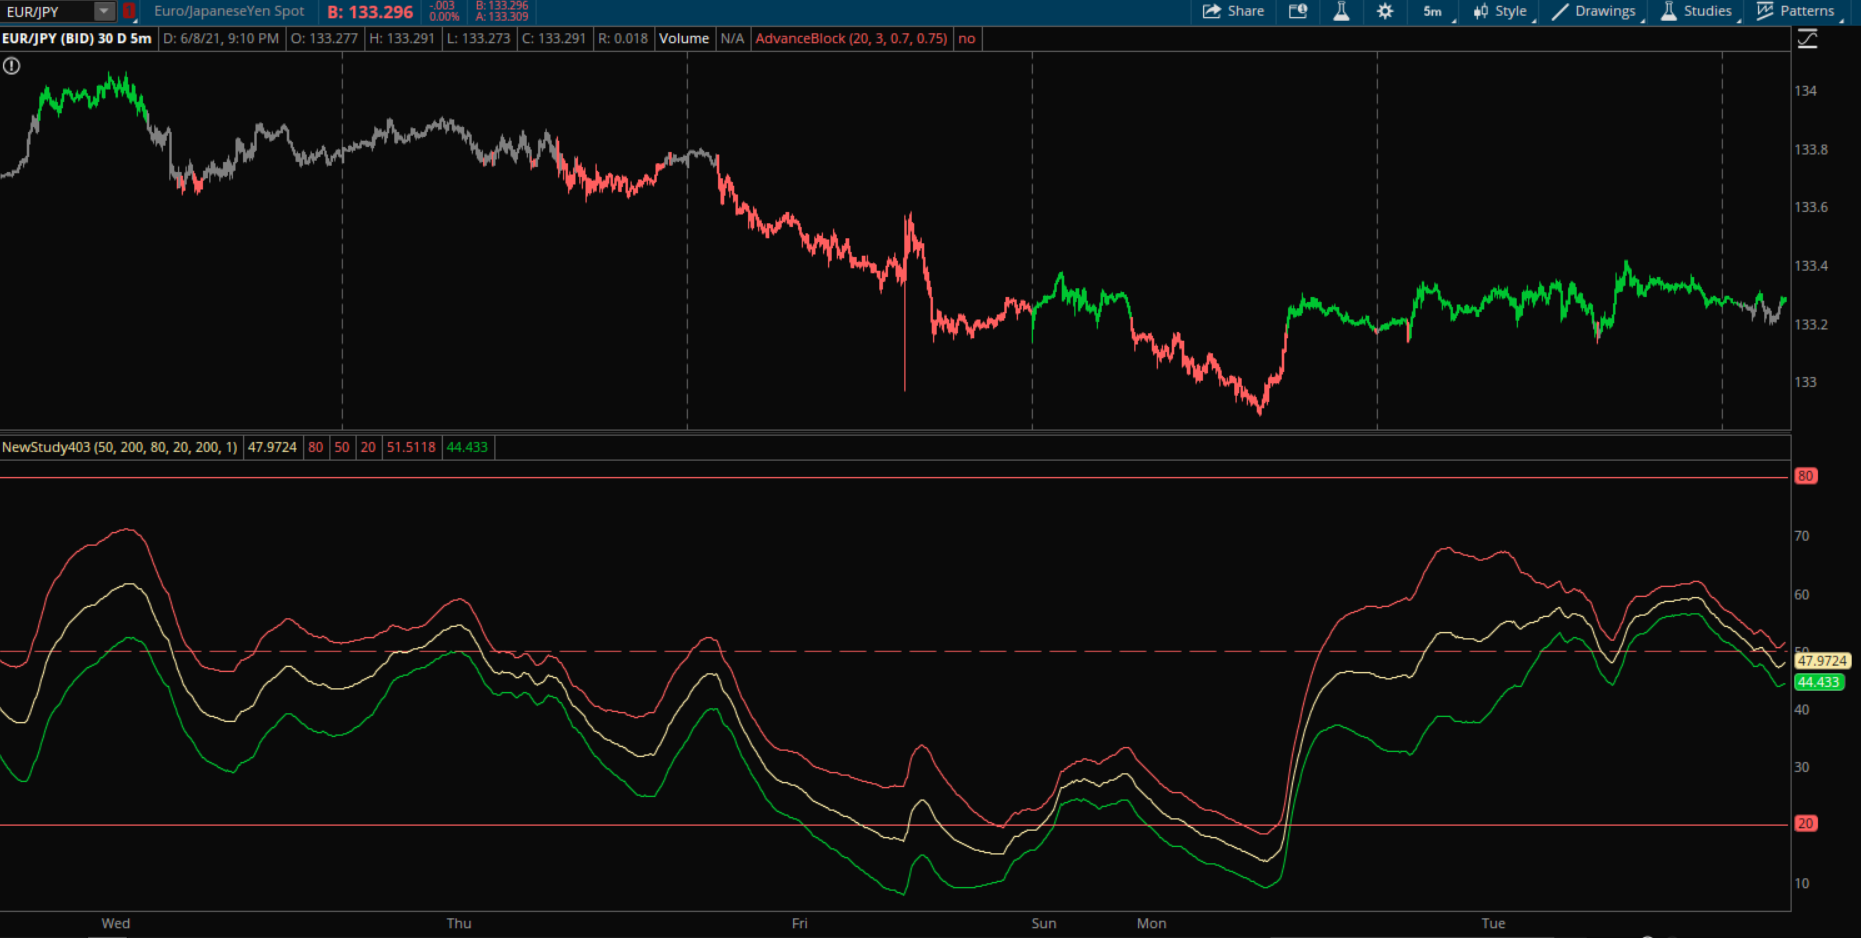
I'm trying to plot std deviation bands on slow rsi but they always end up at the bottom of the indicator, can someone help me figure out the right code please? :)
Code:
declare lower;

input emaLength = 50;
input rsiLength = 200;
input over_bought = 80;
input over_sold = 20;

def ema = ExpAverage(close, emaLength);
def netChgAvg = WildersAverage(close - ema, rsiLength);
def totChgAvg = WildersAverage(AbsValue(close - ema), rsiLength);
def chgRatio = if totChgAvg != 0 then netChgAvg / totChgAvg else 0;

plot SlowRSI = 50 * (chgRatio + 1);
plot OverBought = over_bought;
plot MiddleLine = 50;
plot OverSold = over_sold;

SlowRSI.SetDefaultColor(GetColor(8));
OverBought.SetDefaultColor(GetColor(5));
MiddleLine.SetDefaultColor(GetColor(5));
MiddleLine.SetStyle(Curve.LONG_DASH);
OverSold.SetDefaultColor(GetColor(5));


input stdLength = 50;
input stdFactor = 3;
plot updev = stdFactor*StDev(slowRSI, stdLength);
plot downdev = -stdFactor*StDev(slowRSI, stdLength);
LcRNk9.jpg
 
def dev = StDev(slowRSI, stdLength);

plot updev =slowRSI+ stdFactor* Dev;
plot downdev = slowRSI+ stdFactor* Dev;


this is the way i do it, deffine the dev first, then add/subtract it to/from the slowRSI multiplied by how many factors(std) you like.
 
def dev = StDev(slowRSI, stdLength);

plot updev =slowRSI+ stdFactor* Dev;
plot downdev = slowRSI+ stdFactor* Dev;


this is the way i do it, deffine the dev first, then add/subtract it to/from the slowRSI multiplied by how many factors(std) you like.
thanks so much german burrito, tried what you said but looks like the deviations never touch slowRSI haha
9gNuKX.jpg
 
@hectorgasm Thought this was on here somewhere but maybe not. See if this is more like what you wanted.
Code:
# RSI with Standard Deviation_Channels

# Horserider 2/5/2020


declare lower;

#RSI

input length = 14;

input price = close;

input averageType = AverageType.WILDERS;


def NetChgAvg = MovingAverage(averageType, price - price[1], length);

def TotChgAvg = MovingAverage(averageType, AbsValue(price - price[1]), length);

def ChgRatio = if TotChgAvg != 0 then NetChgAvg / TotChgAvg else 0;


plot RSI = 50 * (ChgRatio + 1);

#               

RSI.DefineColor("Positive and Up", Color.GREEN);

RSI.DefineColor("Positive and Down", Color.DARK_GREEN);

RSI.DefineColor("Negative and Down", Color.RED);

RSI.DefineColor("Negative and Up", Color.DARK_RED);

RSI.AssignValueColor(if RSI >= 50 then if RSI > RSI[1] then RSI.Color("Positive and Up") else RSI.Color("Positive and Down") else if RSI < RSI[1] then RSI.Color("Negative and Down") else RSI.Color("Negative and Up"));


####################################
input deviations = 2.0;
input fullRange = Yes;
input lengthsd = 21;

def regression;
def stdDeviation;
if (fullRange) {
    regression = InertiaAll(rsi);
    stdDeviation = stdevAll(rsi);
} else {
    regression = InertiaAll(rsi, lengthsd);
    stdDeviation = stdevAll(rsi, lengthsd);
}

plot UpperLine = regression + deviations * stdDeviation;
plot MiddleLine = regression;
plot LowerLine = regression - deviations * stdDeviation;

UpperLine.SetDefaultColor(GetColor(2));
MiddleLine.SetDefaultColor(GetColor(8));
LowerLine.SetDefaultColor(GetColor(6));

input deviations2 =1.30;
input fullRange2 = Yes;
input lengthsd2 = 21;

def regression2;
def stdDeviation2;
if (fullRange) {
    regression2 = InertiaAll(rsi);
    stdDeviation2 = stdevAll(rsi);
} else {
    regression2 = InertiaAll(rsi, lengthsd2);
    stdDeviation2 = stdevAll(rsi, lengthsd2);
}

plot UpperLine2 = regression2 + deviations2 * stdDeviation2;
plot MiddleLine2 = regression2;
plot LowerLine2 = regression2 - deviations2 * stdDeviation2;

UpperLine2.SetDefaultColor(GetColor(3));
MiddleLine2.SetDefaultColor(GetColor(8));
LowerLine2.SetDefaultColor(GetColor(7));
#########################################
input AverageTypeBB = {default SMA, EMA};
input displaceBB = 0;
input lengthBB = 5;

plot midline ;
switch (AverageTypeBB) {
case SMA:
    midline   = reference BollingerBands(RSI, displaceBB, lengthBB , averageType = AverageType.EXPONENTIAL).Midline;
case EMA:
    midline   = reference BollingerBands(RSI, displaceBB, lengthBB, averageType = AverageType.EXPONENTIAL).Midline;
}

midline.SetDefaultColor(GetColor(3));
 
@hectorgasm Thought this was on here somewhere but maybe not. See if this is more like what you wanted.
Code:
# RSI with Standard Deviation_Channels

# Horserider 2/5/2020


declare lower;

#RSI

input length = 14;

input price = close;

input averageType = AverageType.WILDERS;


def NetChgAvg = MovingAverage(averageType, price - price[1], length);

def TotChgAvg = MovingAverage(averageType, AbsValue(price - price[1]), length);

def ChgRatio = if TotChgAvg != 0 then NetChgAvg / TotChgAvg else 0;


plot RSI = 50 * (ChgRatio + 1);

#              

RSI.DefineColor("Positive and Up", Color.GREEN);

RSI.DefineColor("Positive and Down", Color.DARK_GREEN);

RSI.DefineColor("Negative and Down", Color.RED);

RSI.DefineColor("Negative and Up", Color.DARK_RED);

RSI.AssignValueColor(if RSI >= 50 then if RSI > RSI[1] then RSI.Color("Positive and Up") else RSI.Color("Positive and Down") else if RSI < RSI[1] then RSI.Color("Negative and Down") else RSI.Color("Negative and Up"));


####################################
input deviations = 2.0;
input fullRange = Yes;
input lengthsd = 21;

def regression;
def stdDeviation;
if (fullRange) {
    regression = InertiaAll(rsi);
    stdDeviation = stdevAll(rsi);
} else {
    regression = InertiaAll(rsi, lengthsd);
    stdDeviation = stdevAll(rsi, lengthsd);
}

plot UpperLine = regression + deviations * stdDeviation;
plot MiddleLine = regression;
plot LowerLine = regression - deviations * stdDeviation;

UpperLine.SetDefaultColor(GetColor(2));
MiddleLine.SetDefaultColor(GetColor(8));
LowerLine.SetDefaultColor(GetColor(6));

input deviations2 =1.30;
input fullRange2 = Yes;
input lengthsd2 = 21;

def regression2;
def stdDeviation2;
if (fullRange) {
    regression2 = InertiaAll(rsi);
    stdDeviation2 = stdevAll(rsi);
} else {
    regression2 = InertiaAll(rsi, lengthsd2);
    stdDeviation2 = stdevAll(rsi, lengthsd2);
}

plot UpperLine2 = regression2 + deviations2 * stdDeviation2;
plot MiddleLine2 = regression2;
plot LowerLine2 = regression2 - deviations2 * stdDeviation2;

UpperLine2.SetDefaultColor(GetColor(3));
MiddleLine2.SetDefaultColor(GetColor(8));
LowerLine2.SetDefaultColor(GetColor(7));
#########################################
input AverageTypeBB = {default SMA, EMA};
input displaceBB = 0;
input lengthBB = 5;

plot midline ;
switch (AverageTypeBB) {
case SMA:
    midline   = reference BollingerBands(RSI, displaceBB, lengthBB , averageType = AverageType.EXPONENTIAL).Midline;
case EMA:
    midline   = reference BollingerBands(RSI, displaceBB, lengthBB, averageType = AverageType.EXPONENTIAL).Midline;
}

midline.SetDefaultColor(GetColor(3));
thanks my dude
 
i believe this is correct. what do you use this for if you dont mind me asking


Code:
#
# TD Ameritrade IP Company, Inc. (c) 2017-2021
#

input price = close;
input length = 200;
input displace = 0;
input showBreakoutSignals = no;

def SMA = Average(price[-displace], length);
plot UpSignal = price crosses above SMA;
plot DownSignal = price crosses below SMA;

UpSignal.SetHiding(!showBreakoutSignals);
DownSignal.SetHiding(!showBreakoutSignals);


UpSignal.SetDefaultColor(Color.UPTICK);
UpSignal.SetPaintingStrategy(PaintingStrategy.BOOLEAN_ARROW_UP);
DownSignal.SetDefaultColor(Color.DOWNTICK);
DownSignal.SetPaintingStrategy(PaintingStrategy.BOOLEAN_ARROW_DOWN);

plot average = ((close- sma)/close)*100;
plot zero= 0;
Thank you for replying back let me take a look at it..... By the way you think this is the script which is in the picture on the bottom right?
 
i believe this is correct. what do you use this for if you dont mind me asking


Code:
#
# TD Ameritrade IP Company, Inc. (c) 2017-2021
#

input price = close;
input length = 200;
input displace = 0;
input showBreakoutSignals = no;

def SMA = Average(price[-displace], length);
plot UpSignal = price crosses above SMA;
plot DownSignal = price crosses below SMA;

UpSignal.SetHiding(!showBreakoutSignals);
DownSignal.SetHiding(!showBreakoutSignals);


UpSignal.SetDefaultColor(Color.UPTICK);
UpSignal.SetPaintingStrategy(PaintingStrategy.BOOLEAN_ARROW_UP);
DownSignal.SetDefaultColor(Color.DOWNTICK);
DownSignal.SetPaintingStrategy(PaintingStrategy.BOOLEAN_ARROW_DOWN);

plot average = ((close- sma)/close)*100;
plot zero= 0;
Thank you again! it lets you know how the trend is..... But I'm looking for one in the picture (lower indicator) basically it gives you price with 0 line in the middle as a 200 ema and the actual line price crosses above and below 0 line in the middle as 200 EMA
 

Join useThinkScript to post your question to a community of 21,000+ developers and traders.

Similar threads

Not the exact question you're looking for?

Start a new thread and receive assistance from our community.

87k+ Posts
495 Online
Create Post

Similar threads

Similar threads

The Market Trading Game Changer

Join 2,500+ subscribers inside the useThinkScript VIP Membership Club
  • Exclusive indicators
  • Proven strategies & setups
  • Private Discord community
  • ‘Buy The Dip’ signal alerts
  • Exclusive members-only content
  • Add-ons and resources
  • 1 full year of unlimited support

Frequently Asked Questions

What is useThinkScript?

useThinkScript is the #1 community of stock market investors using indicators and other tools to power their trading strategies. Traders of all skill levels use our forums to learn about scripting and indicators, help each other, and discover new ways to gain an edge in the markets.

How do I get started?

We get it. Our forum can be intimidating, if not overwhelming. With thousands of topics, tens of thousands of posts, our community has created an incredibly deep knowledge base for stock traders. No one can ever exhaust every resource provided on our site.

If you are new, or just looking for guidance, here are some helpful links to get you started.

What are the benefits of VIP Membership?
VIP members get exclusive access to these proven and tested premium indicators: Buy the Dip, Advanced Market Moves 2.0, Take Profit, and Volatility Trading Range. In addition, VIP members get access to over 50 VIP-only custom indicators, add-ons, and strategies, private VIP-only forums, private Discord channel to discuss trades and strategies in real-time, customer support, trade alerts, and much more. Learn all about VIP membership here.
How can I access the premium indicators?
To access the premium indicators, which are plug and play ready, sign up for VIP membership here.
Back
Top