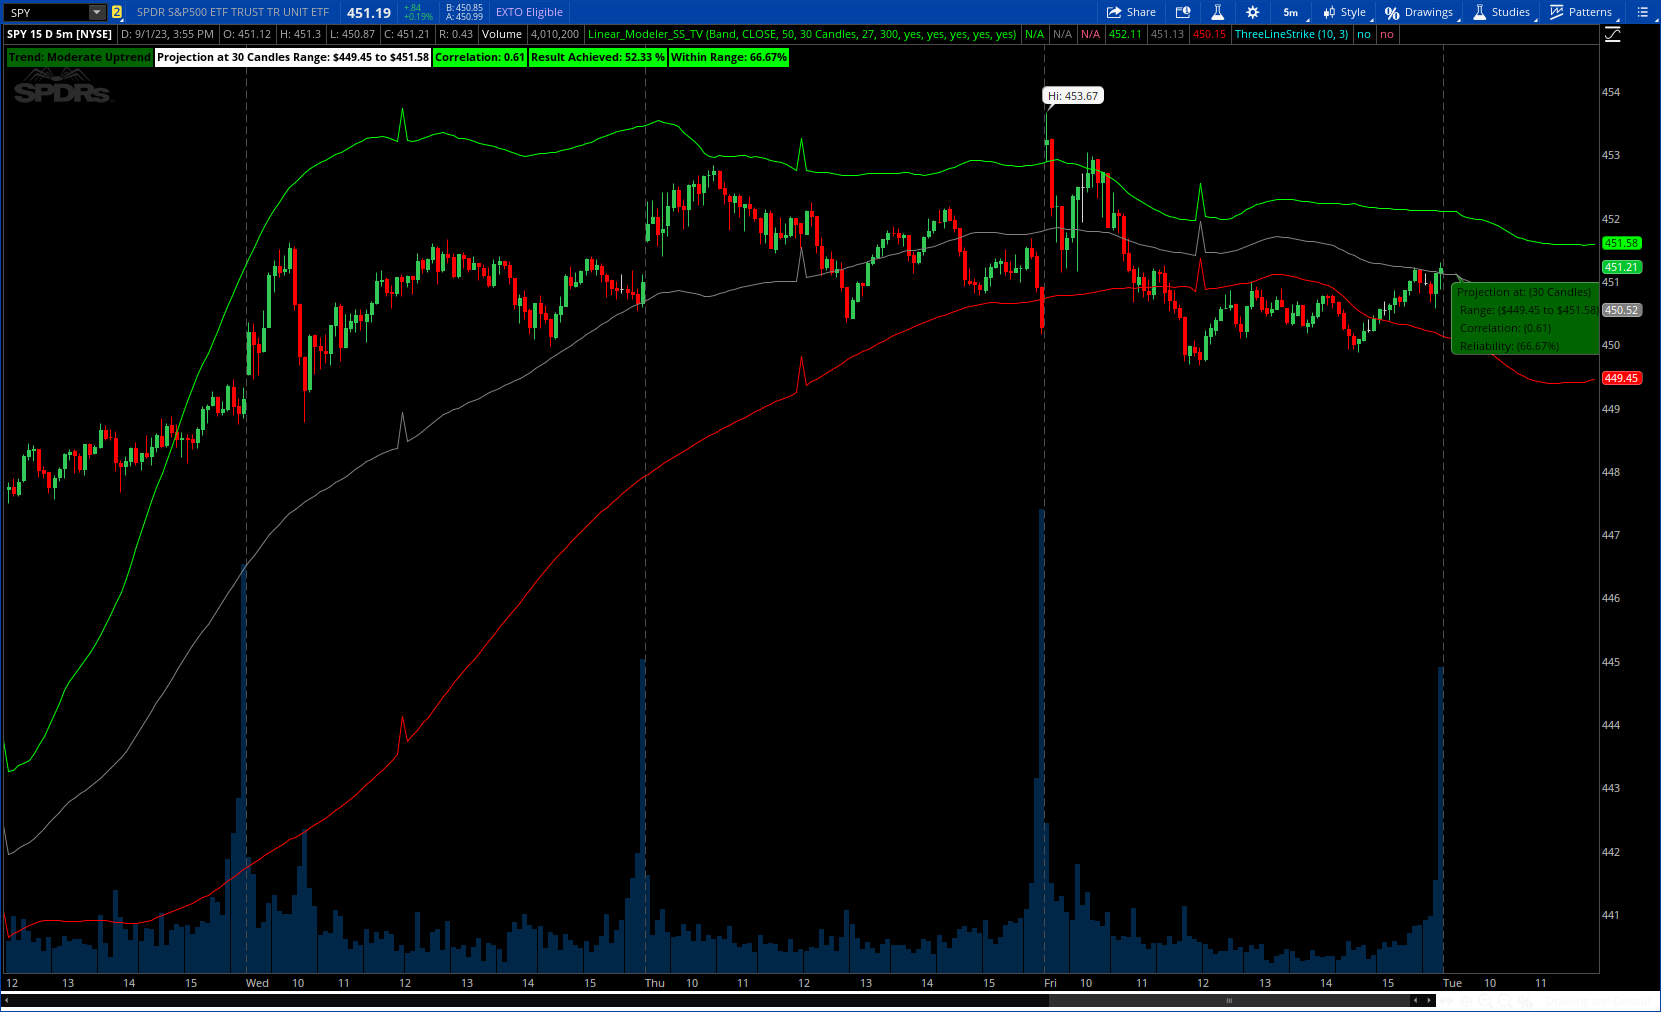
interesting indicator. I added option to plot line instead of band for better visualization.
Author Message:
This is the linear modeler indicator.
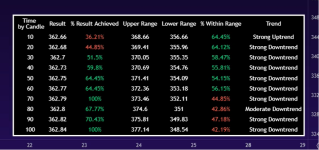
It is a statistical based indicator that provides a likely price target and range based on a linear regression time series analysis.
Read full details here : https://www.tradingview.com/v/fLeTgfxW/
CODE:
CSS:
# https://www.tradingview.com/v/fLeTgfxW/
#// © Steversteves
# indicator("[SS] Linear Modeler", overlay=true)
# Converted and mod by Sam4Cok@Samer800    - 09/2023
#// user inputs //
input plotStyle = {Default "Line", "Band", "Band & Line", "None"};
input Source = close;                    # "Source"
input AssessmentLength = 50;             # "Assessment Length"
input prjplot =   {"Manual", "10 Candles", "20 Candles",default "30 Candles", "40 Candles", "50 Candles", "60 Candles", "70 Candles", "80 Candles", "90 Candles", "100 Candles"};    # "Projection Plots"
input manualNoOfCandles = 27;
input lookback =  300;                   # "Backtest Range"
input onChartBubble = yes;
input projectionRangeLabel = yes;        # "Display Chart"
input BacktestResultsLabel = yes;        # "Display Backtest Results"
input CorrelationLabel =   yes;          # "Display Correlation"
input TrendLabel =  yes;                 # "Display Trend Result"

def na = Double.NaN;
def last = isNaN(close);
def islast = !IsNaN(close[1]);
def len = AssessmentLength;
def band = plotStyle == plotStyle."Band" or plotStyle==plotStyle."Band & Line";
def line = plotStyle == plotStyle."Line" or plotStyle==plotStyle."Band & Line";

#// Pull Source Data //
def h = high;
def l = low;
def src_data = Source;
def time = GetTime();
def src_data_time = time;

def k;
Switch (prjplot) {
Case "Manual" : k = manualNoOfCandles;
Case "10 Candles" : k = 10;
Case "20 Candles" : k = 20;
Case "30 Candles" : k = 30;
Case "40 Candles" : k = 40;
Case "50 Candles" : k = 50;
Case "60 Candles" : k = 60;
Case "70 Candles" : k = 70;
Case "80 Candles" : k = 80;
Case "90 Candles" : k = 90;
Case "100 Candles" : k = 100;
}
#/ Fundamental Functions //
# f_regression(float independent, float dependent, int len, float variable) =>
script f_regression {
    input ind = close;
    input dep = close;
    input len = 50;
    input variable = 0;
    def independent = ind;
    def dependent = dep;
    def y_array    = fold i = 0 to len + 1 with p do
                  p + dependent[i];
    def y_sq_array = fold i1 = 0 to len + 1 with p1 do
                  p1 + (dependent[i1] * dependent[i1]);
    def x_array = fold i2 = 0 to len + 1 with p2 do
                  p2 + independent[i2];
    def x_sq_array = fold i3 = 0 to len + 1 with p3 do
                  p3 + (independent[i3] * independent[i3]);
    def xy_array = fold i4 = 0 to len + 1 with p4 do
                  p4 + (independent[i4] * dependent[i4]);
    def y = y_array;
    def y2 = y_sq_array;
    def x = x_array;
    def x2 = x_sq_array;
    def xy = xy_array;
    def b1 = xy - (x * y) / len;
    def bbb2 = x2 - (Power(x, 2) / len);
    def slope = (b1 / bbb2);
    def abc = y - (slope * x);
    def abc1 = abc / len;
    def result = (variable * slope) + abc1;
    plot out = result;
}
#f_standard_error(float result, float dependent, int len) =>
script f_standard_error {
    input result = close;
    input dependent = close;
    input len = 50;
    def se_residuals = fold i = 0 to len + 1 with p do
        p + ((result[i] - dependent[i]) * (result[i] - dependent[i]));
    def se_add = se_residuals;
    def rk = se_add / (len - 1);
    def se = Sqrt(rk);
    plot out = se;
}
script f_perc {
    input pass = 1;
    input fail = 1;
    def f_perc = pass / (pass + fail) * 100;
    plot out = f_perc;
}
script f_trend {
input cor = 0;
    def res =
    if cor >= 0.5 and cor <= 0.7 then 1 else # "Moderate Uptrend"
    if cor > 0.7 then 2 else # "Strong Uptrend"
    if cor <= -0.5 and cor >= -0.7 then -1 else # "Moderate Downtrend"
    if cor < -0.7 then -2 else 0;#  res := "Strong Downtrend"
#        res := "No Clear Trend"
    plot out = res;
}
#/ Forecast Model //
def change = (src_data_time - src_data_time[1]);
def timeChange = (src_data_time + (change * k));
def q_10 = f_regression(src_data_time[k], src_data, len, timeChange);
def q10 = q_10;
#// Correlations //
def q10cor = Correlation(src_data, src_data_time, k);
def q10_cor = q10cor;
#// Range Determination //
def seq10 = f_standard_error(q10[k], src_data, len);
def se_q10 = seq10;
def q10_ucl = se_q10 + q10;
def q10_lcl = q10 - se_q10;
def q10rng_bt = src_data >= q10_lcl[k] and src_data <= q10_ucl[k];
def q10_rng_bt = q10rng_bt;
def q10pass = fold i = 0 to lookback with p do
               if q10_rng_bt[i] and islast then p + 1 else p;
def q10fail = fold i0 = 0 to lookback with p0 do
               if q10_rng_bt[i0] and islast then p0 else p0 + 1;
def q10_pass = q10pass;
def q10_fail = q10fail;
def q10pass_res = f_perc(q10_pass, q10_fail);
def q10_pass_res = q10pass_res;
#// Result Backtest //
def highest10 = Highest(h, k);
def lowest10  = Lowest(l, k);

def q10bt = q10[k] <= highest10 and q10[k] >= lowest10;
def q10_bt = q10bt;
def q10res_pass = fold j = 0 to lookback with q do
                   if q10_bt[j] and islast then q + 1 else q;
def q10res_fail = fold j0 = 0 to lookback with q0 do
                   if q10_bt[j0] and islast then q0 else q0 + 1;
def q10_res_pass = q10res_pass;
def q10_res_fail = q10res_fail;

def q10perc = f_perc(q10_res_pass, q10_res_fail);
def q10_perc = q10perc;
def s10 = f_trend(q10_cor);
def s_10 = if isNaN(s10) then 0 else s10;
def cor_Col =  q10_cor >= 0.5 or q10_cor <= -0.5;
def corCol = cor_Col;
def plot_input = q10;
def plot_input_ucl = q10_ucl;
def plot_input_lcl = q10_lcl;
def roundlcl10 = round(q10_lcl,2);
def roundusl10 = round(q10_ucl,2);
def roundcor10 = round(q10_cor,2);
def roundrel10 = round(q10_pass_res,2);
def roundper10 = round(q10_perc, 2);
def middleBand = plot_input[k];
def lowerBand = plot_input_lcl[k];
def upperBand = plot_input_ucl[k];
def intInput = inertiaAll(plot_input, 2);
def intucl = inertiaAll(plot_input_ucl, 2);
def intlcl = inertiaAll(plot_input_lcl, 2);
def hiintInput = highestAll(intInput);
def hiuclInput = highestAll(intucl);
def hilclInput = highestAll(intlcl);
def middleLine_ = inertiaAll(hiintInput,lookback);
def upperLine_  = inertiaAll(hiuclInput,lookback) ;
def lowerLine_  = inertiaAll(hilclInput,lookback) ;
def middleLine = middleLine_;
def upperLine = upperLine_;
def lowerLine = lowerLine_;

#-- Plot
plot upLine  = if line then upperLine else na;
plot midLine = if line then middleLine else na;
plot LoLine  = if line then lowerLine else na;

plot UpBand  = if band then upperBand else na;
plot midBand = if band then middleBand else na;
plot LoBand  = if band then lowerBand else na;

midBand.SetDefaultColor(Color.GRAY);
UpBand.SetDefaultColor(Color.GREEN);
LoBand.SetDefaultColor(Color.RED);
midLine.SetDefaultColor(Color.GRAY);
UpLine.SetDefaultColor(Color.GREEN);
LoLine.SetDefaultColor(GetColor(2));

#-- Labels
AddLabel(TrendLabel, "Trend: " + if s_10==2 then "Strong Uptrend" else
                             if s_10==1 then "Moderate Uptrend" else
                           if s_10==-1 then "Moderate Downtrend" else
                           if s_10==-2 then "Strong Downtrend" else "No Clear Trend"
                         , if s_10==2 then Color.GREEN else
                           if s_10==1 then Color.DARK_GREEN else
                           if s_10==-1 then Color.DARK_RED else
                           if s_10==-2 then Color.RED else Color.GRAY);

AddLabel(projectionRangeLabel, "Projection at " + k + " Candles Range: $" +
                                roundlcl10 + " to $" + roundusl10, Color.WHITE);
AddLabel(CorrelationLabel, "Correlation: " + roundcor10 , if corCol then Color.GREEN else Color.RED);

AddLabel(BacktestResultsLabel, "Result Achieved: " + roundper10 + " %",
                          if roundper10 >=51 then Color.GREEN else Color.RED);
AddLabel(BacktestResultsLabel, "Within Range: " + roundrel10 + "%",
                          if roundrel10 >=51 then Color.GREEN else Color.RED);

#-- Bubble
def loc = onChartBubble and !last[1] and last;

AddChartBubble(loc[2], middleBand, "Projection at: (" + k + " Candles) \n Range: ($" + roundlcl10[3] + " to $" + roundusl10[3] +  ")\n Correlation: (" + roundcor10[3] + ")\n Reliability: (" + roundrel10[3] + "%)"
                         , if s_10[3]==2 then Color.GREEN else
                           if s_10[3]==1 then Color.DARK_GREEN else
                           if s_10[3]==-1 then Color.DARK_RED else
                           if s_10[3]==-2 then Color.RED else Color.GRAY,
                           if source[3] < middleBand[3] then yes else no);
#- End of CODE