
mod note:
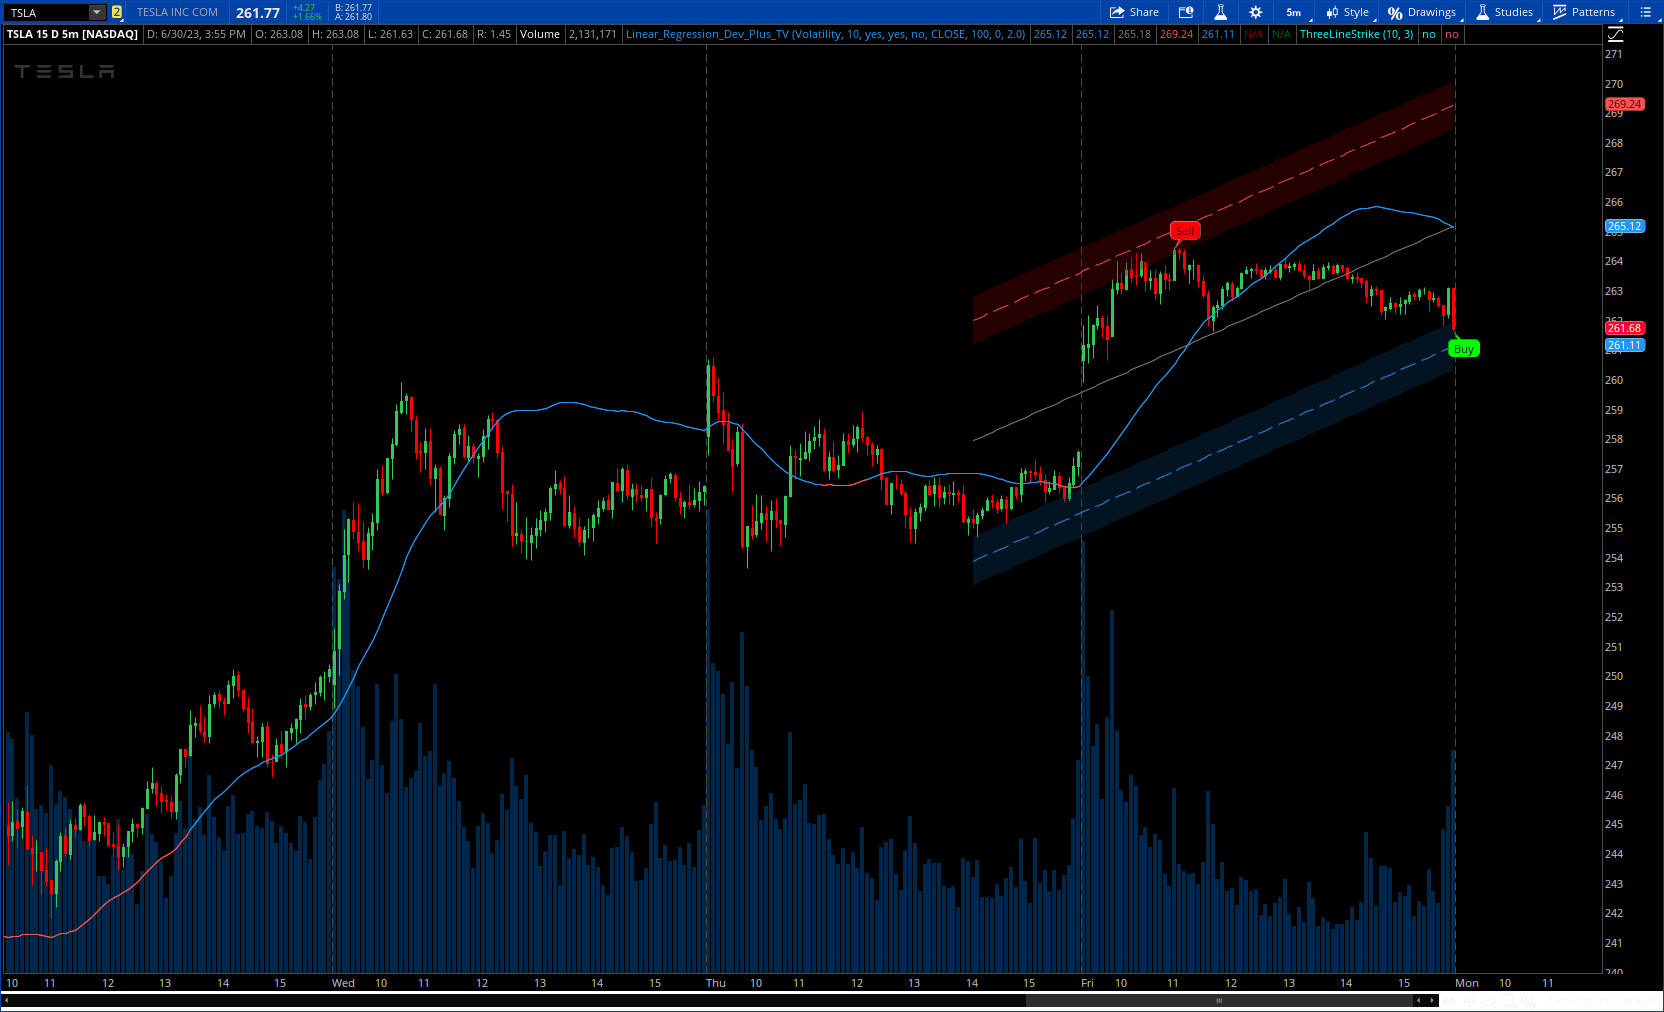
Like all trendlines, swing high / lows, pivots, etc... Regression channels repaint. The use of standard lengths of 155 have been found to help minimize the repainting effect due having more stabilizing data points
I didn't test it in live session. pls do.
the alert shouldn't repaint.
I added option for filter and atr range. Enjoy!
https://www.tradingview.com/script/HaVyhZnP-Linear-Regression/
CODE:
CSS:
#https://www.tradingview.com/v/V7OVP5LE/
#// This source code is subject to the terms of the Mozilla Public License 2.0 at https://mozilla.org/MPL/2.0/
#// © DevLucem @LucemAnb
#study("Linear Regression Dev ++", "Lin Reg Dev ++", overlay=true)
# Converted by Sam4Cok@Samer800    - 07/2023
input FilterSignals = {default "Volatility", "Volume","ADX", "Regime", "All", "None"};# 'Filter Signals by'
input filterLength  = 10;
input showSignals    = yes;
input showLinearRegCloud = yes;
input ShowLinearRegressionBand = no;
input source = close;
input length = 100;
input offset = 0;
input DeviationMulti = 2.0;    # "Deviation"

def na = Double.NaN;
def len = length;
# @regime_filter
def value1 = CompoundValue(1, 0.2 * (source - source[1]) + 0.8 * value1[1], 0.2 * (source - source[1]));
def value2 = CompoundValue(1, 0.1 * (high - low) + 0.8 * value2[1], 0.1 * (high - low));
def omega = AbsValue(value1 / value2);
def alpha = (-power(omega,2) + sqrt(power(omega, 4) + 16 * power(omega,2))) / 8;
def klmf = alpha * source + (1 - alpha) * (klmf[1]);
def absCurveSlope = AbsValue(klmf - klmf[1]);
def exponentialAverageAbsCurveSlope = 1.0 * ExpAverage(absCurveSlope, 200);
def normalized_slope_decline = (absCurveSlope - exponentialAverageAbsCurveSlope) / exponentialAverageAbsCurveSlope;
def regime = normalized_slope_decline >= - 0.5;
#volumeBreak(thres) =>
def rsivol   = RSI(Price = volume, Length = filterLength);
def osc      = HullMovingAvg(rsivol, 10);
def volumeBreak = osc > 49;
#volatilityBreak(volmin, volmax)
def volmin = ATR(LENGTH=1);
def volmax = ATR(LENGTH= filterLength);
def volatilityBreak = volmin > volmax;
def adx = ADX(LENGTH = filterLength);
def adx_vwma = WMA(adx, filterLength);
def nAdx = adx > adx_vwma;

def filter;
switch (FilterSignals) {
case "Volatility" :
    filter = volatilityBreak;
case "Volume" :
    filter = volumeBreak;
case "ADX" :
    filter = nAdx;
case "Regime" :
    filter = regime;
case "All" :
    filter = (volatilityBreak and volumeBreak and nAdx and regime);
case "None" :
    filter = yes;
}
#---Color
DefineGlobalColor("up" , CreateColor(33,150,243));
DefineGlobalColor("dup" , CreateColor(6,66,113));
DefineGlobalColor("dn" , CreateColor(255,82,82));
DefineGlobalColor("ddn" , CreateColor(121, 0, 0));
#// Main Function
#// PineScript Function
#pine_linreg(src, len, offset=0) =>
Script linreg {
input src = close;
input len = 20;
input offset = 0;
    def bar_index = AbsValue(CompoundValue(1, BarNumber(), 0));
    def x_sum = if bar_index == 0 then
                fold i = 0 to len with p do
                 p + i else x_sum[1];
    def xx_sum = if bar_index == 0 then
                fold ii = 0 to len with pp do
                 pp + ii * ii else xx_sum[1];
    def y_sum  = sum(src, len);
    def xy_sum = fold j = 0 to len with q do
                  q  + j * GetValue(src,len - 1 - j);
    def slope = (len * xy_sum - x_sum * y_sum) / (len * xx_sum - x_sum * x_sum);
    def intercept = (y_sum - slope * x_sum) / len;
    def linreg = intercept + slope * (len - 1 - offset);
    plot out = linreg;
}
def linreg   = linreg(source, len, offset);
def linreg_p = linreg(source, len, offset + 1);
def lin1     = inertia(source, len);
def midReg   = InertiaAll(source, len + 1);

plot LinRegLine = linreg;     # "Default Calculation Formula"
plot linreg1 = lin1;          # "Manual  Calculation Formula"
LinRegLine.AssignValueColor(if linreg>linreg_p then GlobalColor("up") else
                            if linreg<linreg_p then GlobalColor("dn") else Color.CYAN);
linreg1.AssignValueColor(if linreg>linreg_p then GlobalColor("up") else
                         if linreg<linreg_p then GlobalColor("dn") else Color.CYAN);
#// Calculating The Range Lines And Drawing Them
def x = highestAll(AbsValue(CompoundValue(1, BarNumber(), 0)));
def slope = linreg - linreg_p;
def intercept = linreg - (x * slope);
def deviationSum = fold i=0 to len -1 with p do
                   p + power(source[i] -(slope * (x-i) + intercept), 2);
def deviation = sqrt(deviationSum/(len));
def dev = deviation * DeviationMulti;
def stdv = highestAll(inertiaAll(dev,2));

plot b  = midReg;
plot dp = midReg + stdv;
plot dm = midReg - stdv;
b.SetDefaultColor(Color.GRAY);
dp.SetDefaultColor(GlobalColor("dn"));
dm.SetDefaultColor(GlobalColor("up"));
dp.SetStyle(Curve.MEDIUM_DASH);
dm.SetStyle(Curve.MEDIUM_DASH);
#// Posting Alerts

def dm_current = linreg - deviation * DeviationMulti;
def dp_current = linreg + deviation * DeviationMulti;

plot bandUp = if !ShowLinearRegressionBand then na else dp_current;
plot bandDn = if !ShowLinearRegressionBand then na else dm_current;
bandUp.SetDefaultColor(Color.DARK_RED);
bandDn.SetDefaultColor(Color.DARK_GREEN);

def atrdev = highestAll(inertiaAll(atr(Length=length), 2));
def atrBand = if showlinearRegCloud then atrdev else na;

AddCloud(dp + atrBand, dp - atrBand, GlobalColor("ddn"), GlobalColor("ddn"));
AddCloud(dm + atrBand, dm - atrBand, GlobalColor("dup"), GlobalColor("dup"));

#// Debugging Alert Sample
def sigUP = if source > dm - atrdev/2 and source < dm + atrdev then sigUP[1] + 1 else 0;
def sigDn = if source < dp + atrdev/2 and source > dp - atrdev then sigDn[1] + 1 else 0;
def buy  = sigUP==1 and filter;
def sell = sigDn==1 and filter;

AddChartBubble(showSignals and buy , low, "Buy", Color.GREEN, no);
AddChartBubble(showSignals and sell, high, "Sell", Color.RED, yes);

#-- END of CODE
Last edited by a moderator: