Hello,
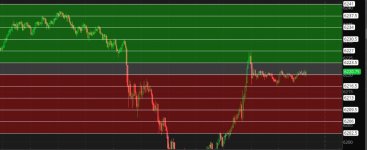
I want to draw a rectangle (the blue one shown below), duplicate it and snap it above (green) and below (red) to create a stack of 5 or more rectangles of the exact same height so it looks something like this. The snapping to each other is important as it makes it easier to stack at exact price levels. Right now, I'm having to go into each individual rectangle drawing and type in the required price levels so it stacks exactly above or below the other as well as the time/date to ensure they start at the same time.
I'd also like the rectangles to have a white border showing the meeting point between them and the price at the top and bottom of each rectangle (shown on the right of the picture before the black column showing the price scale).
Also, if possible, I'd like the bid/ask lines to be shown. The indicators I've found here haven't been that good as they were just following the candle without specifically showing the bid/ask.
If it is relevant, this is for trading ES futures on the 1 minute timeframe.
Thank you.