Author Message:
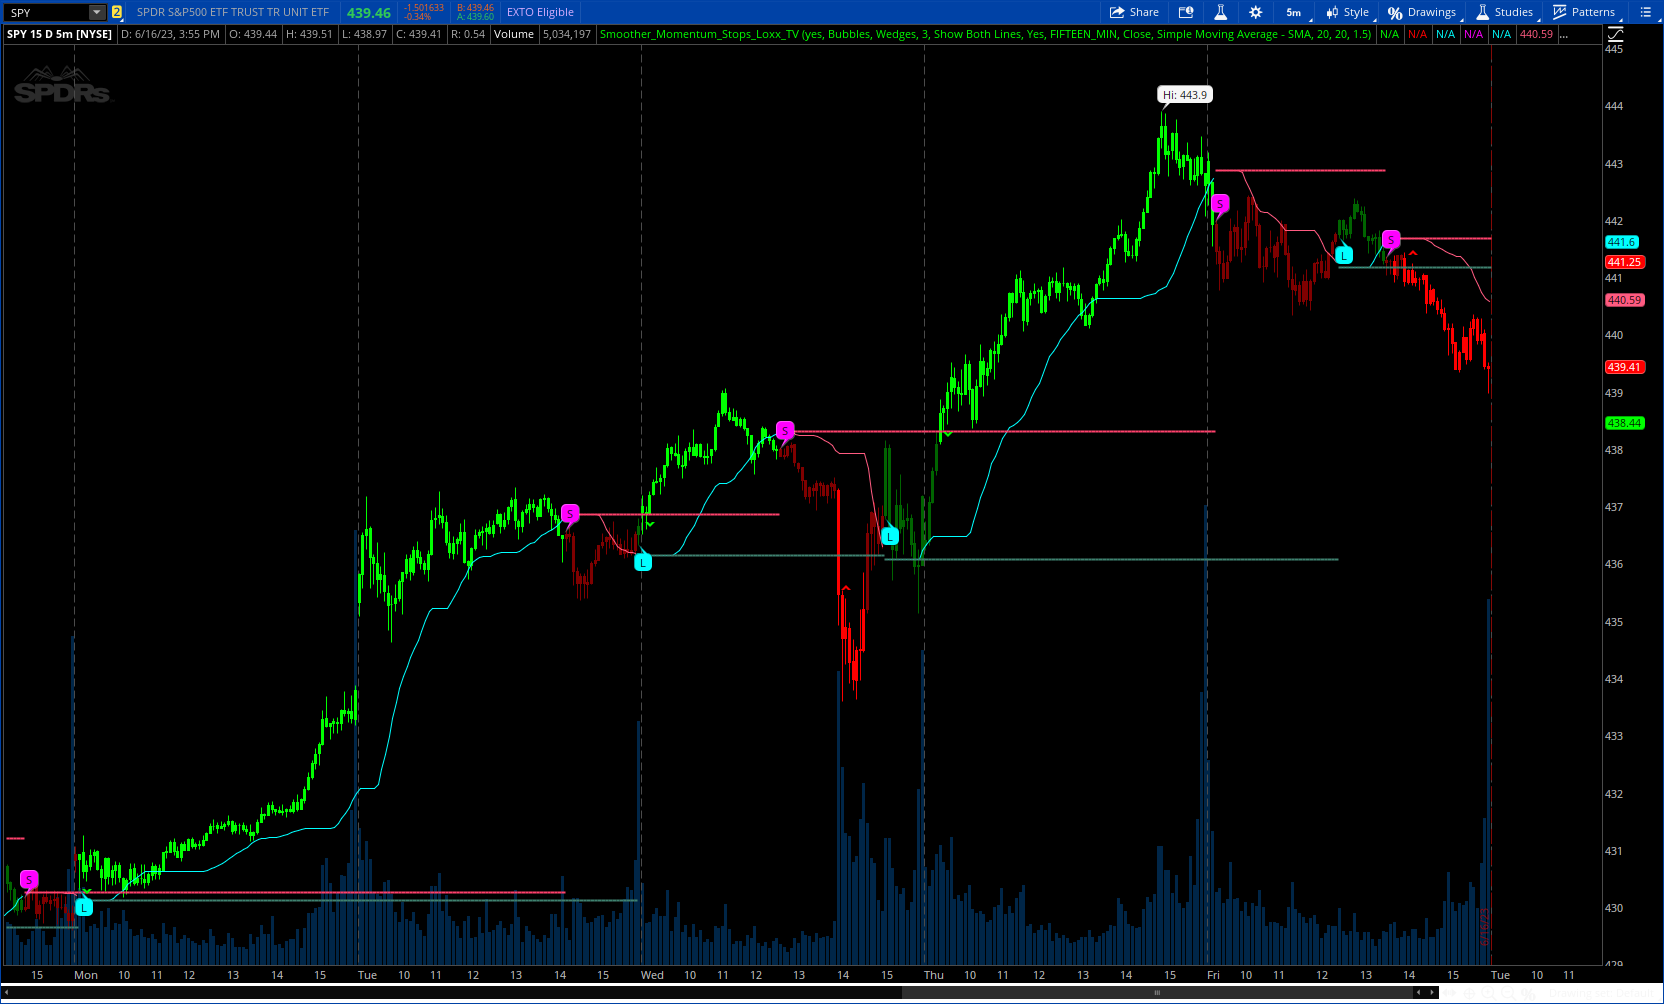
Smoother Momentum Stops (SMS) is a dynamic tool that combines the logic of momentum and moving averages to create an overlay of the market price and generate potential trade signals. The original idea for this indicator comes from the beloved and esteemed trading indicator guru Mladen Rakic.
for more details: https://www.tradingview.com/v/v8XgnKnE/
CODE:
CSS:
#/ This source code is subject to the terms of the Mozilla Public License 2.0 at https://mozilla.org/MPL/2.0/
# https://www.tradingview.com/v/v8XgnKnE/
#// © loxx
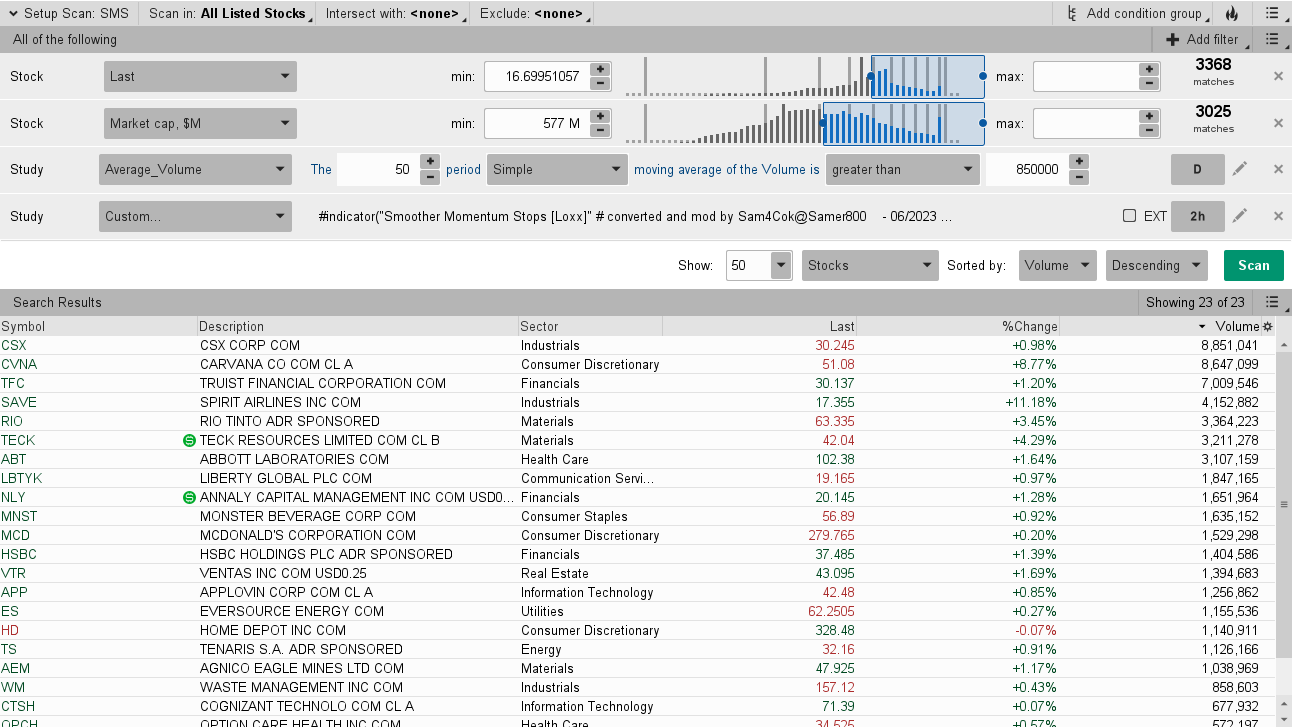
#indicator("Smoother Momentum Stops [Loxx]"
# converted and mod by Sam4Cok@Samer800 - 06/2023
input colorBars = no; # "Color bars?"
input showSignals = {Default Bubbles, Arrows, "Don't Show"}; # "Show signals?"
input showBreakSignals = {Default Bubbles, Wedges, "Don't Show"};
input noOfBreakBars = 3;
input plotOptions = {"Show Support/Resistance Lines", "Show Upper/Lower Lines",Default "Show Both Lines"};
input useChartTimeframe = {Default "Yes", "No"};
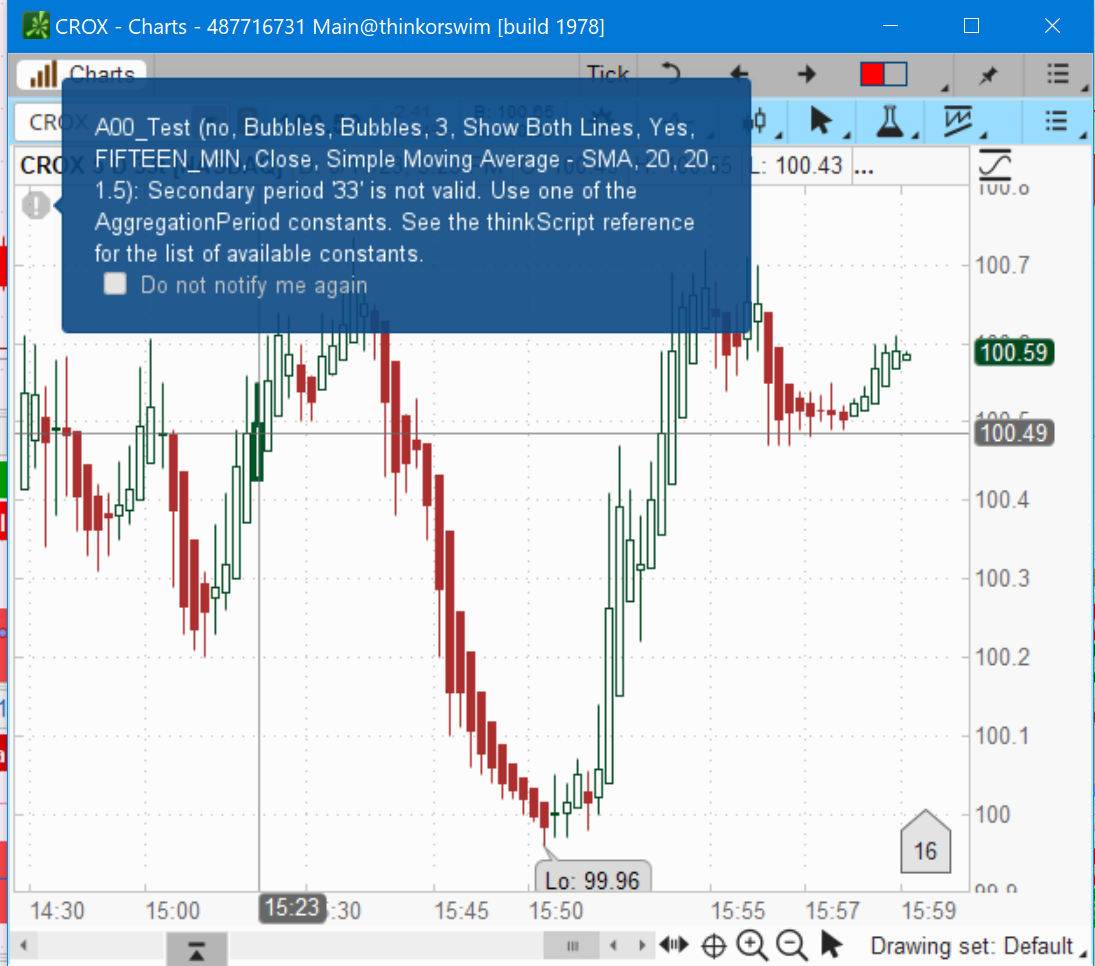
input ManualTimeframe = AggregationPeriod.FIFTEEN_MIN;
input Source = {Default "Close", "HL2", "HLC3", "OHlC4", "HLCC4"};
input AvgMethod = {"Exponential Moving Average - EMA",
"Fast Exponential Moving Average - FEMA",
"Linear Weighted Moving Average - LWMA",
Default "Simple Moving Average - SMA",
"Smoothed Moving Average - SMMA"}; # "Smoothing Type"
input MomPeriod = 20; # "Momentum Period"
input AvgPeriod = 20; # "Average Period"
input Multiplier = 1.5; # "Multiplier"
def na = Double.NaN;
def last = isNaN(close);
def chart = useChartTimeframe==useChartTimeframe."Yes";
def SupRes = plotOptions==plotOptions."Show Support/Resistance Lines" or plotOptions==plotOptions."Show Both Lines";
def UpLo = plotOptions==plotOptions."Show Upper/Lower Lines" or plotOptions==plotOptions."Show Both Lines";
def bubble = showSignals==showSignals.Bubbles;
def Arrow = showSignals==showSignals.Arrows;
def bBreak = showBreakSignals==showBreakSignals.Bubbles;
def wBreak = showBreakSignals==showBreakSignals.Wedges;
#-- Color
DefineGlobalColor("gr", CreateColor(63,130,112));
DefineGlobalColor("rd", CreateColor(255,65,108));
DefineGlobalColor("gr1", CreateColor(0,255,255));
DefineGlobalColor("rd1", CreateColor(255,91,129));
#---
script nz {
input data = close;
def ret_val = if isNaN(data) then 0 else data;
plot return = ret_val;
}
#smmom(float src, float per)=>
script smmom {
input src = close;
input per = 20;
def bar_index = AbsValue(CompoundValue(1, BarNumber(), 0));
def alphareg = 2.0 / (1.0 + per);
def alphadbl = 2.0 / (1.0 + Sqrt(per));
def ema;# = src.
def ema21;# = src
def ema22;# = src
if bar_index > 0 {
ema = CompoundValue(1, ema[1] + alphareg * (src - ema[1]), src);
ema21 = CompoundValue(1, ema21[1] + alphadbl * (src - ema21[1]), src);
ema22 = CompoundValue(1, ema22[1] + alphadbl * (ema21 - ema22[1]), src);
} else {
ema = ema[1];
ema21 = ema21[1];
ema22 = ema22[1];
}
def out = (ema22 - ema);
plot smmom = if out==0 then Double.NaN else out;
}
#fema(float src, simple int len)=>
script fema {
input src = close;
input len = 20;
def alpha = (2.0 / (2.0 + (len - 1.0) / 2.0));
def out = CompoundValue(1, out[1] + alpha * (src - out[1]), src);
plot fema = out;
}
#variant(typein, src, per)=>
script variant {
input typein = "Exponential Moving Average - EMA";
input src = close;
input per = 20;
def ma =
if typein == "Exponential Moving Average - EMA" then ExpAverage(src, per) else
if typein == "Fast Exponential Moving Average - FEMA" then fema(src, per) else
if typein == "Linear Weighted Moving Average - LWMA" then WMA(src, per) else
if typein == "Simple Moving Average - SMA" then Average(src, per) else
if typein == "Smoothed Moving Average - SMMA" then WildersAverage(src, per) else Average(src, per);
plot variant = ma;
}
def current = GetAggregationPeriod();
def tf = if chart then current else ManualTimeframe;
def inpPrice;
Switch(Source) {
Case "Close" :
inpPrice = CLOSE(Period = tf);
Case "HL2" :
inpPrice = HL2(Period = tf);
Case "HLC3" :
inpPrice = HLC3(Period = tf);
Case "OHlC4" :
inpPrice = OHlC4(Period = tf);
Case "HLCC4" :
inpPrice = (HIGH(Period = tf) + LOW(Period = tf) + CLOSE(Period = tf) + CLOSE(Period = tf)) / 4;
}
def _avg = variant(AvgMethod, inpPrice, AvgPeriod);
def _mom = Multiplier * smmom(inpPrice, MomPeriod);
def stopu;# = na
def stopd;# = na
def stopda;# = na
def stopua;# = na
if _mom > 0 {
stopu = if isNaN(stopu[1]) then _avg - _mom else max(nz(stopu[1]), _avg - _mom);
stopd = na;
stopda = na;
stopua = if isNaN(stopu[1]) then stopu else na;
} else
if _mom < 0 {
stopd = if isNaN(stopd[1]) then _avg - _mom else min(nz(stopd[1]), _avg - _mom);
stopu = na;
stopua = na;
stopda = if isNaN(stopd[1]) then stopd else na;
} else {
stopd = na;
stopu = na;
stopua = na;
stopda = na;
}
def goLong = !isNaN(stopu) and !isNaN(stopd[1]);
def goShort = !isNaN(stopd) and !isNaN(stopu[1]);
def support = if !isNaN(stopua) then stopua else support[1];
def resistance = if !isNaN(stopda) then stopda else resistance[1];
def extUp = !isNaN(stopu) and inpPrice>resistance;
def WeakUp = !isNaN(stopu);
def extDn = !WeakUp and inpPrice<support;
def WeakDn = !WeakUp;
def bUp = if extUp then bUp[1] + 1 else 0;
def bDn = if extDn then bDn[1] + 1 else 0;
#-- Plots
plot breakUp = if wBreak and bUp==noOfBreakBars then low else na;
plot breakDn = if wBreak and bDn==noOfBreakBars then high else na;
breakUp.SetPaintingStrategy(paintingStrategy.BOOLEAN_WEDGE_DOWN);
breakDn.SetPaintingStrategy(paintingStrategy.BOOLEAN_WEDGE_UP);
breakUp.SetDefaultColor(Color.GREEN);
breakDn.SetDefaultColor(Color.RED);
breakUp.SetLineWeight(2);
breakDn.SetLineWeight(2);
plot sqUp = if Arrow and goLong then low else na;
plot sqDn = if Arrow and goShort then high else na;
sqUp.SetPaintingStrategy(paintingStrategy.BOOLEAN_ARROW_UP);
sqDn.SetPaintingStrategy(paintingStrategy.BOOLEAN_ARROW_DOWN);
sqUp.SetDefaultColor(Color.CYAN);
sqDn.SetDefaultColor(Color.MAGENTA);
sqUp.SetLineWeight(2);
sqDn.SetLineWeight(2);
plot Upper = if (UpLo and !isNaN(stopu)) then stopu else na; # "Upper"
plot Lower = if (UpLo and !isNaN(stopd)) then stopd else na; # "Lower"
Upper.SetDefaultColor(GlobalColor("gr1"));
Lower.SetDefaultColor(GlobalColor("rd1"));
plot supLine = if last or !SupRes then na else support;
plot resLine = if last or !SupRes then na else resistance;
supLine.SetPaintingStrategy(PaintingStrategy.DASHES);
resLine.SetPaintingStrategy(PaintingStrategy.DASHES);
supLine.SetDefaultColor(GlobalColor("gr"));
resLine.SetDefaultColor(GlobalColor("rd"));
supLine.SetLineWeight(2);
resLine.SetLineWeight(2);
#-- Bubbles
AddChartBubble(bubble and goLong, low, "L", Color.CYAN, no);
AddChartBubble(bubble and goShort, high, "S", Color.MAGENTA, yes);
AddChartBubble(bBreak and bUp==noOfBreakBars, low, "Break", Color.GREEN, no);
AddChartBubble(bBreak and bDn==noOfBreakBars, high, "Break", Color.RED, yes);
#-- Bar Color
AssignPriceColor(if !colorBars then Color.CURRENT else
if extUp then Color.GREEN else
if WeakUp then Color.DARK_GREEN else
if extDn then Color.RED else
if WeakDn then Color.DARK_RED else Color.GRAY);
#-- END of CODE