
Author Message:
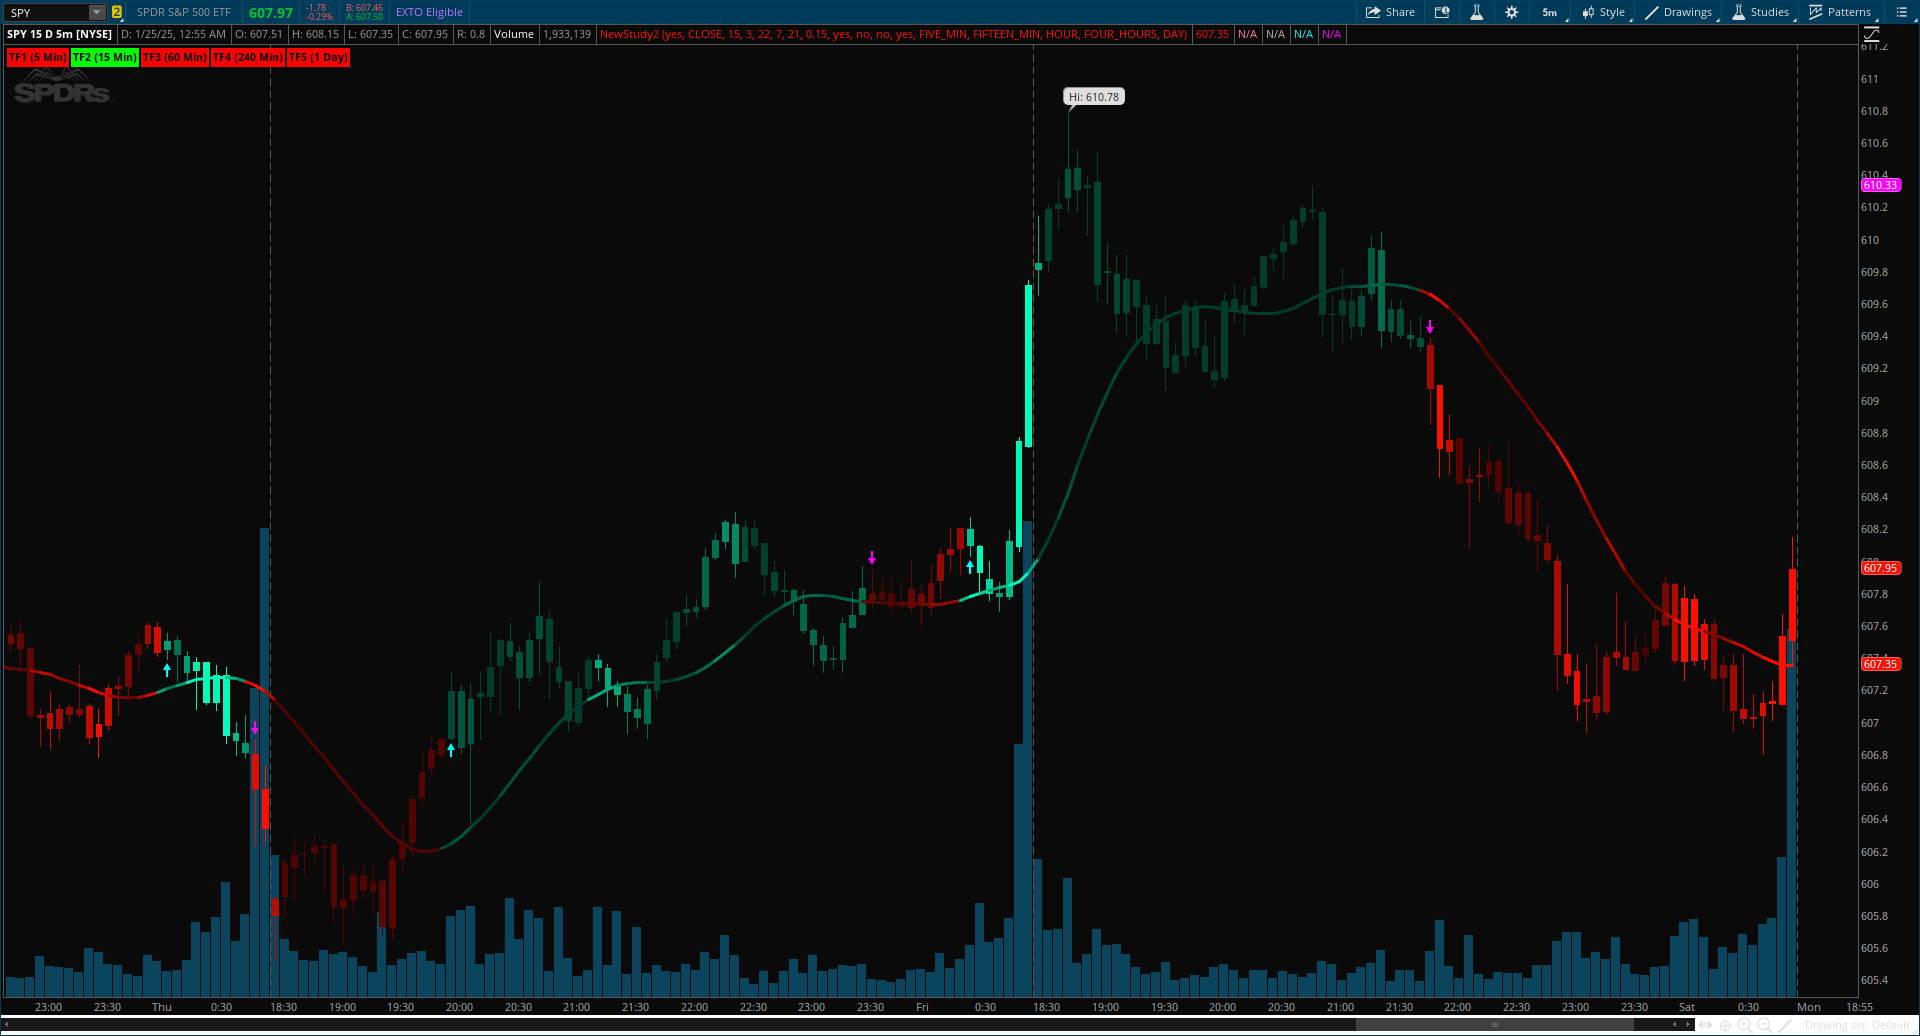
Experience seamless trend detection and market analysis with the Smoothed Gaussian Trend Filter by AlgoAlpha! This cutting-edge indicator combines advanced Gaussian filtering with linear regression smoothing to identify and enhance market trends, making it an essential tool for traders seeking precise and actionable signals.
More Details: https://www.tradingview.com/v/mCGycOyz/
CODE:
CSS:
#// Indicator for TOS
#//@AlgoAlpha
#indicator("Smoothed Gaussian Trend Filter [AlgoAlpha]", "AlgoAlpha - Smoothed Gaussian Trend"
#Hint showTabel: Enables/Disables the table.
#Hint GaussianLength: Period used to calculate the Gaussian alpha.
#Hint Poles: Order of the Gaussian filter, affects smoothness.
#Hint LinearRegLength: Length for linear regression smoothing applied on the gaussian line.
#Hint LinearRegOffset: Offset for flattening the output, making it less wavey.
#Hint volumeIntensity: Highlight based on volume intensity.
#Hint MidTrendSignals: Enable additional buy/sell signals during trends.
#Hint TrailingBands: Enables/Disables Trend Bands.
# Converted by Sam4Cok@Samer800    - 01/2025

input colorBars = yes;       # "Bar Color"
input GaussianSource = FundamentalType.CLOSE;
input GaussianLength = 15;         # "Gaussian Length"
input Poles = 3;                   # "Poles"
input LinearRegLength = 22;        # "Smoothing Length"
input LinearRegOffset = 7;         # "Flatten Multiplier"
input supertrendLength = 21;
input supertrendFactor = 0.15;
input volumeIntensity = yes; # "Appearance"
input MidTrendSignals = no;  # "Mid-Trend Signals"
input TrailingBands = no;    # "Trailing Bands"
input showTabel = yes;             # "Enable Table"
input timeframe1 = AggregationPeriod.FIVE_MIN;     # "Time frame 1"
input timeframe2 = AggregationPeriod.FIFTEEN_MIN;  # "Time frame 2"
input timeframe3 = AggregationPeriod.HOUR;         # "Time frame 3"
input timeframe4 = AggregationPeriod.FOUR_HOURS;   # "Time frame 4"
input timeframe5 = AggregationPeriod.DAY;          # "Time frame 5"

def na = Double.NaN;
def last = IsNaN(close);
def src = Fundamental(FundamentalType = GaussianSource);

script linReg {
    input y = close;
    input len = 20;
    input offset = 5;
    def x = x[1] + 1;
    def sumXY = Sum(x * y, len);
    def sumX  = Sum(x, len);
    def sumY  = Sum(y, len);
    def sumSrX = Sum(Sqr(x), len);
    def a = (len * sumXY - sumX * sumY) / (len * sumSrX - Sqr(sumX));
    def b = (sumSrX * sumY - sumX * sumXY) / (len * sumSrX - Sqr(sumX));
    def linreg = a * (x - offset) + b;
    plot out = linreg;
}
Script supertrend {
input src = hl2;
input factor = 3;
input atrPeriod = 10;
    def tr = if isNaN(high[1]) then (high - low) else
             if !high[1] then (high - low) else TrueRange(high, close, low);
    def atr = WildersAverage(tr, atrPeriod);
    def upBand = src + factor * atr;
    def loBand = src - factor * atr;
    def lowerBand; def upperBand;
    def prevLowerBand = if isNaN(lowerBand[1]) then loBand else
                        if !lowerBand[1] then loBand else lowerBand[1];
    def prevUpperBand = if isNaN(upperBand[1]) then upBand else
                        if !upperBand[1] then upBand else upperBand[1];
    lowerBand = if loBand > prevLowerBand or src[1] < prevLowerBand then loBand else prevLowerBand;
    upperBand = if upBand < prevUpperBand or src[1] > prevUpperBand then upBand else prevUpperBand;
    def _direction;
    def superTrend;
    def prevSuperTrend = superTrend[1];
    if isNaN(atr[1]) {
        _direction = 1;
   } else if !atr[1] {
        _direction = 1;
    } else if prevSuperTrend == prevUpperBand {
        _direction = if src > upperBand then -1 else 1;
    } else {
        _direction = if src < lowerBand then 1 else -1;
    }
    superTrend = if _direction == -1 then lowerBand else upperBand;
    plot st  = superTrend;
    }
Script supertrendMTF {
input src = hl2;
input factor = 3;
input atrPeriod = 10;
input tf = 300000;
    def tr = if isNaN(high(Period = tf)[1]) then (high(Period = tf) - low(Period = tf)) else
             if !high(Period = tf)[1] then (high(Period = tf) - low(Period = tf)) else
                TrueRange(high(Period = tf), close(Period = tf), low(Period = tf));
    def atr = WildersAverage(tr, atrPeriod);
    def upBand = src + factor * atr;
    def loBand = src - factor * atr;
    def lowerBand; def upperBand;
    def prevLowerBand = if isNaN(lowerBand[1]) then loBand else
                        if !lowerBand[1] then loBand else lowerBand[1];
    def prevUpperBand = if isNaN(upperBand[1]) then upBand else
                        if !upperBand[1] then upBand else upperBand[1];
    lowerBand = if loBand > prevLowerBand or src[1] < prevLowerBand then loBand else prevLowerBand;
    upperBand = if upBand < prevUpperBand or src[1] > prevUpperBand then upBand else prevUpperBand;
    def _direction;
    def superTrend;
    def prevSuperTrend = superTrend[1];
    if isNaN(atr[1]) {
        _direction = 1;
   } else if !atr[1] {
        _direction = 1;
    } else if prevSuperTrend == prevUpperBand {
        _direction = if src > upperBand then -1 else 1;
    } else {
        _direction = if src < lowerBand then 1 else -1;
    }
    superTrend = if _direction == -1 then lowerBand else upperBand;
    plot st  = superTrend;
    }

script calcGaussianAlpha {
    input _length = 15;
    input _poles = 3;
    def pi = Double.Pi;
    def _order = Min(Max(_poles, 1), 4);
    def freq = (2.0 * pi) / _length;
    def factorB = (1.0 - Cos(freq)) / (Power(1.414, (2.0 / _order)) - 1.0);
    def alphaVal = -factorB + Sqrt(factorB * factorB + 2.0 * factorB);
    plot out = alphaVal;
}
script gaussianSmooth {
    input dataIn = close;
    input poles = 3;
    input alphaCoeff = 1;
    def filterLevel = Min(Max(poles, 1), 4);
    def oneMinusAlpha = 1.0 - alphaCoeff;
    def alphaSquared  = alphaCoeff * alphaCoeff;
    def alphaCubed    = alphaCoeff * alphaCoeff * alphaCoeff;
    def alpha4        = alphaCoeff * alphaCoeff * alphaCoeff * alphaCoeff;
    def omaSquared    = oneMinusAlpha * oneMinusAlpha;
    def omaCubed      = omaSquared * oneMinusAlpha;
    def oma4          = omaCubed * oneMinusAlpha;
    def runningFilterValue;
    if filterLevel == 1 {
        runningFilterValue = alphaCoeff * dataIn +
                              oneMinusAlpha * runningFilterValue[1];
    } else if filterLevel == 2 {
        runningFilterValue = alphaSquared * dataIn
                                  + 2.0 * oneMinusAlpha * runningFilterValue[1]
                                  - omaSquared * runningFilterValue[2];
    } else if filterLevel == 3 {
        runningFilterValue = alphaCubed * dataIn
                                  + 3.0 * oneMinusAlpha * runningFilterValue[1]
                                  - 3.0 * omaSquared * runningFilterValue[2]
                                  + omaCubed * runningFilterValue[3];
    } else if filterLevel == 4 {
        runningFilterValue = alpha4 * dataIn
                                  + 4.0 * oneMinusAlpha * runningFilterValue[1]
                                  - 6.0 * omaSquared * runningFilterValue[2]
                                  + 4.0 * omaCubed * runningFilterValue[3]
                                  - oma4 * runningFilterValue[4];
    } else {
        runningFilterValue = runningFilterValue[1];
    }
    plot out = runningFilterValue;
}
##// ~~ Gradient Coloring {
Script gradient_color {
input src = close;
input minVal = 10;
input maxVal = 400;
input loR = 173;
input loG = 216;
input loB = 230;
input hiR = 41;
input hiG = 98;
input hiB = 255;
    def value = if isNaN(src) then 0 else src;
    def clamped_value = max(min(value, maxVal), minVal);
    def normalized_value = (clamped_value - minVal) / (maxVal - minVal);
    def re = floor(loR + (hiR - loR) * normalized_value);
    def gr = floor(loG + (hiG - loG) * normalized_value);
    def bl = floor(loB + (hiB - loB) * normalized_value);
    plot r = re;
    plot g = gr;
    plot b = bl;
}
def alphaValue = calcGaussianAlpha(GaussianLength, Poles);
def gmaOutput = gaussianSmooth(src, Poles, alphaValue);
def final = linReg(gmaOutput, LinearRegLength, LinearRegOffset);
def ST  = supertrend(final, supertrendFactor, supertrendLength);
def linTrend = if final > final[1] then 1 else -1;
def stTrend = if final > ST then 1 else -1;
def ranging = MidTrendSignals and ((linTrend * stTrend) < 0);

def vol_filt = 99;
def z = 33;
def hhVol = highest(volume, z);
def llVol = lowest(volume, z);
def s_vol = HullMovingAvg((volume - llVol) / (hhVol - llVol), 4);
def transparency = vol_filt - Max(min(100 - s_vol * 100, vol_filt), 1);
def dist = Average(AbsValue(close - open), 100);

def rUp = gradient_color(transparency, 1, vol_filt, 0, 59, 43, 0, 255, 187).r;
def gUp = gradient_color(transparency, 1, vol_filt, 0, 59, 43, 0, 255, 187).g;
def bUp = gradient_color(transparency, 1, vol_filt, 0, 59, 43, 0, 255, 187).b;
def rDn = gradient_color(transparency, 1, vol_filt, 78, 5, 0, 255, 17, 0).r;
def gDn = gradient_color(transparency, 1, vol_filt, 78, 5, 0, 255, 17, 0).g;
def bDn = gradient_color(transparency, 1, vol_filt, 78, 5, 0, 255, 17, 0).b;

# plot
plot main = if !last and final then final else na;
main.SetLineWeight(3);
main.AssignValueColor(if ranging then Color.GRAY else
                      if stTrend > 0 then if volumeIntensity then CreateColor(rUp, gUp, bUp) else Color.GREEN else
                                         if volumeIntensity then CreateColor(rDn, gDn, bDn) else Color.RED);

plot bull = if !last and TrailingBands and stTrend > 0 then final - dist * 2 else na;
plot bear = if !last and TrailingBands and stTrend < 0 then final + dist * 2 else na;
bull.AssignValueColor(if ranging then Color.GRAY else
                      if stTrend > 0 then if volumeIntensity then CreateColor(rUp, gUp, bUp) else Color.GREEN else
                                         if volumeIntensity then CreateColor(rDn, gDn, bDn) else Color.RED);
bear.AssignValueColor(if ranging then Color.GRAY else
                      if stTrend > 0 then if volumeIntensity then CreateColor(rUp, gUp, bUp) else Color.GREEN else
                                         if volumeIntensity then CreateColor(rDn, gDn, bDn) else Color.RED);
#-- Cloud
def up1 = !ranging and stTrend > 0;
def up2 = !ranging and stTrend > 0 and transparency > 45;
def up3 = !ranging and stTrend > 0 and transparency > 70;
def dn1 = !ranging and stTrend <= 0;
def dn2 = !ranging and stTrend <= 0 and transparency > 45;
def dn3 = !ranging and stTrend <= 0 and transparency > 70;

AddCloud(if (ranging or ranging[-1]) then main else na, bull, Color.GRAY);
AddCloud(if (ranging or ranging[-1]) then bear else na, main, Color.GRAY);

AddCloud(if up1 then main else na, bull, CreateColor(0, 59, 43));
AddCloud(if up2 then main else na, bull, Color.DARK_GREEN);
AddCloud(if up3 then main else na, bull, CreateColor(0, 255, 187));

AddCloud(if dn1 then bear else na, main, CreateColor(78, 5, 0));
AddCloud(if dn2 then bear else na, main, Color.DARK_RED);
AddCloud(if dn3 then bear else na, main, CreateColor(255, 17, 0));

#-- Signals

def h = max(Max(highest(high, 14), highest(final, 14)), final + dist * 2);
def l = min(Min(lowest(low, 14), lowest(final, 14)), final - dist * 2);

plot SigUp = if stTrend > 0 and (if MidTrendSignals then !ranging and ranging[1] else stTrend[1] < 0) then l else na; # "Bullish Signal"
plot SigDn = if stTrend < 0 and (if MidTrendSignals then !ranging and ranging[1] else stTrend[1] > 0) then h else na; # "Bearish Signal"

SigUp.SetPaintingStrategy(PaintingStrategy.BOOLEAN_ARROW_UP);
SigDn.SetPaintingStrategy(PaintingStrategy.BOOLEAN_ARROW_DOWN);
SigUp.SetDefaultColor(Color.CYAN);
SigDn.SetDefaultColor(Color.MAGENTA);

AddChartBubble(SigUp, bull, "", Color.GREEN, no);
AddChartBubble(SigDn, bear, "", Color.RED);

#-- BAr Color
AssignPriceColor(if !colorBars then Color.CURRENT else
                 if ranging then Color.GRAY else
                 if stTrend > 0 then if volumeIntensity then CreateColor(rUp, gUp, bUp) else Color.GREEN else
                                    if volumeIntensity then CreateColor(rDn, gDn, bDn) else Color.RED);

#-- HTF Cals
def cap = GetAggregationPeriod();
def t1 = Max(cap, timeframe1);
def t2 = Max(cap, timeframe2);
def t3 = Max(cap, timeframe3);
def t4 = Max(cap, timeframe4);
def t5 = Max(cap, timeframe5);
def src1 = Fundamental(FundamentalType = GaussianSource, Period = t1);
def src2 = Fundamental(FundamentalType = GaussianSource, Period = t2);
def src3 = Fundamental(FundamentalType = GaussianSource, Period = t3);
def src4 = Fundamental(FundamentalType = GaussianSource, Period = t4);
def src5 = Fundamental(FundamentalType = GaussianSource, Period = t5);


def gmaOutput1 = gaussianSmooth(src1, Poles, alphaValue);
def gmaOutput2 = gaussianSmooth(src2, Poles, alphaValue);
def gmaOutput3 = gaussianSmooth(src3, Poles, alphaValue);
def gmaOutput4 = gaussianSmooth(src4, Poles, alphaValue);
def gmaOutput5 = gaussianSmooth(src5, Poles, alphaValue);
def final1 = linReg(gmaOutput1, LinearRegLength, LinearRegOffset);
def final2 = linReg(gmaOutput2, LinearRegLength, LinearRegOffset);
def final3 = linReg(gmaOutput3, LinearRegLength, LinearRegOffset);
def final4 = linReg(gmaOutput4, LinearRegLength, LinearRegOffset);
def final5 = linReg(gmaOutput5, LinearRegLength, LinearRegOffset);
def ST1  = supertrendMTF(final1, supertrendFactor, supertrendLength, t1);
def ST2  = supertrendMTF(final2, supertrendFactor, supertrendLength, t2);
def ST3  = supertrendMTF(final3, supertrendFactor, supertrendLength, t3);
def ST4  = supertrendMTF(final4, supertrendFactor, supertrendLength, t4);
def ST5  = supertrendMTF(final5, supertrendFactor, supertrendLength, t5);
def linTrend1 = if final1 > final1[1] then 1 else -1;
def linTrend2 = if final2 > final2[1] then 1 else -1;
def linTrend3 = if final3 > final3[1] then 1 else -1;
def linTrend4 = if final4 > final4[1] then 1 else -1;
def linTrend5 = if final5 > final5[1] then 1 else -1;
def stTrend1 = if final1 > ST1 then 1 else -1;
def stTrend2 = if final2 > ST2 then 1 else -1;
def stTrend3 = if final3 > ST3 then 1 else -1;
def stTrend4 = if final4 > ST4 then 1 else -1;
def stTrend5 = if final5 > ST5 then 1 else -1;
def ranging1 = MidTrendSignals and ((linTrend1 * stTrend1) < 0);
def ranging2 = MidTrendSignals and ((linTrend2 * stTrend2) < 0);
def ranging3 = MidTrendSignals and ((linTrend3 * stTrend3) < 0);
def ranging4 = MidTrendSignals and ((linTrend4 * stTrend4) < 0);
def ranging5 = MidTrendSignals and ((linTrend5 * stTrend5) < 0);

def s1 = if ranging1 then 0 else if stTrend1 > 0 then 1 else -1;
def s2 = if ranging2 then 0 else if stTrend2 > 0 then 1 else -1;
def s3 = if ranging3 then 0 else if stTrend3 > 0 then 1 else -1;
def s4 = if ranging4 then 0 else if stTrend4 > 0 then 1 else -1;
def s5 = if ranging5 then 0 else if stTrend5 > 0 then 1 else -1;

def m1 = t1 < AggregationPeriod.DAY;
def m2 = t2 < AggregationPeriod.DAY;
def m3 = t3 < AggregationPeriod.DAY;
def m4 = t4 < AggregationPeriod.DAY;
def m5 = t5 < AggregationPeriod.DAY;

def tf1 = if m1 then AggregationPeriod.MIN else AggregationPeriod.DAY;
def tf2 = if m2 then AggregationPeriod.MIN else AggregationPeriod.DAY;
def tf3 = if m3 then AggregationPeriod.MIN else AggregationPeriod.DAY;
def tf4 = if m4 then AggregationPeriod.MIN else AggregationPeriod.DAY;
def tf5 = if m5 then AggregationPeriod.MIN else AggregationPeriod.DAY;


AddLabel(showTabel,"TF1 (" + t1/tf1 + (if m1 then " Min)" else " Day)"),
                    if s1>0 then Color.GREEN else if s1<0 then Color.RED else Color.GRAY);
AddLabel(showTabel,"TF2 (" + t2/tf2 + (if m2 then " Min)" else " Day)"),
                    if s2>0 then Color.GREEN else if s2<0 then Color.RED else Color.GRAY);
AddLabel(showTabel,"TF3 (" + t3/tf3 + (if m3 then " Min)" else " Day)"),
                    if s3>0 then Color.GREEN else if s3<0 then Color.RED else Color.GRAY);
AddLabel(showTabel,"TF4 (" + t4/tf4 + (if m4 then " Min)" else " Day)"),
                    if s4>0 then Color.GREEN else if s4<0 then Color.RED else Color.GRAY);
AddLabel(showTabel,"TF5 (" + t5/tf5 + (if m5 then " Min)" else " Day)"),
                    if s5>0 then Color.GREEN else if s5<0 then Color.RED else Color.GRAY);
#-- END of CODE