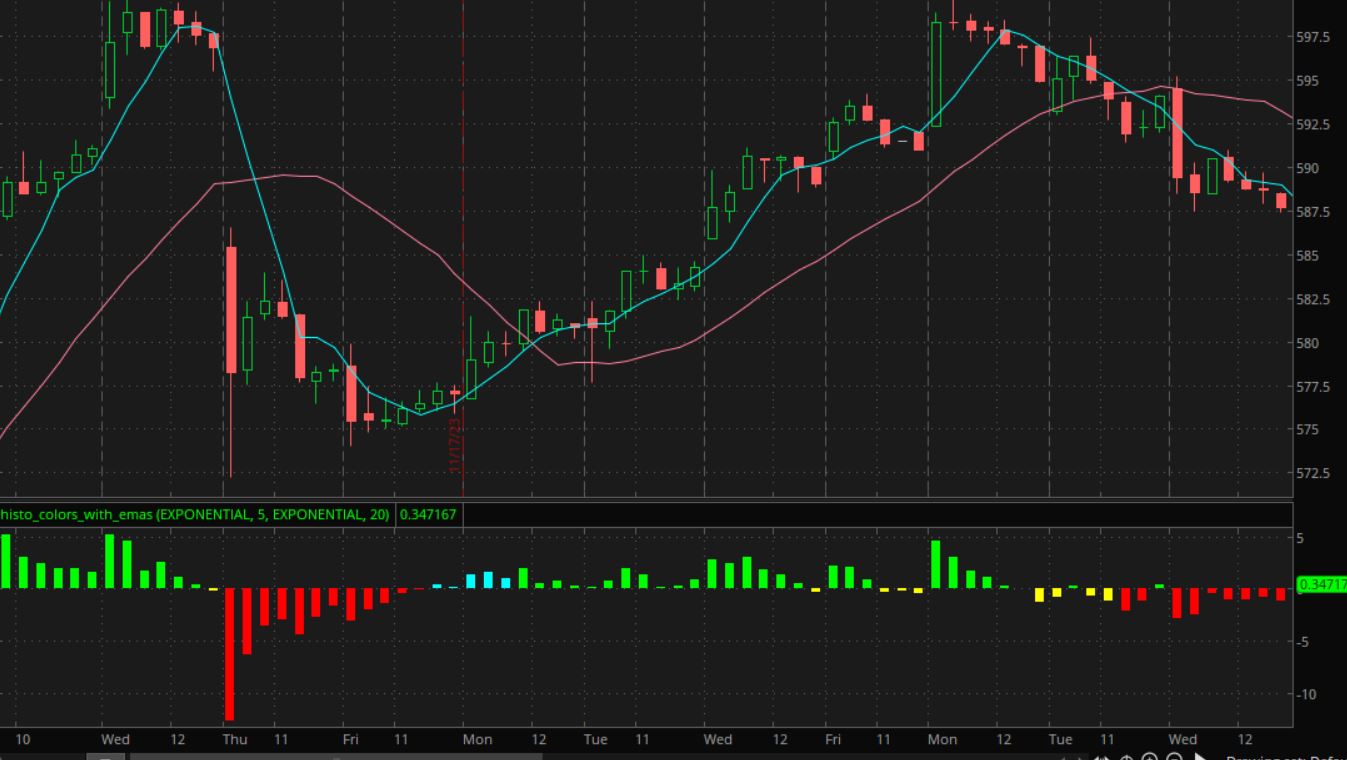
I am attempting to have a histogram that plots green bars when in uptrend. Uptrend is when price is above 20 ema and 5ema (Both ema's) If price goes below 5 ema (ema2) then Histo bar is yellow and visa versa for downtrend. At the moment I am only getting bars when price crosses the ema's and not while price is above or below and I am not getting a pullback (yellow) bar at all. Thanks in advance!
Code:
# Trend_Pullback_Indicator

input emaLength1 = 20;
input emaLength2 = 5;

def closePrice = close;
def ema1 = ExpAverage(closePrice, emaLength1);
def ema2 = ExpAverage(closePrice, emaLength2);

def isUptrend = close > ema1 and close[1] <= ema1[1];
def isDowntrend = close < ema1 and close[1] >= ema1[1];

def isPullbackUp = close > ema1 and close <= ema2;
def isPullbackDown = close < ema1 and close >= ema2;

def histogramValue = if isUptrend or isDowntrend then close - ema1 else Double.NaN;

plot histogram = histogramValue;
histogram.SetPaintingStrategy(PaintingStrategy.HISTOGRAM);
histogram.SetLineWeight(3);
histogram.AssignValueColor(if isUptrend then Color.GREEN else if isDowntrend then Color.RED else if isPullbackUp or isPullbackDown then Color.YELLOW else Color.GRAY);