Simple moving averages close together

SwervinMervin

New member
VIP
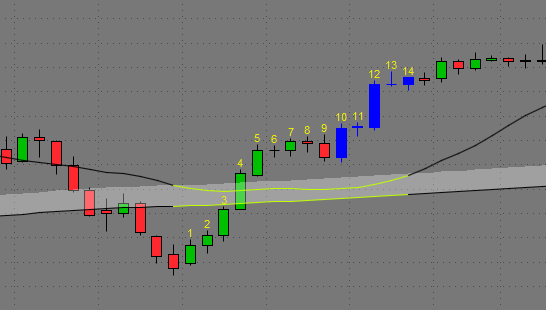
I'm BEGGING for someone to be able to write code in the thinkscript editor to be able to scan for the 20 SMA and 200 SMA within (x) percent away from each other for (x) amount of bars.
For example, creating a scan for 20 SMA and 200 SMA within 1% apart from each other (staying within 1%) for 10 bars. Doesn't matter which SMA is on top.. so long as within the 10 bars, they don't seperate more than 1% of distance from each other.

The main objective is to be able to scan for a stock that has its 20 SMA and 200 SMA close in proximity to each other for a decent amount of time.. lets say .. at least for 10 bars.

Please please please!!! Anybody
 

Join useThinkScript to post your question to a community of 21,000+ developers and traders.

Hey Mr. Ben. Thank you so much for the response. I do humbly appreciate it. I'm excited to do a deep dive into this community.

What you provided in response wasn't quite was I was asking for, but it might have been me not explaining it clearly.

If I may, let's take the stock DAL for example. Using the 20 SMA and the 200 SMA (which are the only moving averages i'm interested in)... Look how close those particularly moving averages are close together on the daily chart from 4/13/23 to 5/17/23. This is about 25 bars on the daily. That's what I'm looking for. It doens't have to be touching like that, but close and for a certain amount of bars.

I'm looking to make a scanner that can detect whenever any stock's 20 SMAs and 200 SMAs are within a certain percentage of each other (doesn't matter if the 20 is on top or bottom) so long as they're within a certain percentage of distance from each other but..also for an (x) amount bars.

Thank you so much for everything that you do !! I've joined yesterday and I'm already so excited.
 
Code:
input Dist = 1;
input Length = 10;
def MA200 =
    simpleMovingAvg(close,200);
def MA20 =
    simpleMovingAvg(close,20);
def PctDist =
    (Max(MA200,Ma20) - Min(Ma200,Ma20)) / Min(Ma200,Ma20) * 100;
def Consec =
    Sum(PctDist <= Dist,Length) == Length;
plot Scan = Consec;

pnH8Kwu.png
 

Similar threads

Not the exact question you're looking for?

Start a new thread and receive assistance from our community.

87k+ Posts
326 Online
Create Post

Similar threads

Similar threads

The Market Trading Game Changer

Join 2,500+ subscribers inside the useThinkScript VIP Membership Club
  • Exclusive indicators
  • Proven strategies & setups
  • Private Discord community
  • ‘Buy The Dip’ signal alerts
  • Exclusive members-only content
  • Add-ons and resources
  • 1 full year of unlimited support

Frequently Asked Questions

What is useThinkScript?

useThinkScript is the #1 community of stock market investors using indicators and other tools to power their trading strategies. Traders of all skill levels use our forums to learn about scripting and indicators, help each other, and discover new ways to gain an edge in the markets.

How do I get started?

We get it. Our forum can be intimidating, if not overwhelming. With thousands of topics, tens of thousands of posts, our community has created an incredibly deep knowledge base for stock traders. No one can ever exhaust every resource provided on our site.

If you are new, or just looking for guidance, here are some helpful links to get you started.

What are the benefits of VIP Membership?
VIP members get exclusive access to these proven and tested premium indicators: Buy the Dip, Advanced Market Moves 2.0, Take Profit, and Volatility Trading Range. In addition, VIP members get access to over 50 VIP-only custom indicators, add-ons, and strategies, private VIP-only forums, private Discord channel to discuss trades and strategies in real-time, customer support, trade alerts, and much more. Learn all about VIP membership here.
How can I access the premium indicators?
To access the premium indicators, which are plug and play ready, sign up for VIP membership here.
Back
Top