
Author Message:
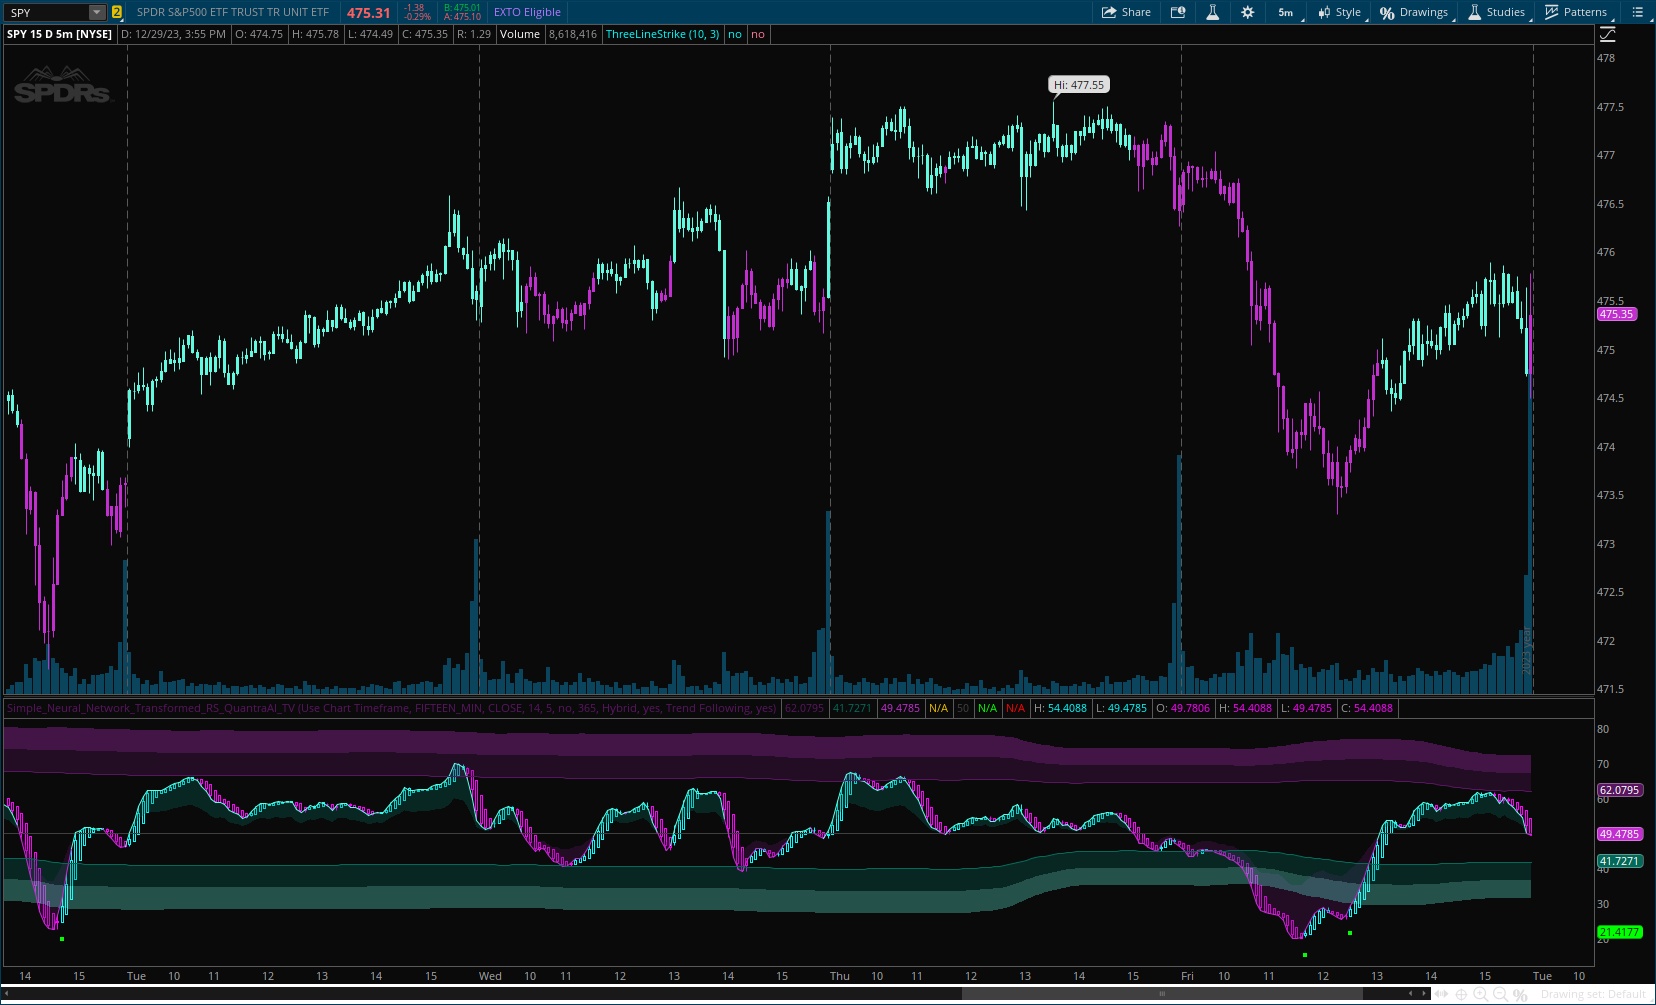
The Simple Neural Network Transformed RSI (ɴɴᴛ ʀsɪ) stands out as a formidable tool for traders who specialize in lower timeframe trading.
It is an innovative enhancement of the traditional RSI readings with simple neural network smoothing techniques.
This unique blend results in fairly accurate signals, tailored for swift market movements. The ɴɴᴛ ʀsɪ is particularly resistant to the usual market noise found in lower timeframes, ensuring a clearer view of short-term trends.
Furthermore, its diverse range of visualization options adds versatility, making it a valuable tool for traders seeking to capitalize on short-duration market dynamics.
More details: https://www.tradingview.com/v/6qTxRYB1/
CODE:
CSS:
#//https://www.tradingview.com/v/6qTxRYB1/
#// This source code is subject to the terms of the Mozilla Public License 2.0
#// © QuantraAI
#indicator("Simple Neural Network Transformed RSI [QuantraAI]", "??? ?s? [QuantraAI]"
# Converted by Sam4Cok@Samer800    - 01/2024
declare lower;
input timeframe = {Default "Use Chart Timeframe", "Custom Timefram"};
input customTimeframe = AggregationPeriod.FIFTEEN_MIN;
input Source = FundamentalType.CLOSE;    # "Source"
input rsiLength = 14;                    # "RSI Length"
input nnLength  = 5;                     # "NN Input Length"
input MedianCrossInsteadOfMidLineCross = no; # "Median cross instead of Mid line cross"
input MedianLength = 365;                    # "Median Length"
input DisplayVariant = {default "Hybrid", "Heikin-Ashi", "Classic"};    # "Display Variant"
input HollowCandles  = yes;                  # "Hollow Candles"
input barColorType = {default "None", "Trend Following", "Candles", "Extremities", "Reversions"};
input ShowReversionSignals = yes;            # "Show Reversion Signals - HA only"

def na = Double.NaN;
def last = IsNaN(close);
def useMed = MedianCrossInsteadOfMidLineCross;
def NoHA    = DisplayVariant != DisplayVariant."Heikin-Ashi";
def NoClass = DisplayVariant != DisplayVariant."Classic";
def hybrid  = DisplayVariant == DisplayVariant."Hybrid";
#-- MTF
def cTF = Fundamental(FundamentalType = Source);
def cMTF = Fundamental(FundamentalType = Source, Period = customTimeframe);
def src;
Switch (timeframe) {
Case  "Custom Timefram" : src = cMTF;
Default                 : src = cTF;
}
DefineGlobalColor("up", CreateColor(95, 250, 224));
DefineGlobalColor("dn", CreateColor(194, 46, 208));
DefineGlobalColor("dup", CreateColor(3, 106, 89));
DefineGlobalColor("ddn", CreateColor(89, 21, 96));
DefineGlobalColor("BgU", CreateColor(6, 182, 153));
DefineGlobalColor("BgD", CreateColor(149, 35, 160));
#method ha(bar b, simple bool p = true) =>
script ha {
    input bo = open;
    input bh = high;
    input bl = low;
    input bc = close;
    def xc = (bo + bh + bl + bc) / 4;
    def xo = if !xo[1] then (bo + bc) / 2 else (xo[1] + xc[1]) / 2;
    def xh = Max(bh, Max(xo, xc));
    def xl = Min(bl, Min(xo, xc));
    plot hac = xc;
    plot hao = xo;
    plot hah = xh;
    plot hal = xl;
}
#// Calculate Dynamic OB/OS Zones
script stdv_bands {
    input _src = close;
    input _length = 365;
    input _mult = 1;
    def basis = Average(_src, _length);
    def dev   = _mult * StDev(_src, _length);
    plot up = basis + dev;
    plot dn = basis - dev;
}
#// Base calculations
def rsi1 = RSI(Price = src, Length = rsiLength);
def nnOutput = Sum(rsi1 * 1 / nnLength, nnLength);
def median  =  Median(nnOutput, MedianLength);
def cross  = if last then na else if useMed then median else 50;
def haro = ha(nnOutput[1], Max(nnOutput, nnOutput[1]), Min(nnOutput, nnOutput[1]), nnOutput).hao;
def harh = ha(nnOutput[1], Max(nnOutput, nnOutput[1]), Min(nnOutput, nnOutput[1]), nnOutput).hah;
def harl = ha(nnOutput[1], Max(nnOutput, nnOutput[1]), Min(nnOutput, nnOutput[1]), nnOutput).hal;
def harc = ha(nnOutput[1], Max(nnOutput, nnOutput[1]), Min(nnOutput, nnOutput[1]), nnOutput).hac;


def u1 = stdv_bands(nnOutput, MedianLength, 1).up;
def l1 = stdv_bands(nnOutput, MedianLength, 1).dn;
def u2 = stdv_bands(nnOutput, MedianLength, 2).up;
def l2 = stdv_bands(nnOutput, MedianLength, 2).dn;

def UpCol = harc > haro;
def DnCol = harc < haro;

def col;
Switch (barColorType) {
Case "None"       : col = na;
Case "Candles"    : col = if harc > haro then 1 else -1;
Case "Extremities": col = if harc > u2 then -1 else if harc <l2 then 1 else 0;
Case "Reversions" : col = if harh > u2 and DnCol and !(harc[1] < haro[1]) then -1 else
                          if harl < l2 and UpCol and !(harc[1] > haro[1]) then  1 else 0;
Default           : col = if (if NoHA then nnOutput else harc) > cross then 1 else -1;
}

##// Final Plots + Fill
plot pu1 = u1;
plot pl1 = l1;
def pu2 = u2;
def pl2 = l2;
plot pOut= if NoHA and hybrid then nnOutput else na;
plot poutClass = if !NoClass then nnOutput else na;
plot mid = cross;    # "Crossing Line"

poutClass.SetLineWeight(2);
mid.SetDefaultColor(Color.DARK_GRAY);
pu1.SetDefaultColor(GlobalColor("ddn"));
pl1.SetDefaultColor(GlobalColor("dup"));
pOut.AssignValueColor(if nnOutput > cross then GlobalColor("up") else GlobalColor("dn"));
poutClass.AssignValueColor(if nnOutput > cross then Color.CYAN else Color.MAGENTA);

AddCloud(if pOut > mid then pOut else na, pOut - (pOut - mid)/2, GlobalColor("dup"));
AddCloud(if pOut > mid then na else pOut + (mid - pOut)/2, pOut, GlobalColor("ddn"));

AddCloud(pu2, pu2 - (pu2-pu1)/2, GlobalColor("dn"));
AddCloud(pl2 + (pl1-pl2)/2, pl2, GlobalColor("up"));
AddCloud(pu2 - (pu2-pu1)/2, pu1, GlobalColor("ddn"));
AddCloud(pl1, pl2 + (pl1-pl2)/2, GlobalColor("dup"));

#// Plot Reversions
def sigDn = if NoClass and ShowReversionSignals then
            if harh > u2 and DnCol and !(harc[1] < haro[1]) then harh +5 else na else na;
def sigUp = if NoClass and ShowReversionSignals then
            if harl < l2 and UpCol and !(harc[1] > haro[1]) then harl -5 else na else na;

plot shapeUp = sigUp;
plot shapeDn = sigDn;
shapeUp.SetDefaultColor(Color.GREEN);
shapeDn.SetDefaultColor(Color.RED);
shapeUp.SetPaintingStrategy(PaintingStrategy.SQUARES);
shapeDn.SetPaintingStrategy(PaintingStrategy.SQUARES);

def oUp = if NoClass and UpCol then if HollowCandles then haro else harc else na;
def cUp = if NoClass and UpCol then if HollowCandles then harc else haro else na;
def oDn = if NoClass and DnCol then if HollowCandles then harc else haro else na;
def cDn = if NoClass and DnCol then if HollowCandles then haro else harc else na;

AddChart(open = oUp, high = harh , low = harl , close = cUp,
         type = ChartType.CANDLE, growcolor =  Color.CYAN);

AddChart(open = oDn, high = harh , low = harl , close = cDn,
         type = ChartType.CANDLE, growcolor =  Color.MAGENTA);

#-- Bar Color
AssignPriceColor(if isNaN(col) then Color.CURRENT else
                 if col > 0 then GlobalColor("up") else
                 if col < 0 then GlobalColor("dn") else Color.GRAY);

#-- END of CODE