Signal when TTM_Squeeze dots meet my criteria

BranDonCMK

New member
Greetings all,

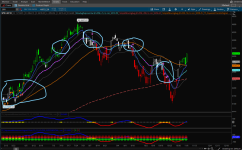
I'm trying to create something similar to the indicator that Taylor Horton uses at Simpler Trading but with my own buy/sell signal criteria. I'm running into an issue at the end of the code where I'm trying to get an arrow under/above the TTM_Squeeze dots when my criteria are met for a buy/sell signal. The arrows appear under and above for every candle on the chart when I only want them under or above the squeeze dots when the buy or sell criteria is met. I'll provide the code and a screenshot below if anyone can help. I circled the areas on the upper chart where my buy/sell arrows are which is where they should be on the lower indicator. Please forgive me if the code is sloppy and poorly written. I can really only do very basic stuff with thinkscript.

# SqueezeSignals and Momentum Indicator - TEST


declare lower;

#Momentum Indicator

input length = 13;
input AvgMomentumLength = 13;
input price = close;
input AverageType = AverageType.EXPONENTIAL;
input showBreakoutSignals = no;

assert(length > 0, "'length' must be positive: " + length);


def Momentum = price - price[length];
plot AvgMomentum = movavgExponential(Momentum, AvgMomentumLength);

def bullishMomentum = AvgMomentum > 0;
def bearishMomentum = AvgMomentum < 0;

AvgMomentum.SetPaintingStrategy(paintingstrategy.LINE);
AvgMomentum.SetLineWeight(3);
AvgMomentum.AssignValueColor(if bullishmomentum then color.blue else if bearishMomentum then color.red else color.black);


# Squeeze Checklist Signals

def EMA8 = movavgExponential(close,8);
def EMA21 = movavgExponential(close,21);

def bullishStack = EMA8 > EMA21;
def bearishStack = EMA8 < EMA21;

#RSI
def RSIlength = 14;
def RSIover_Bought = 70;
def RSIover_Sold = 30;
def RSIprice = close;
def RSIaverageType = AverageType.WILDERS;

def NetChgAvg = MovingAverage(RSIaverageType, RSIprice - RSIprice[1], RSIlength);
def TotChgAvg = MovingAverage(RSIaverageType, AbsValue(RSIprice - RSIprice[1]), RSIlength);
def ChgRatio = if TotChgAvg != 0 then NetChgAvg / TotChgAvg else 0;

def RSI = 50 * (ChgRatio + 1);
def RSIOverSold = RSIover_Sold;
def RSIOverBought = RSIover_Bought;
def RSIUpSignal = if RSI crosses above RSIOverSold then RSIOverSold else Double.NaN;
def RSIDownSignal = if RSI crosses below RSIOverBought then RSIOverBought else Double.NaN;
def RSImidline = 50;

def bullishRSI = RSI >= 50;
def bearishRSI = RSI < 50;

#Stochastics
def over_bought = 80;
def over_sold = 20;
def KPeriod = 14;
def DPeriod = 3;
def priceH = high;
def priceL = low;
def priceC = close;
def slowing_period = 3;
def averageTypeStoch = AverageType.SIMPLE;

def lowest_k = Lowest(priceL, KPeriod);
def c1 = priceC - lowest_k;
def c2 = Highest(priceH, KPeriod) - lowest_k;
def FastK = if c2 != 0 then c1 / c2 * 100 else 0;

def FullK = MovingAverage(averageTypeStoch, FastK, slowing_period);
def FullD = MovingAverage(averageTypeStoch, FullK, DPeriod);

def OverBought = over_bought;
def OverSold = over_sold;
def MidLine = 50;

def upK = FullK crosses above OverSold;
def upD = FullD crosses above OverSold;
def downK = FullK crosses below OverBought;
def downD = FullD crosses below OverBought;

def bullishStoch = FullK > FullD;
def bearishStoch = FullK < FullD;

# SqueezeHistogram

def squeezehistogram = TTM_Squeeze(close, 20, 1.5, 2.0, 1.0).Histogram;

def squeezehistogramUP = squeezehistogram > squeezehistogram[1] and squeezehistogram[1] > squeezehistogram[2];
def squeezehistogramDOWN = squeezehistogram < squeezehistogram[1] and squeezehistogram[1] < squeezehistogram[2];


# Squeeze Signal

def normalSqueeze = if TTM_Squeeze(close, 20, 1.5, 2.0, 1.0).SqueezeAlert == 0 then 1 else 0;
def aggroSqueeze = if TTM_Squeeze(close, 20, 2.0, 2.0, 1.0).SqueezeAlert == 0 then 1 else 0;

plot squeezeSignal = normalSqueeze or aggroSqueeze;
squeezeSignal.setPaintingStrategy(paintingStrategy.POINTS);
squeezeSignal.setLineWeight(3);

squeezeSignal.AssignValueColor(if normalSqueeze then color.yellow else if aggroSqueeze then color.yellow else color.dark_gray);

plot BullishSignal = squeezeSignal and bullishstack and bullishRSI and bullishStoch and squeezehistogramUP;
plot BearishSignal = squeezeSignal and bearishstack and bearishRSI and bearishStoch and squeezehistogramDOWN;

BullishSignal.SetpaintingStrategy(PaintingStrategy.ARROW_UP);
BearishSignal.SetpaintingStrategy(PaintingStrategy.ARROW_DOWN);

BullishSignal.SetLineWeight(2);
BearishSignal.SetlineWeight(2);

BullishSignal.SetdefaultColor(color.green);
BearishSignal.SetdefaultColor(color.red);

# End Code


Thanks in advance if anyone sees this and can tell me what I did wrong.
 

Attachments

  • Screenshot 2023-11-11 205929.png
    Screenshot 2023-11-11 205929.png
    572.5 KB · Views: 396
Code:
declare lower;

#Momentum Indicator

input length = 13;
input AvgMomentumLength = 13;
input price = close;
input AverageType = AverageType.EXPONENTIAL;
input showBreakoutSignals = no;

assert(length > 0, "'length' must be positive: " + length);


def Momentum = price - price[length];
plot AvgMomentum = movavgExponential(Momentum, AvgMomentumLength);

def bullishMomentum = AvgMomentum > 0;
def bearishMomentum = AvgMomentum < 0;

AvgMomentum.SetPaintingStrategy(paintingstrategy.LINE);
AvgMomentum.SetLineWeight(3);
AvgMomentum.AssignValueColor(if bullishmomentum then color.blue else if bearishMomentum then color.red else color.black);


# Squeeze Checklist Signals

def EMA8 = movavgExponential(close,8);
def EMA21 = movavgExponential(close,21);

def bullishStack = EMA8 > EMA21;
def bearishStack = EMA8 < EMA21;

#RSI
def RSIlength = 14;
def RSIover_Bought = 70;
def RSIover_Sold = 30;
def RSIprice = close;
def RSIaverageType = AverageType.WILDERS;

def NetChgAvg = MovingAverage(RSIaverageType, RSIprice - RSIprice[1], RSIlength);
def TotChgAvg = MovingAverage(RSIaverageType, AbsValue(RSIprice - RSIprice[1]), RSIlength);
def ChgRatio = if TotChgAvg != 0 then NetChgAvg / TotChgAvg else 0;

def RSI = 50 * (ChgRatio + 1);
def RSIOverSold = RSIover_Sold;
def RSIOverBought = RSIover_Bought;
def RSIUpSignal = if RSI crosses above RSIOverSold then RSIOverSold else Double.NaN;
def RSIDownSignal = if RSI crosses below RSIOverBought then RSIOverBought else Double.NaN;
def RSImidline = 50;

def bullishRSI = RSI >= 50;
def bearishRSI = RSI < 50;

#Stochastics
def over_bought = 80;
def over_sold = 20;
def KPeriod = 14;
def DPeriod = 3;
def priceH = high;
def priceL = low;
def priceC = close;
def slowing_period = 3;
def averageTypeStoch = AverageType.SIMPLE;

def lowest_k = Lowest(priceL, KPeriod);
def c1 = priceC - lowest_k;
def c2 = Highest(priceH, KPeriod) - lowest_k;
def FastK = if c2 != 0 then c1 / c2 * 100 else 0;

def FullK = MovingAverage(averageTypeStoch, FastK, slowing_period);
def FullD = MovingAverage(averageTypeStoch, FullK, DPeriod);

def OverBought = over_bought;
def OverSold = over_sold;
def MidLine = 50;

def upK = FullK crosses above OverSold;
def upD = FullD crosses above OverSold;
def downK = FullK crosses below OverBought;
def downD = FullD crosses below OverBought;

def bullishStoch = FullK > FullD;
def bearishStoch = FullK < FullD;

# SqueezeHistogram

def squeezehistogram = TTM_Squeeze(close, 20, 1.5, 2.0, 1.0).Histogram;

def squeezehistogramUP = squeezehistogram > squeezehistogram[1] and squeezehistogram[1] > squeezehistogram[2];
def squeezehistogramDOWN = squeezehistogram < squeezehistogram[1] and squeezehistogram[1] < squeezehistogram[2];


# Squeeze Signal

def normalSqueeze = if TTM_Squeeze(close, 20, 1.5, 2.0, 1.0).SqueezeAlert == 0 then 1 else 0;
def aggroSqueeze = if TTM_Squeeze(close, 20, 2.0, 2.0, 1.0).SqueezeAlert == 0 then 1 else 0;

plot squeezeSignal = normalSqueeze or aggroSqueeze;
squeezeSignal.setPaintingStrategy(paintingStrategy.POINTS);
squeezeSignal.setLineWeight(3);

squeezeSignal.AssignValueColor(if normalSqueeze then color.yellow else if aggroSqueeze then color.yellow else color.dark_gray);

def BullishSignal = squeezeSignal and bullishstack and bullishRSI and bullishStoch and squeezehistogramUP;
def BearishSignal = squeezeSignal and bearishstack and bearishRSI and bearishStoch and squeezehistogramDOWN;

plot BullishSignal2 = if bullishsignal and !bullishsignal[1] then avgmomentum else double.nan;
plot BearishSignal2 =  if bearishsignal and !bearishsignal[1] then avgmomentum else double.nan;

BullishSignal2.SetpaintingStrategy(PaintingStrategy.ARROW_UP);
BearishSignal2.SetpaintingStrategy(PaintingStrategy.ARROW_DOWN);

BullishSignal2.SetLineWeight(2);
BearishSignal2.SetlineWeight(2);

BullishSignal2.SetdefaultColor(color.green);
BearishSignal2.SetdefaultColor(color.red);

# End Code
 

Join useThinkScript to post your question to a community of 21,000+ developers and traders.

I Changed the original plot condition BullishSignal to def and added a new plot condition BullishSignal2 that says if BullishSignal is true on the current bar and BullishSignal was not true on the previous bar then plot an arrow on the avg line

def BullishSignal = squeezeSignal and bullishstack and bullishRSI and bullishStoch and squeezehistogramUP;
def BearishSignal = squeezeSignal and bearishstack and bearishRSI and bearishStoch and squeezehistogramDOWN;

plot BullishSignal2 = if bullishsignal and !bullishsignal[1] then avgmomentum else double.nan;
plot BearishSignal2 = if bearishsignal and !bearishsignal[1] then avgmomentum else double.nan;
Can please post updated code..thank you

Code:
declare lower;

#Momentum Indicator

input length = 13;
input AvgMomentumLength = 13;
input price = close;
input AverageType = AverageType.EXPONENTIAL;
input showBreakoutSignals = no;

assert(length > 0, "'length' must be positive: " + length);


def Momentum = price - price[length];
plot AvgMomentum = movavgExponential(Momentum, AvgMomentumLength);

def bullishMomentum = AvgMomentum > 0;
def bearishMomentum = AvgMomentum < 0;

AvgMomentum.SetPaintingStrategy(paintingstrategy.LINE);
AvgMomentum.SetLineWeight(3);
AvgMomentum.AssignValueColor(if bullishmomentum then color.blue else if bearishMomentum then color.red else color.black);


# Squeeze Checklist Signals

def EMA8 = movavgExponential(close,8);
def EMA21 = movavgExponential(close,21);

def bullishStack = EMA8 > EMA21;
def bearishStack = EMA8 < EMA21;

#RSI
def RSIlength = 14;
def RSIover_Bought = 70;
def RSIover_Sold = 30;
def RSIprice = close;
def RSIaverageType = AverageType.WILDERS;

def NetChgAvg = MovingAverage(RSIaverageType, RSIprice - RSIprice[1], RSIlength);
def TotChgAvg = MovingAverage(RSIaverageType, AbsValue(RSIprice - RSIprice[1]), RSIlength);
def ChgRatio = if TotChgAvg != 0 then NetChgAvg / TotChgAvg else 0;

def RSI = 50 * (ChgRatio + 1);
def RSIOverSold = RSIover_Sold;
def RSIOverBought = RSIover_Bought;
def RSIUpSignal = if RSI crosses above RSIOverSold then RSIOverSold else Double.NaN;
def RSIDownSignal = if RSI crosses below RSIOverBought then RSIOverBought else Double.NaN;
def RSImidline = 50;

def bullishRSI = RSI >= 50;
def bearishRSI = RSI < 50;

#Stochastics
def over_bought = 80;
def over_sold = 20;
def KPeriod = 14;
def DPeriod = 3;
def priceH = high;
def priceL = low;
def priceC = close;
def slowing_period = 3;
def averageTypeStoch = AverageType.SIMPLE;

def lowest_k = Lowest(priceL, KPeriod);
def c1 = priceC - lowest_k;
def c2 = Highest(priceH, KPeriod) - lowest_k;
def FastK = if c2 != 0 then c1 / c2 * 100 else 0;

def FullK = MovingAverage(averageTypeStoch, FastK, slowing_period);
def FullD = MovingAverage(averageTypeStoch, FullK, DPeriod);

def OverBought = over_bought;
def OverSold = over_sold;
def MidLine = 50;

def upK = FullK crosses above OverSold;
def upD = FullD crosses above OverSold;
def downK = FullK crosses below OverBought;
def downD = FullD crosses below OverBought;

def bullishStoch = FullK > FullD;
def bearishStoch = FullK < FullD;

# SqueezeHistogram

def squeezehistogram = TTM_Squeeze(close, 20, 1.5, 2.0, 1.0).Histogram;

def squeezehistogramUP = squeezehistogram > squeezehistogram[1] and squeezehistogram[1] > squeezehistogram[2];
def squeezehistogramDOWN = squeezehistogram < squeezehistogram[1] and squeezehistogram[1] < squeezehistogram[2];


# Squeeze Signal

def normalSqueeze = if TTM_Squeeze(close, 20, 1.5, 2.0, 1.0).SqueezeAlert == 0 then 1 else 0;
def aggroSqueeze = if TTM_Squeeze(close, 20, 2.0, 2.0, 1.0).SqueezeAlert == 0 then 1 else 0;

plot squeezeSignal = normalSqueeze or aggroSqueeze;
squeezeSignal.setPaintingStrategy(paintingStrategy.POINTS);
squeezeSignal.setLineWeight(3);

squeezeSignal.AssignValueColor(if normalSqueeze then color.yellow else if aggroSqueeze then color.yellow else color.dark_gray);

def BullishSignal = squeezeSignal and bullishstack and bullishRSI and bullishStoch and squeezehistogramUP;
def BearishSignal = squeezeSignal and bearishstack and bearishRSI and bearishStoch and squeezehistogramDOWN;

plot BullishSignal2 = if bullishsignal and !bullishsignal[1] then avgmomentum else double.nan;
plot BearishSignal2 =  if bearishsignal and !bearishsignal[1] then avgmomentum else double.nan;

BullishSignal2.SetpaintingStrategy(PaintingStrategy.ARROW_UP);
BearishSignal2.SetpaintingStrategy(PaintingStrategy.ARROW_DOWN);

BullishSignal2.SetLineWeight(2);
BearishSignal2.SetlineWeight(2);

BullishSignal2.SetdefaultColor(color.green);
BearishSignal2.SetdefaultColor(color.red);

# End Code
Would you be able share your chart with updated code? Thank u
 
Wow great Work guys¡¡¡¡ was looking for that Although it is not the original indicator for obvious copyright reasons, I will do exhaustive tests and although I don't know anything about code, I will try to help you improve the strategy
 
Code:
declare lower;

#Momentum Indicator

input length = 13;
input AvgMomentumLength = 13;
input price = close;
input AverageType = AverageType.EXPONENTIAL;
input showBreakoutSignals = no;

assert(length > 0, "'length' must be positive: " + length);


def Momentum = price - price[length];
plot AvgMomentum = movavgExponential(Momentum, AvgMomentumLength);

def bullishMomentum = AvgMomentum > 0;
def bearishMomentum = AvgMomentum < 0;

AvgMomentum.SetPaintingStrategy(paintingstrategy.LINE);
AvgMomentum.SetLineWeight(3);
AvgMomentum.AssignValueColor(if bullishmomentum then color.blue else if bearishMomentum then color.red else color.black);


# Squeeze Checklist Signals

def EMA8 = movavgExponential(close,8);
def EMA21 = movavgExponential(close,21);

def bullishStack = EMA8 > EMA21;
def bearishStack = EMA8 < EMA21;

#RSI
def RSIlength = 14;
def RSIover_Bought = 70;
def RSIover_Sold = 30;
def RSIprice = close;
def RSIaverageType = AverageType.WILDERS;

def NetChgAvg = MovingAverage(RSIaverageType, RSIprice - RSIprice[1], RSIlength);
def TotChgAvg = MovingAverage(RSIaverageType, AbsValue(RSIprice - RSIprice[1]), RSIlength);
def ChgRatio = if TotChgAvg != 0 then NetChgAvg / TotChgAvg else 0;

def RSI = 50 * (ChgRatio + 1);
def RSIOverSold = RSIover_Sold;
def RSIOverBought = RSIover_Bought;
def RSIUpSignal = if RSI crosses above RSIOverSold then RSIOverSold else Double.NaN;
def RSIDownSignal = if RSI crosses below RSIOverBought then RSIOverBought else Double.NaN;
def RSImidline = 50;

def bullishRSI = RSI >= 50;
def bearishRSI = RSI < 50;

#Stochastics
def over_bought = 80;
def over_sold = 20;
def KPeriod = 14;
def DPeriod = 3;
def priceH = high;
def priceL = low;
def priceC = close;
def slowing_period = 3;
def averageTypeStoch = AverageType.SIMPLE;

def lowest_k = Lowest(priceL, KPeriod);
def c1 = priceC - lowest_k;
def c2 = Highest(priceH, KPeriod) - lowest_k;
def FastK = if c2 != 0 then c1 / c2 * 100 else 0;

def FullK = MovingAverage(averageTypeStoch, FastK, slowing_period);
def FullD = MovingAverage(averageTypeStoch, FullK, DPeriod);

def OverBought = over_bought;
def OverSold = over_sold;
def MidLine = 50;

def upK = FullK crosses above OverSold;
def upD = FullD crosses above OverSold;
def downK = FullK crosses below OverBought;
def downD = FullD crosses below OverBought;

def bullishStoch = FullK > FullD;
def bearishStoch = FullK < FullD;

# SqueezeHistogram

def squeezehistogram = TTM_Squeeze(close, 20, 1.5, 2.0, 1.0).Histogram;

def squeezehistogramUP = squeezehistogram > squeezehistogram[1] and squeezehistogram[1] > squeezehistogram[2];
def squeezehistogramDOWN = squeezehistogram < squeezehistogram[1] and squeezehistogram[1] < squeezehistogram[2];


# Squeeze Signal

def normalSqueeze = if TTM_Squeeze(close, 20, 1.5, 2.0, 1.0).SqueezeAlert == 0 then 1 else 0;
def aggroSqueeze = if TTM_Squeeze(close, 20, 2.0, 2.0, 1.0).SqueezeAlert == 0 then 1 else 0;

plot squeezeSignal = normalSqueeze or aggroSqueeze;
squeezeSignal.setPaintingStrategy(paintingStrategy.POINTS);
squeezeSignal.setLineWeight(3);

squeezeSignal.AssignValueColor(if normalSqueeze then color.yellow else if aggroSqueeze then color.yellow else color.dark_gray);

def BullishSignal = squeezeSignal and bullishstack and bullishRSI and bullishStoch and squeezehistogramUP;
def BearishSignal = squeezeSignal and bearishstack and bearishRSI and bearishStoch and squeezehistogramDOWN;

plot BullishSignal2 = if bullishsignal and !bullishsignal[1] then avgmomentum else double.nan;
plot BearishSignal2 =  if bearishsignal and !bearishsignal[1] then avgmomentum else double.nan;

BullishSignal2.SetpaintingStrategy(PaintingStrategy.ARROW_UP);
BearishSignal2.SetpaintingStrategy(PaintingStrategy.ARROW_DOWN);

BullishSignal2.SetLineWeight(2);
BearishSignal2.SetlineWeight(2);

BullishSignal2.SetdefaultColor(color.green);
BearishSignal2.SetdefaultColor(color.red);

# End Code
What are the yellow dots and grey dots above and below the line? Also anyone tried coded Big 3 squeeze from TH
 
What are the individual components of the Big 3?
Structure, momentum, and the TTM Squeeze. Structure is stacked EMAs. Momentum is a momentum indicator like MACD which is what I believe Taylor still uses in his Big 3 indicator. And the TTM Squeeze is a John Carter indicator that TOS has already. Not sure what he uses for the Big 3 histogram but I used TMO on mine and I like it so far.
 
Structure, momentum, and the TTM Squeeze. Structure is stacked EMAs. Momentum is a momentum indicator like MACD which is what I believe Taylor still uses in his Big 3 indicator. And the TTM Squeeze is a John Carter indicator that TOS has already. Not sure what he uses for the Big 3 histogram but I used TMO on mine and I like it so far.
can you show the setup? thanks
 
Structure, momentum, and the TTM Squeeze. Structure is stacked EMAs. Momentum is a momentum indicator like MACD which is what I believe Taylor still uses in his Big 3 indicator. And the TTM Squeeze is a John Carter indicator that TOS has already. Not sure what he uses for the Big 3 histogram but I used TMO on mine and I like it so far.
Can you share your script?

The dots returned to the zero line when I changed the timeframe. Also, big thanks to HODL for fixing that! I would've never been able to figure it out.
Can you explain how to use this ? I see the red and blue like with arrow what do they mean?
 

Similar threads

Not the exact question you're looking for?

Start a new thread and receive assistance from our community.

87k+ Posts
268 Online
Create Post

Similar threads

Similar threads

The Market Trading Game Changer

Join 2,500+ subscribers inside the useThinkScript VIP Membership Club
  • Exclusive indicators
  • Proven strategies & setups
  • Private Discord community
  • ‘Buy The Dip’ signal alerts
  • Exclusive members-only content
  • Add-ons and resources
  • 1 full year of unlimited support

Frequently Asked Questions

What is useThinkScript?

useThinkScript is the #1 community of stock market investors using indicators and other tools to power their trading strategies. Traders of all skill levels use our forums to learn about scripting and indicators, help each other, and discover new ways to gain an edge in the markets.

How do I get started?

We get it. Our forum can be intimidating, if not overwhelming. With thousands of topics, tens of thousands of posts, our community has created an incredibly deep knowledge base for stock traders. No one can ever exhaust every resource provided on our site.

If you are new, or just looking for guidance, here are some helpful links to get you started.

What are the benefits of VIP Membership?
VIP members get exclusive access to these proven and tested premium indicators: Buy the Dip, Advanced Market Moves 2.0, Take Profit, and Volatility Trading Range. In addition, VIP members get access to over 50 VIP-only custom indicators, add-ons, and strategies, private VIP-only forums, private Discord channel to discuss trades and strategies in real-time, customer support, trade alerts, and much more. Learn all about VIP membership here.
How can I access the premium indicators?
To access the premium indicators, which are plug and play ready, sign up for VIP membership here.
Back
Top