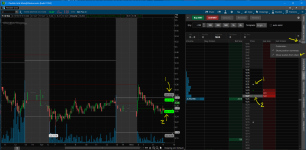
Did you know you can show your studies on the DOM (ActiveTrader)?
This is useful for easily identifying levels on your chart on the DOM where you are placing your trades.
For example, here's my Previous Day OHLC study on a chart, and you can see how you enable this setting (upper right on image below). Once enabled, you can see how the study and the color of the study show on the DOM. #1 is prev day high. #2 is previous day open and green because previous day was an up day.

Give this a try for yourself. Add a Bollinger Band or VWAP to your chart and see those studies on your DOM.
Happy trading,
Kory Gill, @korygill
This is useful for easily identifying levels on your chart on the DOM where you are placing your trades.
For example, here's my Previous Day OHLC study on a chart, and you can see how you enable this setting (upper right on image below). Once enabled, you can see how the study and the color of the study show on the DOM. #1 is prev day high. #2 is previous day open and green because previous day was an up day.
Give this a try for yourself. Add a Bollinger Band or VWAP to your chart and see those studies on your DOM.
Happy trading,
Kory Gill, @korygill

