Short Term Market Volatility Indicator for ThinkorSwim

BenTen

Administrative
Staff member
Staff
VIP
Lifetime
Market Volatility indicator for ThinkorSwim will help day traders avoid trading in sideways market and getting chopped up while volume dries up. Choppy markets bring unnecessary losses to traders.

Originally called CalmvVolatile, this indicator was developed by The Lawyer Trader. Here is a quick snippet about it.

> This is a pretty basic stud that compares the current Average True Range (ATR) with a long term average of the ATR. The default periods are 14 period for the ATR and 500 period for the average. This indicator can be helpful as a quick reference when taking short term trades. If the instrument is volatile, you know that there's a better possibility of a quicker and farther move than if it's calm.

Notes:
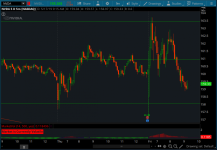
  • Blue = Market is Currently Neutral
  • Red = Market is Currently Volatile
  • Green = Market is Currently Calm

i2npn7y.png


thinkScript Code

Rich (BB code):
input atrlength = 14;

input avglength = 500;

input plotlower = {default "yes", "no"};

def vol = AverageTrueRange(atrlength);

def avgvol = Average(vol, avglength);

def calm = vol < avgvol - (avgvol * .1);

def neutral = avgvol + (avgvol * .1) > vol > avgvol - (avgvol * .1);

def Volatile = vol > avgvol + (avgvol * .1);

AddLabel(yes, Concat("Market is Currently ", (if calm then "Calm" else if neutral then "Neutral" else if Volatile then "Volatile" else "Neutral")),  if calm then Color.GREEN else if neutral then Color.BLUE else if Volatile then Color.RED  else Color.GRAY);

declare lower;

plot window =  vol - avgvol;

window.SetPaintingStrategy(PaintingStrategy.HISTOGRAM);

window.AssignValueColor(if Volatile then Color.RED else if calm then Color.GREEN else if neutral then Color.BLUE else Color.GRAY);

plot zeroline = 0;

Shareable Link

https://tos.mx/ZBaPU3
 

Attachments

  • i2npn7y.png
    i2npn7y.png
    317.7 KB · Views: 126
Last edited:

Join useThinkScript to post your question to a community of 21,000+ developers and traders.

@Billions Try this:

Code:
input atrlength = 14;

input avglength = 500;

input plotlower = {default "yes", "no"};

def vol = AverageTrueRange(atrlength);

def avgvol = Average(vol, avglength);

def calm = vol < avgvol - (avgvol * .1);

def neutral = avgvol + (avgvol * .1) > vol > avgvol - (avgvol * .1);

def Volatile = vol > avgvol + (avgvol * .1);

AddLabel(yes, Concat("Market is Currently ", (if calm then "Calm" else if neutral then "Neutral" else if Volatile then "Volatile" else "Neutral")),  if calm then Color.GREEN else if neutral then Color.BLUE else if Volatile then Color.RED  else Color.GRAY);

#plot window =  vol - avgvol;

#window.SetPaintingStrategy(PaintingStrategy.HISTOGRAM);

#window.AssignValueColor(if Volatile then Color.RED else if calm then Color.GREEN else if neutral then Color.BLUE else Color.GRAY);

#plot zeroline = 0;
 
@BenTen What would that code be to plot this as a scan on 15m data to pick up when market is volatile within 3 bars. I've tried to plot the volatile line for scan but it hasn't been able to work on the 15m time frame. Thank you
 
@Sathiesh
Code:
def calm = vol < avgvol - (avgvol * .1);

def neutral = avgvol + (avgvol * .1) > vol > avgvol - (avgvol * .1);

def Volatile = vol > avgvol + (avgvol * .1);
 

Similar threads

Not the exact question you're looking for?

Start a new thread and receive assistance from our community.

87k+ Posts
402 Online
Create Post

Similar threads

Similar threads

The Market Trading Game Changer

Join 2,500+ subscribers inside the useThinkScript VIP Membership Club
  • Exclusive indicators
  • Proven strategies & setups
  • Private Discord community
  • ‘Buy The Dip’ signal alerts
  • Exclusive members-only content
  • Add-ons and resources
  • 1 full year of unlimited support

Frequently Asked Questions

What is useThinkScript?

useThinkScript is the #1 community of stock market investors using indicators and other tools to power their trading strategies. Traders of all skill levels use our forums to learn about scripting and indicators, help each other, and discover new ways to gain an edge in the markets.

How do I get started?

We get it. Our forum can be intimidating, if not overwhelming. With thousands of topics, tens of thousands of posts, our community has created an incredibly deep knowledge base for stock traders. No one can ever exhaust every resource provided on our site.

If you are new, or just looking for guidance, here are some helpful links to get you started.

What are the benefits of VIP Membership?
VIP members get exclusive access to these proven and tested premium indicators: Buy the Dip, Advanced Market Moves 2.0, Take Profit, and Volatility Trading Range. In addition, VIP members get access to over 50 VIP-only custom indicators, add-ons, and strategies, private VIP-only forums, private Discord channel to discuss trades and strategies in real-time, customer support, trade alerts, and much more. Learn all about VIP membership here.
How can I access the premium indicators?
To access the premium indicators, which are plug and play ready, sign up for VIP membership here.
Back
Top