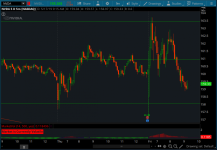
Market Volatility indicator for ThinkorSwim will help day traders avoid trading in sideways market and getting chopped up while volume dries up. Choppy markets bring unnecessary losses to traders.
Originally called CalmvVolatile, this indicator was developed by The Lawyer Trader. Here is a quick snippet about it.
Notes:

Originally called CalmvVolatile, this indicator was developed by The Lawyer Trader. Here is a quick snippet about it.
> This is a pretty basic stud that compares the current Average True Range (ATR) with a long term average of the ATR. The default periods are 14 period for the ATR and 500 period for the average. This indicator can be helpful as a quick reference when taking short term trades. If the instrument is volatile, you know that there's a better possibility of a quicker and farther move than if it's calm.
Notes:
- Blue = Market is Currently Neutral
- Red = Market is Currently Volatile
- Green = Market is Currently Calm
thinkScript Code
Rich (BB code):
input atrlength = 14;

input avglength = 500;

input plotlower = {default "yes", "no"};

def vol = AverageTrueRange(atrlength);

def avgvol = Average(vol, avglength);

def calm = vol < avgvol - (avgvol * .1);

def neutral = avgvol + (avgvol * .1) > vol > avgvol - (avgvol * .1);

def Volatile = vol > avgvol + (avgvol * .1);

AddLabel(yes, Concat("Market is Currently ", (if calm then "Calm" else if neutral then "Neutral" else if Volatile then "Volatile" else "Neutral")),  if calm then Color.GREEN else if neutral then Color.BLUE else if Volatile then Color.RED  else Color.GRAY);

declare lower;

plot window =  vol - avgvol;

window.SetPaintingStrategy(PaintingStrategy.HISTOGRAM);

window.AssignValueColor(if Volatile then Color.RED else if calm then Color.GREEN else if neutral then Color.BLUE else Color.GRAY);

plot zeroline = 0;
Shareable Link
https://tos.mx/ZBaPU3Attachments
Last edited:

