Hi All,
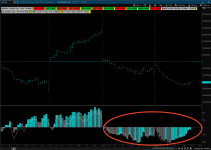
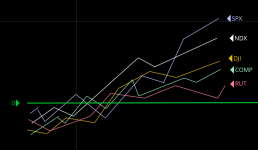
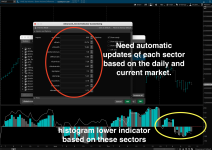
I have made slight changes to add markets of interest for quick over view. Now that we have the SPX, NDX, DJI, COMP and RUT. Can someone create a lower single indicator that plots a histogram for these markets that has a zero line? Plot bullish in color green if is above zero or red when bearish when it's below zero. This zero line should also change colors based on bullish or bearish sentiment.
I have made slight changes to add markets of interest for quick over view. Now that we have the SPX, NDX, DJI, COMP and RUT. Can someone create a lower single indicator that plots a histogram for these markets that has a zero line? Plot bullish in color green if is above zero or red when bearish when it's below zero. This zero line should also change colors based on bullish or bearish sentiment.
Code:
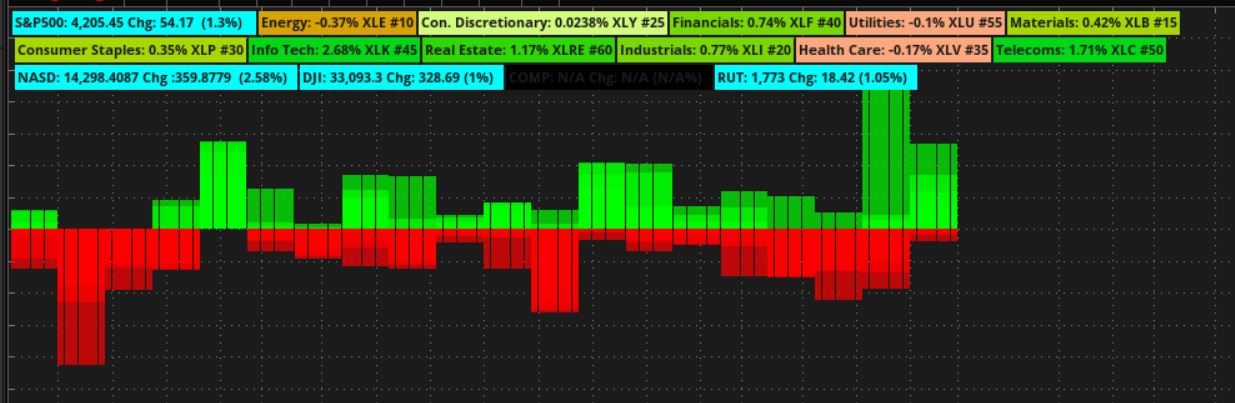
# S&P 500 Sector Performance (Percentage)
# Paris
# 4.12.2018
# After reviewing chubbyboy's S&P sector study, I thought it might
# be a good idea to display labels of relative S&P sector performance
# in percentages. At one glance this will enable us to determine
# which sectors are happening and which are not. Decided to use a
# script() to retrieve the data. Also, I changed the formula slightly.
# The percentage displayed is the current price as a percentage over
# yesterday's closing rather than the open today as was used in chubbyboy's
# study.
#====== Further Modified by Killing Hours ======#
# 5/4/2020 #
# Added Color Mapping #
# to distinguish more suddle movements #
#===============================================#
#Modified slightly by Headhunter20.


######################################################################################
script Sector {
input symb = "SPX";
def c = close(symbol = symb, period = AggregationPeriod.day);
def PctChg = (c / c[1]) - 1;
plot pct = PctChg;
}

#Define the color map. Change as you see fit
DefineGlobalColor("VeryGood", CreateColor(4, 216, 22));
DefineGlobalColor("Good", CreateColor(46, 216, 4));
DefineGlobalColor("ModGood", CreateColor(121, 216, 4));
DefineGlobalColor("SlightlyGood", CreateColor(167, 216, 4));
DefineGlobalColor("SluggishGood", CreateColor(210,252,126));
DefineGlobalColor("Neutral", CreateColor(252, 231, 126));
DefineGlobalColor("SluggishBad", CreateColor(252,168,126));
DefineGlobalColor("SlightlyBad", CreateColor(216, 163, 4));
DefineGlobalColor("ModBad", CreateColor(216, 117, 4));
DefineGlobalColor("Bad", CreateColor(216, 43, 4));
DefineGlobalColor("VeryBad", CreateColor(216, 4, 4));

# SPX Overall
def SPX = Sector("SPX");
def spxPer = round(SPX,4) * 100;
def CurrSP = +close("SPX", period = AggregationPeriod.DAY);
def ChangeSP = CurrSP - CurrSP[1];

addLabel(1, "S&P500: "+ CurrSP + " Chg: " + ChangeSP + "  (" + spxPer + "%" + ")   ", if ChangeSP > 0 then color.cyan else if ChangeSP < 0 then color.gray else if spxPer > 0 then COLOR.CYAN else color.gray);

# Energy Sector
def Energy = Sector("$SP500#10");
def engPer = round(Energy,4) * 100;
AddLabel(
1,
"Energy: "+engPer+"% XLE #10",
if engPer > 1.50 then GlobalColor("VeryGood") else
if engPer > 1 && engPer <= 1.50 then GlobalColor("Good") else
if engPer > .5 && engPer <= 1 then GlobalColor("ModGood") else
if engPer > .25 && engPer <= .5 then GlobalColor("SlightlyGood") else
if engPer > 0 && engPer <= .25 then GlobalColor("SluggishGood") else
if engPer == 0 then GlobalColor("Neutral") else
if engPer < 0 && engPer >= -.25 then GlobalColor("SluggishBad") else
if engPer < -.25 && engPer >= -.5 then GlobalColor("SlightlyBad") else
if engPer < -.5 && engPer >= -1 then GlobalColor("ModBad") else
if engPer < -1 && engPer >= -1.50 then GlobalColor("Bad") else
if engPer < -1.50 then GlobalColor("VeryBad") else
Color.black
);

# Consumer Discretionary Spending Sector
def ConDisr = Sector("$SP500#25");
def conDPer = round(ConDisr,4);
AddLabel(
1,
"Con. Discretionary: "+conDPer+"% XLY #25",
if conDPer > 1.50 then GlobalColor("VeryGood") else
if conDPer > 1 && conDPer <= 1.50 then GlobalColor("Good") else
if conDPer > .5 && conDPer <= 1 then GlobalColor("ModGood") else
if conDPer > .25 && conDPer <= .5 then GlobalColor("SlightlyGood") else
if conDPer > 0 && conDPer <= .25 then GlobalColor("SluggishGood") else
if conDPer == 0 then GlobalColor("Neutral") else
if conDPer < 0 && conDPer >= -.25 then GlobalColor("SluggishBad") else
if conDPer < -.25 && conDPer >= -.5 then GlobalColor("SlightlyBad") else
if conDPer < -.5 && conDPer >= -1 then GlobalColor("ModBad") else
if conDPer < -1 && conDPer >= -1.50 then GlobalColor("Bad") else
if conDPer < -1.50 then GlobalColor("VeryBad") else
Color.black
);

# Financial Sector
def Finance = Sector("$SP500#40");
def finPer = round(Finance,4) * 100;
AddLabel(
1,
"Financials: "+finPer+"% XLF #40",
if finPer > 1.50 then GlobalColor("VeryGood") else
if finPer > 1 && finPer <= 1.50 then GlobalColor("Good") else
if finPer > .5 && finPer <= 1 then GlobalColor("ModGood") else
if finPer > .25 && finPer <= .5 then GlobalColor("SlightlyGood") else
if finPer > 0 && finPer <= .25 then GlobalColor("SluggishGood") else
if finPer == 0 then GlobalColor("Neutral") else
if finPer < 0 && finPer >= -.25 then GlobalColor("SluggishBad") else
if finPer < -.25 && finPer >= -.5 then GlobalColor("SlightlyBad") else
if finPer < -.5 && finPer >= -1 then GlobalColor("ModBad") else
if finPer < -1 && finPer >= -1.50 then GlobalColor("Bad") else
if finPer < -1.50 then GlobalColor("VeryBad") else
Color.black
);

# Utilities Sector
def Utilities = Sector("$SP500#55");
def utiPer = round(Utilities,4) * 100;
AddLabel(
1,
"Utilities: "+utiPer+"% XLU #55",
if utiPer > 1.50 then GlobalColor("VeryGood") else
if utiPer > 1 && utiPer <= 1.50 then GlobalColor("Good") else
if utiPer > .5 && utiPer <= 1 then GlobalColor("ModGood") else
if utiPer > .25 && utiPer <= .5 then GlobalColor("SlightlyGood") else
if utiPer > 0 && utiPer <= .25 then GlobalColor("SluggishGood") else
if utiPer == 0 then GlobalColor("Neutral") else
if utiPer < 0 && utiPer >= -.25 then GlobalColor("SluggishBad") else
if utiPer < -.25 && utiPer >= -.5 then GlobalColor("SlightlyBad") else
if utiPer < -.5 && utiPer >= -1 then GlobalColor("ModBad") else
if utiPer < -1 && utiPer >= -1.50 then GlobalColor("Bad") else
if utiPer < -1.50 then GlobalColor("VeryBad") else
Color.black
);

# Materials Sector
def Materials = Sector("$SP500#15");
def matPer = round(Materials,4) * 100;
AddLabel(
1,
"Materials: "+matPer+"% XLB #15",
if matPer > 1.50 then GlobalColor("VeryGood") else
if matPer > 1 && matPer <= 1.50 then GlobalColor("Good") else
if matPer > .5 && matPer <= 1 then GlobalColor("ModGood") else
if matPer > .25 && matPer <= .5 then GlobalColor("SlightlyGood") else
if matPer > 0 && matPer <= .25 then GlobalColor("SluggishGood") else
if matPer == 0 then GlobalColor("Neutral") else
if matPer < 0 && matPer >= -.25 then GlobalColor("SluggishBad") else
if matPer < -.25 && matPer >= -.5 then GlobalColor("SlightlyBad") else
if matPer < -.5 && matPer >= -1 then GlobalColor("ModBad") else
if matPer < -1 && matPer >= -1.50 then GlobalColor("Bad") else
if matPer < -1.50 then GlobalColor("VeryBad") else
Color.black
);

# Consumer Staples Sector
def ConStaple = Sector("$SP500#30");
def conSPer = round(ConStaple,4) * 100;
AddLabel(
1,
"Consumer Staples: "+conSPer+"% XLP #30",
if conSPer > 1.50 then GlobalColor("VeryGood") else
if conSPer > 1 && conSPer <= 1.50 then GlobalColor("Good") else
if conSPer > .5 && conSPer <= 1 then GlobalColor("ModGood") else
if conSPer > .25 && conSPer <= .5 then GlobalColor("SlightlyGood") else
if conSPer > 0 && conSPer <= .25 then GlobalColor("SluggishGood") else
if conSPer == 0 then GlobalColor("Neutral") else
if conSPer < 0 && conSPer >= -.25 then GlobalColor("SluggishBad") else
if conSPer < -.25 && conSPer >= -.5 then GlobalColor("SlightlyBad") else
if conSPer < -.5 && conSPer >= -1 then GlobalColor("ModBad") else
if conSPer < -1 && conSPer >= -1.50 then GlobalColor("Bad") else
if conSPer < -1.50 then GlobalColor("VeryBad") else
Color.black
);

# Information Technology Sector
def InfoTech = Sector("$SP500#45");
def infPer = round(InfoTech,4) * 100;
AddLabel(
1,
"Info Tech: " +infPer+"% XLK #45",
if infPer > 1.50 then GlobalColor("VeryGood") else
if infPer > 1 && infPer <= 1.50 then GlobalColor("Good") else
if infPer > .5 && infPer <= 1 then GlobalColor("ModGood") else
if infPer > .25 && infPer <= .5 then GlobalColor("SlightlyGood") else
if infPer > 0 && infPer <= .25 then GlobalColor("SluggishGood") else
if infPer == 0 then GlobalColor("Neutral") else
if infPer < 0 && infPer >= -.25 then GlobalColor("SluggishBad") else
if infPer < -.25 && infPer >= -.5 then GlobalColor("SlightlyBad") else
if infPer < -.5 && infPer >= -1 then GlobalColor("ModBad") else
if infPer < -1 && infPer >= -1.50 then GlobalColor("Bad") else
if infPer < -1.50 then GlobalColor("VeryBad") else
Color.black
);

# Real Estate Sector
def RealEste = Sector("$SP500#60");
def reaPer = round(RealEste,4) * 100;
AddLabel(
1,
"Real Estate: " +reaPer+"% XLRE #60",
if reaPer > 1.50 then GlobalColor("VeryGood") else
if reaPer > 1 && reaPer <= 1.50 then GlobalColor("Good") else
if reaPer > .5 && reaPer <= 1 then GlobalColor("ModGood") else
if reaPer > .25 && reaPer <= .5 then GlobalColor("SlightlyGood") else
if reaPer > 0 && reaPer <= .25 then GlobalColor("SluggishGood") else
if reaPer == 0 then GlobalColor("Neutral") else
if reaPer < 0 && reaPer >= -.25 then GlobalColor("SluggishBad") else
if reaPer < -.25 && reaPer >= -.5 then GlobalColor("SlightlyBad") else
if reaPer < -.5 && reaPer >= -1 then GlobalColor("ModBad") else
if reaPer < -1 && reaPer >= -1.50 then GlobalColor("Bad") else
if reaPer < -1.50 then GlobalColor("VeryBad") else
Color.black
);


# Industrial Sector
def Industrl = Sector("$SP500#20");
def indPer = round(Industrl,4) * 100;
AddLabel(
1,
"Industrials: " +indPer+"% XLI #20",
if indPer > 1.50 then GlobalColor("VeryGood") else
if indPer > 1 && indPer <= 1.50 then GlobalColor("Good") else
if indPer > .5 && indPer <= 1 then GlobalColor("ModGood") else
if indPer > .25 && indPer <= .5 then GlobalColor("SlightlyGood") else
if indPer > 0 && indPer <= .25 then GlobalColor("SluggishGood") else
if indPer == 0 then GlobalColor("Neutral") else
if indPer < 0 && indPer >= -.25 then GlobalColor("SluggishBad") else
if indPer < -.25 && indPer >= -.5 then GlobalColor("SlightlyBad") else
if indPer < -.5 && indPer >= -1 then GlobalColor("ModBad") else
if indPer < -1 && indPer >= -1.50 then GlobalColor("Bad") else
if indPer < -1.50 then GlobalColor("VeryBad") else
Color.black
);

# Healthcare Sector
def Health = Sector("$SP500#35");
def heaPer = round(Health,4) * 100;
AddLabel(
1,
"Health Care: " +heaPer+"% XLV #35",
if heaPer > 1.50 then GlobalColor("VeryGood") else
if heaPer > 1 && heaPer <= 1.50 then GlobalColor("Good") else
if heaPer > .5 && heaPer <= 1 then GlobalColor("ModGood") else
if heaPer > .25 && heaPer <= .5 then GlobalColor("SlightlyGood") else
if heaPer > 0 && heaPer <= .25 then GlobalColor("SluggishGood") else
if heaPer == 0 then GlobalColor("Neutral") else
if heaPer < 0 && heaPer >= -.25 then GlobalColor("SluggishBad") else
if heaPer < -.25 && heaPer >= -.5 then GlobalColor("SlightlyBad") else
if heaPer < -.5 && heaPer >= -1 then GlobalColor("ModBad") else
if heaPer < -1 && heaPer >= -1.50 then GlobalColor("Bad") else
if heaPer < -1.50 then GlobalColor("VeryBad") else
Color.black
);

# Telecommunication Sector
def Telecoms = Sector("$SP500#50");
def telPef = round(Telecoms,4) * 100;
AddLabel(
1,
"Telecoms: " +telPef+"% XLC #50",
if telPef > 1.50 then GlobalColor("VeryGood") else
if telPef > 1 && telPef <= 1.50 then GlobalColor("Good") else
if telPef > .5 && telPef <= 1 then GlobalColor("ModGood") else
if telPef > .25 && telPef <= .5 then GlobalColor("SlightlyGood") else
if telPef > 0 && telPef <= .25 then GlobalColor("SluggishGood") else
if telPef == 0 then GlobalColor("Neutral") else
if telPef < 0 && telPef >= -.25 then GlobalColor("SluggishBad") else
if telPef < -.25 && telPef >= -.5 then GlobalColor("SlightlyBad") else
if telPef < -.5 && telPef >= -1 then GlobalColor("ModBad") else
if telPef < -1 && telPef >= -1.50 then GlobalColor("Bad") else
if telPef < -1.50 then GlobalColor("VeryBad") else
Color.black
);

def NDX = Sector("NDX");
def ndxPer = Round(NDX, 4) * 100;
def CurrND = +close("NDX", period = AggregationPeriod.DAY);
def ChangeNDX = CurrND - CurrND[1];

addLabel(1, "NASD: "+CurrND +" Chg :" + ChangeNDX + "  (" + ndxPer + "%" + ")  ", if ChangeNDX > 0 then color.cyan else if ChangeNDX < 0 then color.light_gray else if ndxPer > 0 then COLOR.CYAN else color.light_gray);

def DJI = Sector("$DJI");
def djiPer = Round(DJI, 4) * 100;
def CurrDJ = +close("$DJI", period = AggregationPeriod.DAY);
def ChangeDJ = CurrDJ - CurrDJ[1];

addLabel(yes, (Concat("DJI: ", Round (CurrDJ, 1))) + " Chg: " + Round(ChangeDJ) + " (" + djiPer + "%" + ")  ", if ChangeDJ > 0 then color.cyan else if ChangeDJ < 0 then color.LIGHT_GRAY else if djiPer > 0 then COLOR.CYAN else color.LIGHT_GRAY);

def COMP = Sector("COMP:GIDS");
def compPer = Round(COMP, 4) * 100;
def CurrC = +close("COMP:GIDS", period = AggregationPeriod.DAY);
def ChangeC = CurrC - CurrC[1];

addLabel(yes, (Concat("COMP: ", Round (CurrC, 1))) + " Chg: " + Round(ChangeC) + " (" + compPer + "%" + ")  ", if ChangeC > 0 then color.cyan else if ChangeC < 0 then color.LIGHT_GRAY else if compPer > 0 then COLOR.CYAN else color.LIGHT_GRAY);

def RUT = Sector("RUT");
def rutPer = Round(RUT, 4) * 100;
def CurrRU = +close("RUT", period = AggregationPeriod.DAY);
def ChangeRU = CurrRU - CurrRU[1];

addLabel(yes, (Concat("RUT: ", Round (CurrRU, 1))) + " Chg: " + Round(ChangeRU) + " (" + rutPer + "%" + ")  ", if ChangeRU > 0 then color.cyan else if ChangeRU < 0 then color.LIGHT_GRAY else if rutPer > 0 then COLOR.CYAN else color.LIGHT_GRAY);

# End Study
Last edited by a moderator: